SRef-ID: 1432-0576/ag/2005-23-2231 © European Geosciences Union 2005
Annales
Geophysicae
Optical observations geomagnetically conjugate to sprite-producing
lightning discharges
R. A. Marshall1, U. S. Inan1, T. Neubert2, A. Hughes3, G. S´atori4, J. B´or4, A. Collier3, and T. H. Allin5
1STARLab, Stanford University, Stanford, CA, USA 2Danish Space Research Institute, Copenhagen, Denmark 3University of KwaZulu-Natal, Durban, South Africa
4Geodetic and Geophysical Research Institute, Sopron, Hungary 5Danish Technical University, Lyngby, Denmark
Received: 5 July 2004 – Revised: 12 March 2005 – Accepted: 25 March 2005 – Published: 15 September 2005
Abstract. Theoretical studies have predicted that large positive cloud-to-ground discharges can trigger a runaway avalanche process of relativistic electrons, forming a geo-magnetically trapped electron beam. The beam may un-dergo pitch angle and energy scattering during its traverse of the Earth’s magnetosphere, with a small percentage of electrons remaining in the loss cone and precipitating in the magnetically conjugate atmosphere. In particular,N21P and N2+1N optical emissions are expected to be observable. In July and August 2003, an attempt was made to detect these optical emissions, called “conjugate sprites”, in correlation with sprite observations in Europe nearL≃1.78. Sprite ob-servations were made from the Observatoire du Pic du Midi (OMP) in the French Pyren´ees, and VLF receivers were in-stalled in Europe to detect causative sferics and ionospheric disturbances associated with sprites. In the Southern Hemi-sphere conjugate region, the Wide-angle Array for Sprite Photometry (WASP) was deployed at the South African Astronomical Observatory (SAAO), near Sutherland, South Africa, to observe optical emissions with a field-of-view magnetically conjugate to the Northern Hemisphere observ-ing region. Observations at OMP revealed over 130 docu-mented sprites, with WASP observations covering the conju-gate region successfully for 30 of these events. However, no incidences of optical emissions in the conjugate hemisphere were found. Analysis of the conjugate optical data from SAAO, along with ELF energy measurements from Palmer Station, Antarctica, and charge-moment analysis, show that the lightning events during the course of this experiment likely had insufficient intensity to create a relativistic beam. Keywords. Ionosphere (Ionsophere-magnetosphere interac-tions; Ionospheric disturbances; Instruments and tech-niques)
Correspondence to:R. A. Marshall ([email protected])
1 Introduction
Detection of terrestrial gamma-rays above active thunder-storms on the Compton Gamma-Ray Observatory (CGRO) has provided evidence of relativistic electrons in the upper atmosphere (Fishman et al., 1994). These gamma-ray flashes result from brehmsstrahlung radiation from relativistic elec-trons. Several of these gamma-ray flashes were found to be coincident with large positive cloud-to-ground (+CG) light-ning flashes below the CGRO pass (Inan et al., 1996), provid-ing evidence that a lightnprovid-ing flash is causatively associated with these relativistic electrons. Further evidence is provided by Dwyer et al. (2004), who observe gamma-rays originating from 6–8 km altitude associated with rocket-triggered light-ning.
A 1-D fully electrodynamic model developed by Lehtinen et al. (2001) predicts the formation of a beam of relativistic electrons propagating away from the thundercloud and into the magnetosphere, where the electron trajectories are con-fined to magnetic field lines. Following the charge removal by the +CG, a quasi-electrostatic field is established between the cloud and the ionosphere above it. This field accelerates seed relativistic electrons (created by a constant flux of cos-mic rays from space), initiating an avalanche process in the upper atmosphere. The resulting intense beam of electrons is accelerated upwards, generates gamma-ray emissions at alti-tudes of∼60 to 70 km, and travels through the lower iono-sphere and into the magnetoiono-sphere.
−10 −5 0 5 10 15 20 25 35
40 45 50 55
Europe Region
0 5 10 15 20 25 30 35 40
−45 −40 −35 −30 −25 −20
Southern Africa region
Fig. 1. Regions of interest for conjugate sprite experiment. In Southern Africa region, rings are centered on SAAO and are spaced at 200 km radius. Each point is magnetically conjugated to the Eu-ropean region.
200 400 600 800 1000
10-5 100 105
Q, C N R
at 80 km altitude, m
-3
point charge h+=10 km
disk charge
h+=20 km
point charge
h+=20 km
disk charge h+=10 km
Fig. 2. Charge removed versus injected beam density for point and disc charge configurations, at altitudes of 10 and 20 km. From Lehtinen et al. (2001).
latitude; at latitudes of 30–40 deg, this number varies from 10 down to 3% (Lehtinen et al., 2001). However, even if only
∼3 to 10% of the electrons precipitate on the conjugate at-mosphere, they create detectable emissions via interactions with atmospheric species. For 500 C of charge removed from 15 km altitude (Mq=7500 C-km), consistent with the largest observed gamma-ray fluxes, the injected beam den-sity isNe=105m−3, and the predicted emissions should be
of a similar magnitude to elves (Lehtinen et al., 2001). While this charge moment is very high compared to observed val-ues (e.g., Cummer and Inan, 2000), it results in a relativistic beam density that is consisted with BATSE gamma-ray flash observations (Lehtinen et al., 2001).
In this paper, we report results of an experimental attempt to detect these optical emissions following large +CG light-ning strikes. This experiment is motivated by observations of BATSE terrestrial gamma-ray flashes associated with light-ning, which provide real evidence for the existence of rel-ativistic electron beams created by lightning. Sprite obser-vations in the Northern Hemisphere are complemented by photometric measurements taken from South Africa, at the geomagnetically conjugate point to the lightning strikes. Ex-amples of data are presented along with charge moment and ELF energy measurements.
2 Experimental setup
The experiment was conducted in July and August 2003 from the South African Astronomical Observatory (SAAO) near Sutherland, South Africa, to observe conjugate signatures of relativistic electron beams. The region of interest of lightning activity lies in the South of France and the Alps, as shown in Fig. 1. These magnetically conjugate regions are ideally suited to the experiment, offering high lightning activity in the local (Europe) region, good observing conditions over land in the conjugate region, mid-magnetic latitudes, and ad-ditionally, recent documentation of sprite activity in the local region (Neubert et al., 2001).
Following the model predictions in Lehtinen et al. (2001), we should expect to see emissions of intensity
∼1 MR (one mega-rayleigh; one rayleigh is 106/4πphotons cm−2str−1nm−1) due to a point charge removal of∼750 C from 10 km altitude, lasting about 1 ms. However, as shown in Fig. 2, the relationship between charge removed and beam density injected is highly non-linear. The noise limit of the instrument is about 1 kR; this requires a beam density of 102m−3 (see Lehtinen et al., 2001), or a charge removed (from 10 km altitude) of about 600 C. Optical emissions are expected to be delayed from the CG time, and the delay is defined by the bounce time for an energetic electron, which is weakly dependent on pitch angle (Walt, 1994). For 1 MeV electrons, we expect a delay between the +CG and the con-jugate emissions of about 60 ms, corresponding to the prop-agation time atL≃1.78 (location of SAAO).
2.1 Instrumentation at SAAO
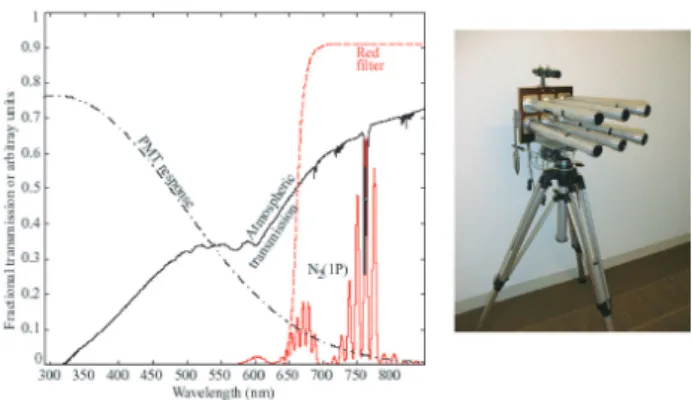
The Wide-angle Array for Sprite Photometry (WASP) is an array of six Hamamatsu HC104 photomultiplier tube assem-blies (PMTs), as shown in Fig. 3. The PMTs are outfitted with lenses yielding a field-of-view of∼3-by-6◦
for each el-ement. The tubes are arranged with non-overlapping fields-of-view, so that the resulting field-of-view is∼6-by-16◦
Each PMT is also fitted with a longpass optical filter with 665.0 nm cutoff, except one, which has a 3.0 nm bandwidth filter centered at 427.8 nm, which is anN2+1Nemission line. The response curve of the PMTs is shown in Fig. 3, along with the response curves for the red filters, the emission band structure for the 1st positive band of molecular nitrogen (N21P), and the atmospheric transmission curve forN21P.
The PMTs have built-in 8 MHz bandwidth amplifiers. The signals from the PMTs are filtered at 10 kHz and sampled at 25 kHz per channel. Additionally, GPS timing signals are recorded with the data, as well as two channels of broad-band (300 Hz to 10 kHz) VLF data. The VLF receiver con-sists of orthogonal magnetic loop antennas, aligned with ge-ographic North-South and East-West, fed into a preamplifier and signal-conditioning unit. This signal is then low-pass fil-tered with the WASP data at 10 kHz and sampled at 25 kHz. Finally, video images overlapping the region viewed by the photometers is recorded using an intensified CCD camera for monitoring of local sky conditions.
2.2 Coordination with sprite observations
Sprite observations were made from the Observatoire du Pic du Midi (OMP) in the French Pyrenees, using two JAI CV-S3200 cameras fitted with monochrome 1/2′′ Sony ExView
CCDs. The system was set up to be remotely-controlled over the internet. Images that triggered the system were recorded and posted in real-time to the internet, along with lightning data provided by METEORAGE. The lightning data was ad-ditionally geomagnetically mapped to the conjugate region in real time, providing the locations of expected optical emis-sions. Local sprite and conjugate observations were coordi-nated whenever possible to give the best chance of seeing both events simultaneously.
Lightning is observed over Europe and mapped to the con-jugate region using IGRF field models, updated annually, provided by NASA. The lightning data in Europe is mapped between 60 km altitudes, introducing some error into the lo-cation of the precipitation, which is added to the error inher-ent in drift variations of the Earth’s magnetic field over the course of a year. These errors can add up to 20 km, simi-lar to the expected size of the precipitation region. However, the use of six non-overlapping fields-of-view ensures that the error is such that we can still be sure that most of the pre-cipitation regions are within the field-of-view of the overall instrument.
3 Description of data
From 23 July to 29 August, 66 h of data were recorded with the WASP system, corresponding to thousands of +CG strokes in the European region of interest. When mapped to the conjugate region during recording times, over 1600 of these +CG’s fell within the field-of-view of the instru-ment. These positive CG’s ranged in intensity from<10 kA to 246 kA, with a mean of 37.1 kA.
Fig. 3. Photometer response curve, atmospheric transmission, and filter response; and the WASP Instrument, consisting of six photo-multiplier tubes aligned for a total Field-of-view of 6-by-16◦.
Sprite imaging data from OMP documented the occur-rence of over 130 sprites during the same period, all as-sociated with +CG lightning discharges. Of these, 30 oc-curred during times and at locations for which WASP data was acquired, with at least one of the six WASP photometers viewing the altitudes in the conjugate region at which optical emissions would be expected.
No optical events associated with sprites or +CG’s were found in the conjugate hemisphere. However, the 30 coor-dinated conjugate observations made constitute the first such optical observations in regions geomagnetically conjugate to sprites. We have associated our data with sprite observations because charge moments have been seen to be a good predic-tor of sprite occurrence (e.g., Hu et al., 2002); hence those CG’s that produce sprites are the most likely to create rel-ativistic beams. Two examples of observations associated with sprites are described below, along with an example of photometer response to a flashing airplane beacon.
3.1 CASE 1: 28 August 2003, 23:41:54 UT
14 16 18 20 -33
-32 -31 -30 -29 -28 -27
Conjugate region
longitude
latitude
0 5 10
38 40 42 44 46 48 50
European region
latitude
14 16 18 20
-34 -33 -32 -31 -30
Conjugate region
longitude
latitude
0 5 10
38 40 42 44 46 48 50
European region
latitude
0
1 PMT 1
kR
0 0.01
0.02 PMT 2
V
o
lts
0
2 PMT 3
kR
0 1
2 PMT 4
kR
0
2 PMT 5
kR
0.05 0.1 0.15 0.2 0.25 0.3 0.35 0.4 0.45
0 1
2 PMT 6
kR
Seconds after 23:21:54.3 UT, 28Aug2003
(a)
(b)
(d)
(g) (e)
Time of expected emissions
0.1 0.2 0.3 0.4 0.5 0.6 0.7 0.8 0.9
5 0 5
nT
Nancay VLF
0.55 0.555 0.56 0.565 0.57 0.575 0.58 0.585 0.59
0.05 0
0.05 Palmer VLF
nT
Time (s) after 28Aug2003 23:21:54
0.1 0.2 0.3 0.4 0.5 0.6 0.7 0.8 0.9
5 0 5
nT
Nancay VLF
0.145 0.15 0.155 0.16 0.165 0.17 0.175 0.18
0.05 0
0.05 Palmer VLF
nT
Time (s) after 23Jul2003 23:21:41
(c)
(f)
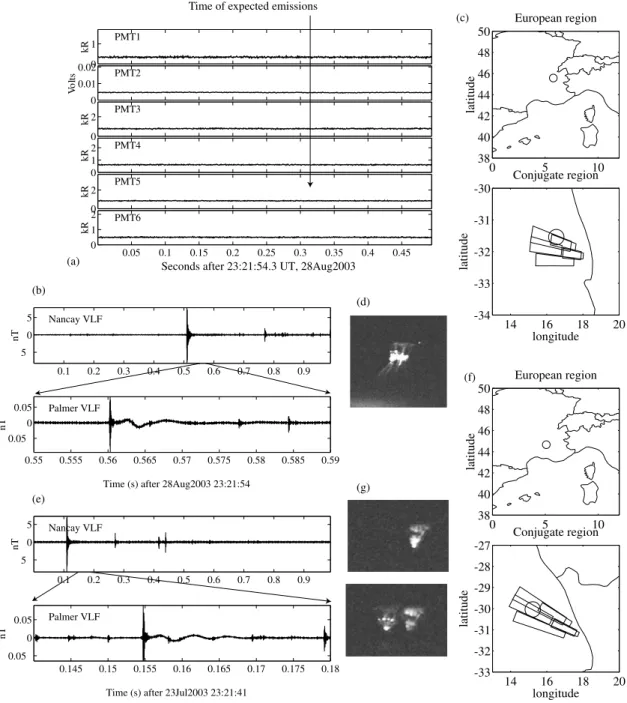
Fig. 4. Example data. (a)Photometer data from 28 August 2003, with time shown when 1 MeV electrons would precipitate;(b) Corre-sponding Nanc¸ay and Palmer VLF data, where Palmer demonstrates the “slow-tail” of the sprite-causing +CG;(c)Corresponding regions of interest, showing location of sprite over Europe (circle), its location mapped to the conjugate region, and the photometers’ field-of-view.(d)
Corresponding sprite image.(e),(f)and(g)are equivalent to (b), (c) and (d) for an event of 23 July 2003. on 23 July 2003.
in the conjugate region due to precipitating energetic elec-trons would have fallen within the instrument field-of-view. Figure 4d shows the sprite as observed from OMP.
3.2 CASE 2: 23 July 2003, 23:21:41 UT
Figure 4 also shows an example from 23 July 2003, at 23:21:41 UT. Photometer data is omitted to avoid redun-dancy. Figures 4e, f and g correspond to the similar pan-els b, c, and d for the event of 28 August 2003. Again we note that the sprite location, when mapped to the conjugate
region, falls within the instrument field-of-view, yet again, no emissions were detected.
3.3 CASE 3: Airplane flash
flash is very easily detected by the photometers despite the small area of brightening in comparison to the individual photometer field-of-view. This example is presented to show the working operation of the instrument in terms of its sen-sitivity in detecting small changes in optical intensity and its time resolution.
4 Analysis
The data examples in Figs. 4 and 5 show that any con-jugate optical emissions must have been below the noise background of the nighttime sky,∼1–3 kR during the times shown. However, model predictions indicate that if the light-ning discharges had large enough charge moments, peak emission intensities of up to 1 MR may occur. Due to the highly nonlinear nature of the avalanche process, the most likely explanation for the lack of emissions is that none of the +CG’s considered created a large enough charge moment to create an appreciable relativistic beam.
This preliminary conclusion is supported by measure-ments of ELF sferic energy detected at Palmer Station, Antarctica, and by the charge moment calculations based on ELF observations at Nagycenk, Hungary, both of which are discussed below. By showing both ELF energies and charge moments for both Europe and the Midwestern U.S., we can verify the absolute charge moment values in the following way: ELF energies computed for strokes in Europe are com-pared to those in the U.S., and a difference is noted. Then, charge moments are compared to those in the U.S., and the difference is seen to be comparable.
4.1 Charge moments
Charge moments have been deduced from Schumann reso-nance (SR) transients detected in the vertical electric and hor-izontal magnetic field components in the frequency band of 5–30 Hz in the ELF (3 Hz–3 kHz) range at Nagycenk, Hun-gary, during the EuroSprite2003 Campaign. The charge mo-ments were derived from the current moment spectra by as-suming exponentially decaying current in the time domain. Huang et al. (1999) showed that this assumption is partic-ularly valid for sprite producing lightning flashes. Current moment spectra of the events processed here were estimated by comparing the measured spectra of the field components to the corresponding theoretical ones characteristic for the source distance (Huang et al., 1999). Theoretical spectra of the vertical electric and the horizontal magnetic field compo-nents were calculated using the Wait/Jones model in which the ground is considered perfectly conductive and the iono-sphere is isotropic and characterized by the mean of three ionospheric conductivity profiles presented in Jones (1967). The parent lightning strokes of sprites, which can excite the Earth-ionosphere cavity resonator, can be modeled by a ver-tical electric dipole. Jones and Kemp (1970) showed that theoretical spectra of electromagnetic field components of a vertical electric dipole agree well with experimental results if
0 5 PMT 1
kR
0 0.01
PMT 2
Volts
0 5 10 PMT 3
kR
0 5 10
PMT 4
kR
0 10 20 PMT 5
kR
0.05 0.1 0.15 0.2
0 10 PMT 6
kR
Seconds after 18:13:37.5 UT, 06Aug2003
18:13:37.585 18:13:37.618
Fig. 5. Example data for 6 August 2003, demonstrating the effect of an airplane’s beacon on the photometers’ responses. The flash (circled in the images) appears in two photometers due to scattering from clouds.
they were calculated from formulae of Wait (1962) including the wave propagational parameters of Jones (1967).
Two methods were used to determine the charge moment from the evaluated current moment spectrum. Both methods are based on finding that exponential function Fourier trans-form of which is the best approximation to the current mo-ment spectrum estimated. The charge momo-ment is then calcu-lated as the time integral of the determined exponential func-tion (Burke and Jones, 1996; Huang et al., 1999).
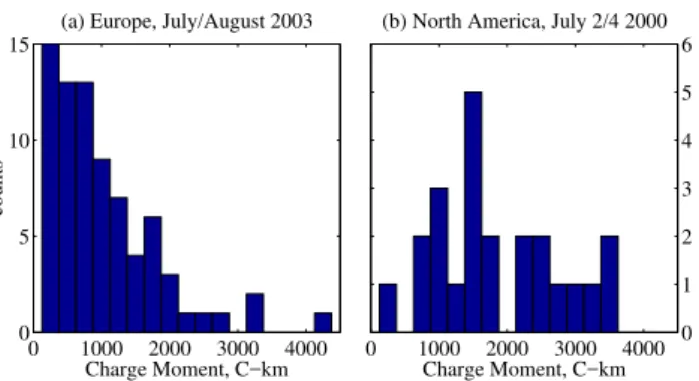
The distribution of charge moments for 76 sprite-producing +CG’s during the time of sprite observations in Europe is shown in Fig. 6. The largest of these charge moments is about 4100 C-km, while the median is about 800 C-km. The charge moment values derived here can be considered rough estimations due to the rather narrow band-width of the recording system and local electromagnetic dis-turbances.
A distribution of 23 typical charge moments in the Mid-western United States is also shown for comparison, taken from two storms on 2 July and 4 July 2000. The charge moments from the U.S. are computed using a deconvolution method, as described in Cummer and Inan (2000). An im-pulse response for the Earth-Ionosphere waveguide propaga-tion path between the lightning strike and the receiver is com-puted using the Long-Wave Propagation Capability (LWPC). The “output”, the received signal, is then deconvolved with the LWPC impulse response to find the “input”, which is the lightning current waveform.
0 1000 2000 3000 4000 0
5 10 15
(a) Europe, July/August 2003
Charge Moment, C−km
counts
0 1000 2000 3000 4000 0
1 2 3 4 5 6 (b) North America, July 2/4 2000
Charge Moment, C−km
Fig. 6.Charge Moments calculations from(a)European +CG’s in 2003 and(b)Midwestern U.S. strikes from 2 and 4 July 2000.
−20 0 20
0 1 2 3 4 5 6 7
ELF Energy (dB) (a) Europe
counts
−20 −10 0 10 20 0
2 4 6 8 10 12 14
ELF Energy (dB) (b) North America
Fig. 7.ELF energy content of +CG’s recorded at Palmer Station.(a)
Europe 2003;(b)Midwestern United States, adapted from Reising et al. (1996). Shaded regions denote sprite-causing +CG’s, while empty regions denote non-sprite-producing +CG’s.
sprite-causing strokes in North America (median of about 1500 C-km). Additionally, as mentioned above, the maxi-mum charge moment found in Europe is only 4100 C-km, smaller than the 6000 C-km predicted for detectable (1 kR) emissions.
4.2 Palmer ELF energy
Reising et al. (1996) found that the ELF energy content of a +CG was a better measure of sprite occurrence than the peak currents typically recorded by a lightning detection network. While a well-established measure of the sprite-producing ca-pacity of a lightning event is the charge moment (defined as the amount of charge removed multiplied by the vertical channel length), the ELF energy content gives a good mea-sure of the continuing current in a +CG, and it is this continu-ing current that is responsible for movcontinu-ing most of the charge from cloud to ground. Figure 7 shows a statistical compari-son of typical ELF sferic energies is the Midwestern United States with those in Europe, as calculated at Palmer Sta-tion, Antarctica (64◦
40′
S, 60◦
0′
W). The Stanford-operated VLF receiver system at Palmer Station consists of orthogo-nal magnetic field loop antennas, fed into an amplifier system with response from 350 Hz to 40 kHz (see Fig. 4 for exam-ples of Palmer data). ELF energies for sferics detected at
Palmer are calculated by low-pass filtering at 1.5 kHz and integrating the square of the field amplitude from 2 ms be-fore the sferic to 20 ms after, as in Reising et al. (1996). The difference in 0 dB reference values between Europe and North America is adjusted for propagation distance to Palmer by the following method. ELF attenuation rates increase with frequency, and are in the range from 0 to 5 dB/Mm at frequencies from 1 Hz to 1 kHz (Sukhorukov and Stubbe, 1997). The received signal at Palmer has a spectral peak at 200 Hz; at this frequency the attenuation in the Earth-Ionosphere waveguide is about 2 dB/Mm (Sukhorukov and Stubbe, 1997). The amplitudes of ELF energies received from Europe are shifted by this amount to compare them to ELF energies of North American lightning strikes. Even so, we see that the ELF content is statistically smaller for the European strikes than for the North American strikes, and is higher for sprite-causing strikes, as found previously (Reis-ing et al., 1999). This supports the find(Reis-ing of statistically lower charge moments originating from Europe compared to those from North America.
5 Summary and discussion
We present the first optical measurements in the region geo-magnetically conjugate to known sprite locations; these con-jugate observations have been made coincident with about 30 sprites observed in Europe. Additionally, observations have been made coincident with over 1600+CG’s, for most of which simultaneous optical observations in the local re-gion did not exist, so that the occurrence of sprites is not known.
Since the background noise of the night sky is∼1 kR in the wavelength band of interest, we conclude that any optical emissions in the conjugate hemisphere must have been below this noise level. It is highly likely that no discernible rela-tivistic beam was created by any of the 1600+CG’s analyzed, and thus there were no optical emissions. The reason for this lack of a relativistic beam may be that the lightning strikes in Europe removed insufficient charge to create a dense enough runaway avalanche beam.
Acknowledgements. This work was supported by a Texas In-struments Stanford Graduate Fellowship, and ONR Grant N00014-03-1-0333. The authors would like thank the South African Astronomical Observatory for the use of its facility, and to ME-TEORAGE for access to real-time lightning data. G. S´atori’s and J. B´or’s contribution was supported by Grants T034309 and TS 408048 from the Hungarian Science Foundation.
Topical Editor T. Pulkkinen thanks two referees for their help in evaluating this paper.
References
Burke, C. P. and Jones, D. L. I.: On the polarity and continuing cur-rents in usually large lightning flashes deduced from ELF events, J. of Atmos. and Solar Terr. Phys., 58, 531–540, 1996.
Cummer, S. A. and Inan, U. S.: Modeling ELF radio atmospheric propagation and extracting lightning currents from ELF observa-tions, Radio Sci., 35, 2, 385–394, 2000.
Dwyer, J. R., Rassoul, H. K., and Al-Dayeh, M., et al.: A ground level gamma-ray burst observed in association with rocket-triggered lightning, Geophys. Res. Lett., 31, L05119, 2004. Fishman, G. J., Bhat, P. N., and Malozzi, R., et al.: Discovery of
intense gamma-ray flashes of atmospheric origin, Science, 264, 1313, 1994.
Hu, W., Cummer, S. A., Lyons, W. A., and Nelson, T. E.: Lightning charge moment changes for the initiation of sprites, Geophys. Res. Lett., 29, 8, 1279–1282, 2002.
Huang, E., Williams, E., Boldy, R., Heckman, S., Lyons, W., Taylor, M., Nelson, T., and Wong, C.: Criteria for sprites and elves based on Schumann resonance observations, J. of Geophys. Res., 104, D14, 16 943–16 964, 1999.
Inan, U. S., Reising, S. C., Fishman, G. J., and Horack, J. M.: On the association of terrestrial gamma-ray bursts with lightning and implications for sprites, Geophys. Res. Lett., 23, 9, 1017–1020, 1996.
Jones, D. L. I. and Kemp, D. T.: Experimental and theoretical ob-servations of Schumann resonances, J. of Atmos. and Solar Terr. Phys., 32, 1095–1108, 1970.
Jones, D. L. I.: Schumann Resonances and e.l.f. propagation for inhomogeneous, isotropic ionosphere profiles, J. of Atmos. and Solar Terr. Phys., 29, 1037–1044, 1967.
Lehtinen, N. G., Inan, U. S., and Bell, T. F.: Effects of thunderstorm-driven runaway electrons in the conjugate hemi-sphere: purple sprites, ionization enhancements, and gamma rays, J. of Geophys. Res., 106, A12, 28 841–28 846, 2001. Neubert, T., Allin, T. H., Stenbaek-Nielsen, H., and Blanc, E.:
Sprites Over Europe, Geophys. Res. Lett., 28, 18, 3585–3588, 2001.
Reising, S. C., Inan, U. S., Bell, T. F., and Lyons, W. A.: Evidence for continuing current in sprite-producing cloud-to-ground light-ning, Geophys. Res. Lett., 23, 24, 3639–3642, 1996.
Reising, S. C., Inan, U. S., and Bell, T. F.: ELF sferic energy as a proxy indicator for sprite occurrence, Geophys. Res. Lett., 26, 7, 987–990, 1999.
Sukhorukov, A. I. and Stubbe, P.: On ELF pulses from remote light-nings triggering sprites, Geophys. Res. Lett., 24, 13, 1639–1642, 1997.
Wait, J. R.: Electromagnetic Waves in Stratified Media, 2nd Ed. Pergamon Press, New York, 153, Sect. 5, 1962.