www.atmos-meas-tech.net/10/273/2017/ doi:10.5194/amt-10-273-2017
© Author(s) 2017. CC Attribution 3.0 License.
Dust opacities inside the dust devil column in the Taklimakan Desert
Zhaopeng Luan1,2,3, Yongxiang Han1,2, Tianliang Zhao1,2, Feng Liu1,2, Chong Liu1,2, Mark J. Rood4, Xinghua Yang5, Qing He5, and Huichao Lu3
1Collaborative Innovation Center on Forecast and Evaluation of Meteorological Disasters, Nanjing University of Information Science and Technology, Nanjing, 210044, China 2Key Laboratory for Aerosol-Cloud-Precipitation of China Meteorological Administration, Nanjing University of Information Science and Technology, Nanjing, 210044, China 3Tai’an Meteorological Bureau, Tai’an, 271000, China
4Department of Civil & Environmental Engineering, University of Illinois at Urbana-Champaign, Illinois 61820, USA 5Institute of Desert Meteorology, China Meteorological Administration, Ürümqi, 830002, China
Correspondence to:Tianliang Zhao ([email protected])
Received: 9 July 2016 – Published in Atmos. Meas. Tech. Discuss.: 10 August 2016 Revised: 27 December 2016 – Accepted: 4 January 2017 – Published: 24 January 2017
Abstract. The distribution of dust aerosols in dust devils (DDs) is quantitatively characterized here based on a field observation. We applied the digital optical method (DOM) with digital still cameras to quantify the opacity of the DDs in the Taklimakan Desert, China. This study presents the fol-lowing unique and important results: (1) the distinct horizon-tal distributions of opacity proved the existence of DDs’ eye, similarly to the eye of tropical cyclone; (2) the opacity of the DDs decreases with increasing height; however, the dust aerosols do appear to settle out, and the relatively calm eye leads to a minimum in dust opacity at the eye; (3) the hor-izontal distribution of opacity is quasi-symmetric with a bi-modal across the eye of the DDs, which could be resulted from the ambient air conditions; and (4) a new method is developed for characterizing the three-dimensional structure of DDs based on the observed two-dimensional opacity pro-vided by DOM. This study not only proposes a highly reli-able, low-cost and efficient methodology to capture the opti-cal structure of DDs, but it could also provide the information on estimation of dust emissions driven by DDs.
1 Introduction
Well-defined vortexes that range from 1 to 1000 m tall (Lorenz et al., 2016), also known as dust devils (DDs), are the most common small-scale (< 50 m diameter at ground level) dust transmitting system in the atmosphere (Lorenz et
fluc-2012, 2013). In addition, large eddy simulations (LESs) have also been applied to DD studies by Kanak (2005) and Ito et al. (2010). The condition of weaker wind and stronger sur-face heat flux favorable for the formation of dust devil is confirmed according to their studies. Gu et al. (2003, 2010) provided the meteorological characteristics inside of DDs by numerical simulation. And Klose and Shao (2016) simulated DD by using WRF/LES-Dto, revealing that the maximum emissions are determined by atmospheric stability. However, field observations of DDs for validating the modeling results including vortex dynamics are critical and necessary (Leovy, 2003).
The digital optical method (DOM) was developed to measure opacities of plumes emitted from stationary point sources (Du et al., 2007, 2009). DOM uses a digital still cam-era and software for processing the digital pictures to deter-mine plume opacity. This method was also used to quantify plume opacities for fugitive dust plumes (Du et al., 2013). DOM was developed to provide digital record of plume opac-ity at low cost, easy implementation, with improved accuracy compared to human observations of plume opacity.
We conducted a DD field campaign in the Taklimakan Desert, the largest desert in China and the world’s second largest flow desert, during July 2014. This study is the first to apply DOM to characterize the internal structure of DDs in the Taklimakan Desert. Two-dimensional (2-D) structures of dust devils are archived with the digital images of the DD by processing with DOM software. This effort provides hor-izontal and vertical distributions of opacity values in DDs and presents the three-dimensional (3-D) opacity structure of DDs. It is important to quantify the structure of DDs. The study thus serves to provide insightful information for DD formation mechanism and numerical simulation.
2 Methods
2.1 Image acquisition and processing
The observational site is located in the Xiaotang region (40◦50′N, 84◦10′E; altitude 943.9 m), in the hinterland of
the Taklimakan Desert (see Fig. 1). Xiaotang is a typical
A digital image of a typical DD is illustrated in Fig. 1 to describe how to determine the DD opacity values. The verti-cal curved lines were added to the image to represent auxil-iary lines describing vertical grids for estimation of opacity values. The sky background of the DD is relatively uniform as shown in Fig. 1. Fifteen large dust devils were observed during the observation period. And this case was selected with a reference substance for the DD’s scale. The upright electric pole right next to the DD with a height of 4.5 m was a reference to measure the height and diameter of the DDs. The DD with a base radius of 6.4 m and a height of 23.0 m has a maximum diameter of 15.8 m at the height of 16.0 m. We defined the “upper end” of a dust devil with an opacity of close to zero. In order to examine the spatial distribution of dust aerosols within the DD’s dust cone, we horizontally set the cone into 0.4 m grids with 15 auxiliary upward lines parallel to the DD’s conical surface. The centerline (line 0) is a vertical line from the bottom of the DD’s eye. For the further analysis of DD structure, we count lines on the left of the centerline from 1 to 7, while denoting lines to the right of the center from A to H (Fig. 1b).
2.2 Calculation of opacity
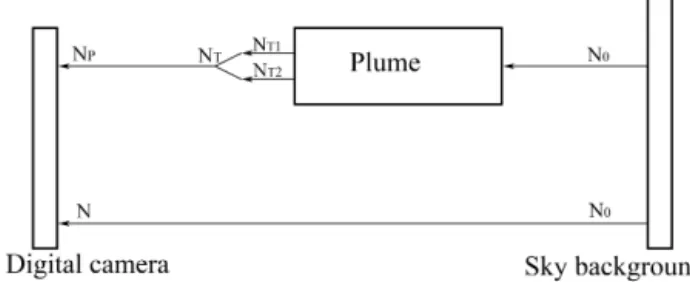
DOM’s transmission model was used in this study due to the uniform background sky conditions (e.g., uniform clear or overcast sky) for the DDs. And the challenge to install con-trasting backgrounds behind and next to the DDs as needed with DOM’s contrast model (Du et al., 2007). The transmis-sion model calculates the plume’s opacity based on the ra-diance from the plume and the rara-diance from the plume’s background. Part of the radiance (N0)from the sky is lost as it passes through the plume due to light scattering and/or absorption.N denotes the radiances received by the charge-coupled device (CCD) of the digital camera that correspond to the sky background, in terms of pixel values:
N=N0T0+N∗, (1)
whereT0denotes the transmittance of the plume-free atmo-sphere along the path between the camera and the sky back-ground.N∗is the path radiance of the atmosphere along the
radi-Figure 1.A typical DD observed on 2 July 2014 with(a)the original photo and(b)the image marked with black lines, letters and numbers for the analysis of DD vertical structures. An upright pole near the DD as a reference for measuring the DD.
ances scattered into the sight path by ambient air and aerosols (Du et al., 2013) and can be estimated with an equilibrium radiance model for uniform illumination and negligible ab-sorption:
N∗=N0(1−T0) . (2) From the two equations, we get the results ofN=N0.
Therefore, when the radiance reaches the camera (Np), it is caused by the attenuated radiance value from the plume (NT1), diffusive radiance value (NT2), and attenuation of the radiance caused by the surrounding atmosphere (which is negligible compared to the DD). The attenuated radiance value (NT1)results fromN0after the light is scattered and/or absorbed by the plume and the diffusive radiance value (NT2) is caused by other sources of light than the uniform sky back-ground (Fig. 2). According to the definition of opacity, opacity=1−Nt1
N0
=1−Np −Nt2
N . (3)
Because the camera did not directly measureNt2, the propor-tionality coefficient,K, is defined byNt2=K×N×opacity (Du et al., 2007), and then the plume opacity could be deter-mined by the transmission model as described by
opacity=1 −Np
N
1−K. (4)
Npis the equivalent radiance value recorded by the camera, in terms of pixel values, caused by radiance from the plume (NT)and path radiance of the atmosphere.N is the
equiva-lent radiance value recorded by the camera, in terms of pixel values, after N0passes through the DD-free atmosphere.K value of 1.4 in the transmission model is used.
Figure 2.Schematic of the transmission model determining plume opacity.
3 Results and analysis
3.1 The vertical profile of opacity
Figure 3a and b demonstrate the opacity profiles of the verti-cal lines, as shown in Fig. 1. It can be seen that (1) the opacity profiles are non-uniform in the vertical direction, and the ver-tical variation of opacity becomes more significant from the inner to the outer portions of the conical dust plume (see both Fig. 3a and b), (2) the opacity profiles from center to both sides show only a quasi-symmetry, and (3) the opacity values generally decrease with height with the larger change rates at lower levels than upper ones. The averaged lapse rates (per-cent change in opacity values with increasing height) for the profile are 4.1 and 0.6 % per meter respectively below and above the height of 10 m.
3.2 The horizontal variation of opacity
From the horizontal variation of the opacity at different levels (Fig. 4), the following is observed:
Figure 3.Vertical opacity profiles of dust devils.
Figure 4.Horizontal variation of the DD’s opacity (%) at different levels.
2. The opacity within the DD decreases with height with a monotonically decreasing function. The maximum opacity is observed at the bottom of the DD.
3. On the right side of the DD, the magnitude of opacity is greater than on the left side. The DOM method is able to capture all important well-known natures of DD includ-ing non-absolute symmetry and internal inhomogeneity.
3.3 Two-dimensional distribution of the quantized DD’s opacity
The 2-D distribution of the DDs reflects the basic features of inhomogeneity and quasi-symmetry inside the DD. The method to quantify spatial distribution of opacity is able to present the similar spatial variability like grid boxes defined in DD numerical models to simulate spatial distribution of physical properties (Mason et al., 2013; Gu et al., 2006). In
addition, other cases with the undermined height and width of DDs also show similar structures (Fig. 5).
The opacity is related to the aerosol concentration, com-position, and size distribution in DDs (Metzger et al., 1999). The value of the opacity is assumed to decrease with increas-ing height due to gravity that prevents larger particles from traveling to the upper parts of the DD. Therefore, it is ex-pected that smaller particles could be transmitted to higher altitudes (Gu et al., 2003, 2007). A distinct vertical opacity gradient develops with small values at the center portion of the DD. The large particles decrease due to the gravitational settling and the fine particles continue to rise with height. However, the change of vertical air flow could lead to the ver-tical decreases in concentrations of fine dust for the declin-ing opacity of DDs with height. These results are consistent with those from numerical simulations by Gu et al. (2007), Gierasch and Goody (1973), and Gierasch (1974).
3.4 The DD eye and the three-dimensional distribution of opacity
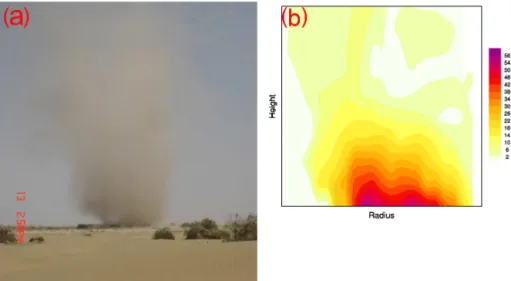
dis-Figure 5.The DD observed on 13 July 2014 with(a)original photo and(b)the quantized DD’s opacity.
Figure 6.A diagram of DD’s horizontal section model with varia-tion of opacity.
tance from B to C. We assume the horizontal opacity values are constant between B and C.
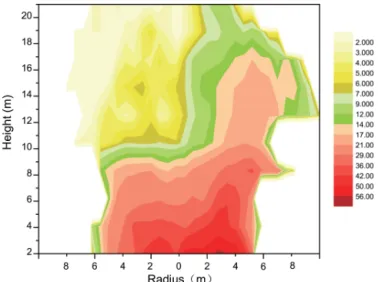
A more detailed example in Fig. 4 describes the DD with the diameter of 12 m and the height of 4 m. The horizontal variation of opacity shows an obvious bimodal distribution. The peak opacity value is located 3 m away from the DD’s centerline. Therefore, it can be determined that the outer ra-dius of DD is 6 m and the inner rara-dius of DD’s eye is 3 m at the same height. Every segment (e.g., B to C) is divided into four equal sub-segments, and the horizontal distribution can be derived accordingly. By calculating the horizontal dis-tribution at different heights (i.e., at 3, 6, 9, and 12 m), we present the 3-D structure of DD as shown in Fig. 7. The opac-ity values increase first and then decrease from the center to both sides of the DD for the bimodal distribution. The 3-D structure of DD in Fig. 7 represents the inhomogeneity and quasi-symmetric opacity distribution.
The results demonstrate that the methodology to derive the 3-D structure in a DD is feasible and practicable. The future effort to improve this methodology is to identify and
quan-Figure 7.A 3-D structure of the DD’s opacity.
tify discrepancies between the assumed and observed opacity values from B to C. It can be realized using more cameras to capture digital images of the same DD from different angles. The more precise 3-D structure of DD could be built with the improved measurements.
4 Conclusions and discussions
1. The proportionality coefficient (K) is not available so far for desert dust devils. TheK value we used in our opacity calculations is for white plume (light scatter-ing plume) whose optical properties are definitely dif-ferent form DD (desert dust particles). The value ofK for desert dust is identified as an urgent need for our future study.
2. A scaling model of DD size is required if there are no references for DD scale.
3. The results documented in this study are far from gener-alized characteristics of DD opacity. In order to realize statistical analysis of large sized samples, more observa-tions – including carefully designed specific field cam-paigns – are needed for characterizing DD opacities. 4. The validation of calculated opacities inside the DD
col-umn is also a challenge. It is essential to collect other independent observation data of DD for this purpose. In this study, the lines are chosen to follow a conical pat-tern rather than a regular grid, just for the simple characteri-zation of the optical structure of DDs. The method to quan-tify spatial distribution of opacity is able to present the simi-lar spatial variability like grid boxes defined in DD numerical models to simulate spatial distribution of physical properties (Mason et al., 2013; Gu et al., 2006). In the further study, we could use the regular grids for a better comparison between differently shaped dust devils, in particular for dust devils that are not well-structured and might deviate substantially from an ideal conical shape.
A new method to convert 2-D structure of opacity using multiple-camera digital optical method (MDOM) to 3-D will be developed for the better estimation of vertical gradient of dust concentrations. In addition, the wind shear and Reynolds stress will be considered in the improved system in order to realize the parameterization of vertical dust flux caused by DDs.
The opacity of dust devils may also be affected by me-teorology like ambient wind and temperature difference be-tween surface and air (Liu et al., 2016), which could influ-ence the structures of dust devils. High-strength dust devils can roll up more dust particles, affecting the opacity of dust
Competing interests. The authors declare that they have no conflict
of interest.
Acknowledgements. This research was supported by the National Natural Science Foundation of China (41375158; 41175093; 41405013) and the Research Starting Project of NUIST (20110304) of China. Any opinions, findings, and conclusions or recom-mendations expressed in this paper are those of the authors and do not necessarily reflect the view of the Nanjing University of Information Science and Technology, University of Illinois at Urban and Champaign, or any organization and government agency.
Edited by: A. Kokhanovsky
Reviewed by: four anonymous referees
References
American Society of Testing Materials: Standard Test Method for Determining the Opacity of a Plume in the Outdoor Ambient Atmosphere (ASTM D-7520), available at: http://www.astm.org/ Standards/D7520.htm (last access: 12 October 2014), 2013. Balme, M. and Greeley, R.: Dust devils on Earth and Mars, Rev.
Geophys., 44, RG3003, doi:10.1029/2005RG000188, 2006. Bluestein, H. B., Weiss, C. C., and Pazmany, A. L.:
Doppler radar observations of dust devils in Texas, Mon. Weather Rev., 132, 209–224, doi:10.1175/1520-0493(2004)132<0209:DROODD>2.0.CO;2, 2004.
Deng, Z. Q., Han, Y. X., Bai, Z. H., and Zhao, T. L.: Relation-ship between dust aerosol and solar radiation in gebi desert in North China, China Environment Science, 31, 1761–1767, 2011 (in Chinese).
Du, K., Rood, M. J., Kim, B. J., Kemme, M. R., Franek, B., and Mattison, K.: Quantification of plume opacity by digital photography, Environ. Sci. Technol., 41, 928–935, doi:10.1021/es061277n, 2007.
Du, K., Shi, P., Rood, M. J., Wang, K., Wang, Y., and Varma, R. M.: Digital Optical Method to quantify the vi-sual opacity of fugitive plumes, Atmos. Environ., 77, 983–989, doi:10.1016/j.atmosenv.2013.06.017, 2013.
Fiedler, B. H. and Kanak, K. M.: Rayleigh–Bénard convection as a tool for studying dust devils, Atmos. Sci. Lett., 2, 104–113, doi:10.1006/asle.2001.0046, 2001.
Gierasch, P. J.: Martian dust storms, Rev. Geophys., 12, 730–734, doi:10.1029/RG012i004p00730, 1974.
Gierasch, P. J. and Goody, R.: A model of a Martian great dust storm, J. Atmos. Sci., 30, 169–179, doi:10.1175/1520-0469(1973)030<0169:AMOAMG>2.0.CO;2, 1973.
Gillette, D. A. and Sinclair, P. C.: Estimation of suspension of alka-line material by dust devils in the United States, Atmos. Environ., 24, 1135–1142, doi:10.1016/0960-1686(90)90078-2, 1990. Greeley, R., Balme, M. R., Iversen, J. D., Metzger, S.,
Mickel-son, R., Phoreman, J., and White, B.: Martiandust devils: labora-tory simulations of particle threshold, Geophys. Res. 108, 5041, doi:10.1029/2002JE001987, 2003.
Gu, Z., Zhao, Y., Yu, Y., and Feng, X.: Numerical study of the for-mation evolution and structure of dust devil, Acta Meteorol. Sin., 61, 751–760, 2003 (in Chinese).
Gu, Z., Zhao, Y., Li, Y., Yu, Y., and Feng, X.: Numerical simulation of dust lifting within dust devils-simulation of an intense vortex, J. Atmos. Sci., 63, 2630–2641, doi:10.1175/JAS3748.1, 2006. Gu, Z., Qiu, J., Zhao, Y., and Hou, X.: Analysis on dust devil
con-taining loess dusts of different sizes, Aerosol Air Qual. Res., 8, 65–77, doi:10.4209/aaqr.2007.03.0026, 2008.
Gu, Z. L., Qiu, J., Lu, L. Y., and Zhao, Y. Z.: Advances in Study of Dust Devils, Journal of Desert Research, 27, 843–850, 2007 (in Chinese).
Gu, Z. L., Wei, W., and Zhao, Y. Z.: An overview of surface condi-tions in numerical simulacondi-tions of dust devils and the consequent near-surface air flow fields, Aerosol Air Qual. Res., 10, 272–281, doi:10.4209/aaqr.2009.12.0077, 2010.
Han, Y., Dai, X., Fang, X., Chen, Y., and Kang, F.: Dust aerosols: a possible accelerant for an increasingly arid cli-mate in North China, J. Arid Environ., 72, 1476–1489, doi:10.1016/j.jaridenv.2008.02.017, 2008.
Ito, J., Tanaka, R., and Niino, H.: Large eddy simulation of dust devils in a diurnally-evolving convective mixed layer, J. Meteo-rol. Soc. Jpn., 88, 63–77, doi:10.2151/jmsj.2010-105, 2010. Ives, R. L.: Behavior of dust devils, B. Am. Meteorol. Soc., 28,
168–174, 1947.
Jemmett-Smith, B. C., Marsham, J. H., Knippertz, P., and Gilke-son, C. A.: Quantifying global dust devil occurrence from meteorological analyses, Geophys. Res. Lett., 42, 1275–1282, doi:10.1002/2015GL063078, 2015.
Kanak, K. M.: Numerical simulation of dust devil-scale vortices, Q. J. Roy. Meteorol. Soc., 131, 1271–1292, doi:10.1256/qj.03.172, 2005.
Kanak, K. M.: On the numerical simulation of dust devil–like vortices in terrestrial and Martian convective boundary layers, Geophys. Res. Lett., 33, L19S05, doi:10.1029/2006GL026207, 2006.
Kanak, K. M., Lilly, D. K., and Snow, J. T.: The formation of verti-cal vortices in the convective boundary layer, Q. J. Roy. Meteor. Soc., 126, 2789–2810, doi:10.1002/qj.49712656910, 2000. Klose, M. and Shao, Y. P.: A numerical study on dust devils with
implications to global dust budget estimates, Aeolian Research, 22, 47–58, doi:10.1016/j.aeolia.2016.05.003, 2016.
Koch, J. and Renno, N. O.: The role of convective plumes and vortices on the global aerosol budget, Geophys. Res. Lett., 32, L18806, doi:10.1029/2005GL023420, 2005.
Leovy, C. B.: Mars: The devil is in the dust, Nature, 424, 1008– 1009, doi:10.1038/4241008a, 2003.
Liu, C., Zhao, T., Yang, X., Liu, F., Han, Y., Luan, Z., He, Q., Rood, M., and Yuen, W.: Observational study of formationmechanism, vertical structure, anddust emission of dust devils over the Takli-makan Desert, China, J. Geophys. Res.-Atmos., 121, 3608–3618, doi:10.1002/2015JD024256, 2016.
Lorenz, R. D.: Observing desert dust devils with a pressure logger, Geosci. Instrum. Method. Data Syst., 1, 209–220, doi:10.5194/gi-1-209-2012, 2012.
Lorenz, R. D.: Irregular dust devil pressure drops on Earth and Mars: Effect of cycloidal tracks, Planet. Space Sci., 76, 96–103, doi:10.1016/j.pss.2013.01.001, 2013.
Lorenz, R. D., Balme, M. R., Gu, Z. L., Kahanpaa, H., Klose, M., Kurgansky, M., Patel, M. R., Reiss, D., Rossi, A. P., Spiga, A., Takemi, T., and Wei, W.: History and Applications of Dust Devil Studies, Space Sci. Rev., 203, 5–37, doi:10.1007/s11214-016-0239-2, 2016.
Mason, J. P., Patel, M. R., and Lewis, S. R.: Radia-tive transfer modelling of dust devils, Icarus, 223, 1–10, doi:10.1016/j.icarus.2012.11.018, 2013.
Metzger, S. M., Carr, J. R., Johnson, J. R., Parker,T. J., and Lemmon, M. T.: Dust devil vortices seen by the Mars Pathfinder camera, Geophys. Res. Lett., 26, 2781–2784, doi:10.1029/1999GL008341, 1999.
Metzger S. M., Balme, M. R., Towner, M. C., Bos, B. J., Ringrose, T. J., and Patel, M. R.: In situ measurements of par-ticleload and transport in dust devils, Icarus, 214, 766–772, doi:10.1016/j.icarus.2011.03.013, 2011.
Neakrase, L. D. V., Balme, M. R., Esposito, F., Kelling, T., Klose, M., Kok, J. F., Marticorena, B., Merrison, J., Patel, M., and Wurm, G.: Particle Lifting Processes in Dust Devils, Space Sci. Rev., 203, 347–376, doi:10.1007/s11214-016-0296-6, 2016. Sinclair, P. C.: Some preliminary dust devil measurements,
Mon. Weather Rev., 92, 363–367, doi:10.1175/1520-0493(1964)092<0363:SPDDM>2.3.CO;2, 1964.