MARCOS RITEL FRANCO JÚNIOR
THE NOT SO GENERALIZED EFFECTS OF NONRECIPROCAL
TRADE AGREEMENTS
MARCOS RITEL FRANCO JÚNIOR
THE NOT SO GENERALIZED EFFECTS OF NONRECIPROCAL
TRADE AGREEMENTS
Dissertação apresentada à Escola de Economia de São Paulo da Fundação Getulio Vargas como requisito para obtenção do título de Mestre em Econo-mia
Campo de Conhecimento: Comércio Intenacional
Orientador: Prof. PhD. Emanuel Ornelas
The not so generalized effects of nonreciprocal trade agreements / Marcos Ritel Franco Junior. - 2016.
34 f.
Orientador: Emanuel Ornelas
Dissertação (mestrado) - Escola de Economia de São Paulo.
1. Política comercial. 2. Tratados comerciais. 3. Comércio internacional. 4. Exportação. 5. Análise de painel. I. Ornelas, Emanuel. II. Dissertação
(mestrado) - Escola de Economia de São Paulo. III. Título.
MARCOS RITEL FRANCO JÚNIOR
THE NOT SO GENERALIZED EFFECTS OF NONRECIPROCAL
TRADE AGREEMENTS
Dissertação apresentada à Escola de Economia de São Paulo da Fundação Getulio Vargas como requisito para obtenção do título de Mestre em Econo-mia
Campo de Conhecimento: Macroeconomia
Orientador: Prof. PhD. Emanuel Ornelas
Data de Aprovação:
/ /
Banca examinadora:
Prof. PhD. Emanuel Ornelas (Orientador) FGV-EESP
Prof. PhD. João Paulo Pessoa FGV-EESP
À minha família pelo esteio.
Ao Emanuel Ornelas pelo exemplo e pela orientação diligente.
RESUMO
Esta dissertação estuda a relação entre acordos comerciais não recíprocos e fluxos de comércio entre seus membros. Com o auxílio de equações de gravidade e uma base de dados bastante ex-tensa, estimam-se regressões que permitem observar o impacto de variáveis de política comercial em fluxos bilaterais de comércio. Os resultados mostram que, em média, o impacto comercial de acordos não recíprocos é bastante modesto e se dá em apenas uma situação: quando exportadores estão excluídos do sistema multilateral de comércio. Esse quadro se mantém quando exportadores são alguns dos "Least Developed Countries" definidos pela Organização das Nações Únidas. Nesse caso, entretanto, o impacto positivo do acordo é maior. Os resultados também sugerem a existência de forte endogeneidade na formação de acordos não recíprocos, uma vez que um aumento nos fluxos comerciais já é observável 10 anos antes da sua criação. Além disso, estimações indicam que incerteza e arbítrio são pontos fundamentais que atrapalham o seu desempenho. Por outro lado, acordos recíprocos de comércio apresentam efeitos positivos e bastante fortes independente do nível de riqueza de seus membros. Encorajar o envolvimento de países em desenvovimento em liberalizações recíprocas surge então como uma possível recomendação de política.
This dissertation uses an empirical gravity equation approach to study the relationship between nonreciprocal trade agreements (NRTAs) and members’ trade flows. Estimations relate bilateral imports to trade policy variables using a very comprehensive dataset with over fifty years of data. Results show that meager average trade effects exist only if members are excluded from the world trading system or if they are very poor. As trade flows between NRTA members are already rising before their creation, results also suggest a strong endogeneity concerning their formation. More-over, estimations show that uncertainty and discretion tend to critically hinder NRTA’s performance. On the other hand, reciprocal trade agreements show the opposite pattern regardless of members’ income status.Encouraging developing countries’ openness to trade through reciprocal liberaliza-tion emerges consequently as a possible policy implicaliberaliza-tion.
Contents
Introduction . . . . 9
Related Literature . . . . 11
Data . . . . 13
Empirical Strategy . . . . 16
Results . . . . 19
Concluding Remarks . . . . 28
References . . . . 29
1 Introduction
When countries sign trade agreements, they expect them to foster trade among partners as they reduce trade barriers and turn transactions easier and cheaper. The recent surge in their number indicates that policy makers seem to be more enthusiastic about them than ever before. However, maybe this enthusiasm may not be entirely justified for a very popular kind of trade agreement: nonreciprocal ones. They differ from other arrangements by the role played by their signatories - often a rich WTO 1 member extends trade benefits to developing countries without demanding similar liberalization in return. The alleged intent is to show some benevolence and to aim at overcoming underdevelopment in poor nations. Benefits include lower tariffs and enjoying them can require at most some commitment to human rights or good governance issues.
In this paper, using a standard gravity equation framework, I show that, despite their general aim, nonreciprocal trade agreements (NRTAs) boost trade only in one specific situation. It arises when the beneficiary exporter is not inside the multilateral trading system. In this case, NRTAs increase trade as much as a WTO membership would. This fact remains true if we focus at Least Developed Countries (LDCs) as well.2 Most NRTAs include a more comprehensive LDC sub-scheme with lower tariffs, often duty-free, covering a wider set of products. For them, NRTAs also do the same job as a WTO membership, even though trade effects are more substantial in this case. Those findings best describe NRTAs not as a trade policy helping all developing nations through generous trade preferences, but one that integrates outsiders to the world trading system offering them benefits equal to a WTO membership.
Evidence displays another two key points in understanding the formation and the structure of NRTAs. First, if we look a decade before their creation, trade was already on the rise. Effects can hence hardly come from a causal relationship, and this portrays NRTAs as a natural product of a previous surge in trade between eligible countries. Second, their design matters. NRTAs rules are not clear, and not seldom beneficiaries have their preferences interrupted for some period at donor’s will. Results show that only perennial NRTAs, without any interruption, are capable of increasing trade.
One could still argue that NRTAs effects are not very likely to be homogeneous through time. In-deed, they became much more popular in recent decades than they were first they officially appeared in 1971/72. At that moment, as a notable exception to GATT’s two main rules of non-discrimination
1 The WTO is a rather new institution that appeared in 1995 after the end of the Uruguay Round. It replaced the multilateral General Agreement on Tariffs and Trade (GATT) signed in 1947. Throughout this paper I shall use mainly WTO to refer to both institutions notwithstanding.
2 It is a list of very poor nations created by the United Nations using criteria as social development and economic
1 Introduction 10
and reciprocity, members allowed nonreciprocal liberalization through the Generalized System of Preferences (GSP) program.3 Nowadays, not only all industrialized nations have some GSP scheme, but also some developing ones are beginning to open their markets to poor countries, especially LDCs, in a total of 27 nonreciprocal agreements in 2014.
Still, despite this recent surge, results display that they were much more efficient in the past - NRTAs increased trade for non-WTO members in the 70’s, 80’s and 90’s, but no effect at all exists between 2000 and 2014, except for LDCs. This fact could be due to not only the massive membership of developing nations in the WTO in the 90’s but also the simultaneous rise in the number of reciprocal trade agreements (which henceforth I’ll call preferential trade agreements (PTAs)). In fact, PTAs have the very opposite pattern of NRTAs: they perform poorly before the 90’s, when they were scarce, but are very effective from then on.
Maybe PTAs are a more adequate trade policy alternative for developing nations. In fact, the average trade effect of PTAs is much more expressive than other trade arrangements. The secret may lie in their rules and design, which in general promote deeper integration than NRTAs, as they demand stronger commitments than nonreciprocal liberalization. It remains true regardless of members’ wealth and to see it one can split PTAs concerning their notification status to the WTO. If a PTA has one industrialized member, it must be notified under Article XXIV of the GATT, and it will demand the substantial elimination of all trade barriers. Alternatively, if members are only developing nations, it can be notified through the Enabling Clause, which allows discretion on liberalized sectors. Evidence shows that both kinds promote trade wholly, but surprisingly those notified under the Enabling Clause show the strongest effects. It suggests that any reciprocal liberalization is good when it comes to economies that are naturally more closed, as liberalization was not historically demanded from them.
Those findings throw some light in a literature puzzle that emerged from many papers trying to question whether NRTAs had some impact on trade, but brought conflicting and intriguing results. The aim here is not only to provide an answer to this question by investigating a possible change in trade during NRTAs’ time span but also qualify it by searching multiple avenues through which they could affect trade or be affected by it, as well as provide some alternative by looking closely at PTAs.
3 See Ornelas (2016) for a more accurate discussion of the Generalized System of Preferences’ history and institutional
2 Related Literature
This paper builds on a broad literature that estimates ex-post trade effects of trade agreements on aggregate bilateral imports using a gravity equation. Even though there are only a few papers whose primary concern are NRTAs, the literature that estimates trade effects of WTO membership always brought in its econometric models some controls for GSP status. Hence, we can see it as subliterature that attempts to access the impact of nonreciprocal trade agreements on members’ exports. Results are controversial and even opposing depending on the empirical specification.
The first one to do so was Rose (2004). Using more than 200,000 observations of yearly commercial data, he estimates a very standard OLS gravity equation relating average bilateral trade between country pairs to trade policy variables and a vector of controls. He concludes that GSP increases bilateral trade by 100%, but subsequent papers questioned his methodology. Subramanian and Wei (2007) substitute the average bilateral trade by unilateral imports as suggested by theoretical models that underlie a gravity-like specification. They also control for the multilateral resistance term as proposed by Anderson and Van Wincoop (2003) and change the coding convention of the trade policy variables for a more proper one, which I’ll discuss later. One drawback is the reduced number of observations in their dataset, 55,831, because it contains information only at five-year intervals, from 1950 to 2000, and no observations with import values of less than $500,000.4
On the other hand, Eicher and Henn (2011) use a more precise version of the gravity equation that controls existent time invariant bilateral heterogeneity among country-pairs, but their dataset is the same as Subramanian and Wei’s. They control for a greater number of PTAs, in an attempt to reduce omitted variable bias and find that GSP trade effects are negative and significant. Liu (2009) uses a more comprehensive dataset, with more than one million observations, but does not include the time-varying country fixed effects or the country-pair fixed effects.
More recently, Gil Pareja et al. (2014) investigate specifically aggregate and individual effects of NRTAs, but bypass much of the advances in the literature. Their dataset brings exports as the dependent variable instead of a more trustful information of imports. Also, they disregard Subramanian and Wei’s (2007) coding convention of the trade policy dummies and do not discuss their choice. With a dataset containing four-year gaps and 134,000 observations, from 1960 to 2008, their joint NRTA dummy present positive and very significant trade effects.
In addition there is a literature that looks at some specific nonreciprocal trade agreements and tries to estimate their effects using disaggregated bilateral trade data. Shushanik (2013) looks at the
2 Related Literature 12
3 Data
The main dataset is constituted of an unbalanced panel with 1,266,511 observations in which the main trade variable is annual bilateral aggregate imports taken from the IMF Directions of Trade Statistics. There are 55 years of information, from 1960 to 2014, and data comprises 191 importers and 219 exporters5 in a total of 18,791 country pairs. Zero trade flows represent 41% of data, and real imports are obtained deflating trade by the U.S. consumer price index.
Three trade policy variables describe WTO, PTA and NRTA memberships. Data for WTO membership until 2006 comes from CEPII and from 2007 until 2014 comes from the WTO website. A very complete and precise data on preferential trade agreements is taken from de Sousa (2012) which is available on his website.6 Finally, data on NRTA membership until 2003 is taken from Liu (2009) and is also available on his website.7 From 2004 onwards this data comes from UNCTAD’s publication “Generalized System of Preferences - List of Beneficiaries" available for 2005, 2006, 2009, 2011 and 2015. For the rest of the years, it comes from a projection based on those with available data.8 Along the dataset there’s information on the following countries’ Generalized System of Preferences: Australia, Belarus, Bulgaria, Canada, European Union, Iceland, Japan, Kazakhstan, New Zealand, Norway, Russia, Switzerland, Turkey, USA, USSR.9
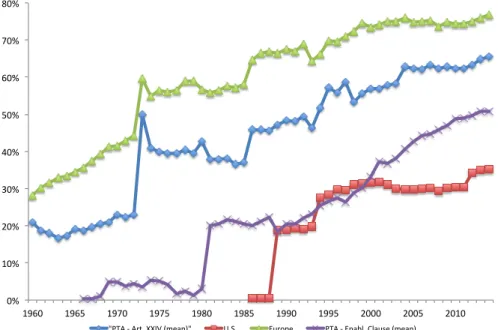
Figures 1 and 2 describe the main variable on the dataset. Figure 1 displays the (mean) share of imports coming from NRTA beneficiaries when the importer is either the world, the United States or the European Union. A pattern emerges in which the share of imports from NRTA beneficiaries suffered a decline throughout the years, showed some reaction at the end of the 1990’s but began to fall again recently. Overall it is an erratic behavior across decades. There are two symbolic sudden falls in the figure that bring attention to recent trends. First, the mean share of U.S. imports from NRTA members falls from 33% in 1992 to 13% in 1993. It is a result of the signature of the North American Free Trade Agreement (NAFTA) which made Mexico, America’s third top import partner in that year, no longer a GSP beneficiary. Second, the mean share of EU’s imports from NRTA beneficiaries fell from 21% to 10% in the passage of 2013 to 2014. This is due to a recent reform of their GSP system that reduced substantially the number of beneficiaries. According to the EU’s GSP website, “reducing GSP to fewer beneficiaries reduces competitive pressure and makes
5 Countries and territories.
6 http://jdesousa.univ.free.fr/data.htm
7 http://ksuweb.kennesaw.edu/ xliu6/
8 For 2004, data comes from 2003; for 2007, from 2006; for 2008 and 2010, from 2009; for 2012 and 2013, from 2011; for 2014, from 2015. Liu does the same projection with his database - he has exact information for the following years: 1973, 1976, 1977, 1979, 1984, 2001. The appendix brings the estimation of the benchmark regression discussed below using only years with precise NRTA information. Main result remains unchanged.
3 Data 14
the preferences for LDCs more meaningful".10
Figure 1 – Mean share of imports from NRTAs beneficaries, by importer
8% 15% 22% 29% 36%
1972 1977 1982 1987 1992 1997 2002 2007 2012 World (mean) U.S. Europe
Figure 2 brings the mean share of imports originating from PTA partners. It has information when the importer is the United States, the European Union, and the world, with the latter split between PTAs notified under Article XXIV or Enabling Clause. A very clear pattern emerges. PTAs on average grow more and more in importance inside countries’ bilateral commercial transactions. It is not only true for developed nations, but also for developing ones - PTAs notified under the Enabling Clause show an even steeper time trend.
There’s also a second database that brings disaggregated trade data at the industry level. It contains 398,521 observations taken from the Comtrade. Importers are countries that extend trade benefits through NRTAs plus the European Union. Exporters are all states and territories - there are 15 importers and 257 exporters. There is data for each five years, from 1965 until 2010, and industries are classified according to the SITC Rev.3 classification. I construct three industry indicator variables: Primary Products, Textiles Clothing and Non-Primary Products.11 Underlying the creation of these variables is the wish to test eventual asymmetries on how preferences impact exports across different industries.
Figure 3 describes the mean share of world product imports from NRTA beneficiaries relative to total NRTA trade for each of the three industries - Primary Products, Textiles Clothing and Non-Primary Products. It is quite clear that non-primary products occupy the larger part of the share and that all shares have remained more or less stable across years.
http://ec.europa.eu/trade/policy/countries-and-regions/development/generalised-scheme-of-Figure 2 – Mean of log of bilateral imports - NRTA members
0% 10% 20% 30% 40% 50% 60% 70% 80%
1960 1965 1970 1975 1980 1985 1990 1995 2000 2005 2010
"PTA - Art. XXIV (mean)" U.S. Europe PTA - Enabl. Clause (mean)
Figure 3 – Mean share of world product imports inside NRTAs
0% 10% 20% 30% 40% 50% 60% 70% 80%
1970 1975 1980 1985 1990 1995 2000 2005 2010
Primary Products Tex<le & Clothing Non=Primary Products
preferences/indexen.htm
16
Empirical Strategy
Letmbe the importer,xthe exporter andtthe year. The empirical strategy uses a structural gravity
equation following the suggestion of Head and Mayer (2014). It relates total imports thatmmade
from x at t to multiple trade policy variables and theory-suggested gravity controls. Following
Subramanian and Wei (2007), there are three hierarchical mutually exclusive dummies for PTA, NRTA, and WTO membership. They allow for the isolation of the effect of each agreement without confounding it when country pairs are members of more than one of them. The basic assumption is that, as PTAs promote the greatest reduction in trade costs and hence deeper integration between markets, it turns any membership in an NRTA or the WTO redundant with respect to bilateral trade effects. Likewise, the same hierarchical rationale is valid for NRTAs and the WTO: if a country pair is part of an NRTA and the WTO, the first makes the second less important as it allows for better and deeper preferences. All in all,PT Amxt is 1 ifmandxare together in the same PTA att,
and is 0 otherwise;NRT Amxt equals 1 ifmextends trade benefits toxthrough an NRTA attand it
is 0 otherwise or ifPT Amxt =1; finally,W T Omxt is 1 ifmandxare both WTO members attand it
is 0 if not, or ifPT Amxt =1orNRT Amxt =1.
TheNRT Amxt variable has information on GSP programs from many nations, but those are not
the only current nonreciprocal trade agreements. In fact, many countries offering GSP preferences have a sub-scheme in which better ones are offered, usually to LDCs. Those sub-schemes include, for example, the African Growth Opportunity Act from the United States and the Everything but Arms and GSP+ from the European Union. As every beneficiary of a sub-scheme is also a GSP beneficiary, it is possible to estimate their aggregate effect indirectly, interacting the NRT Amxt
dummy with an indicator variable for LDC exporters.
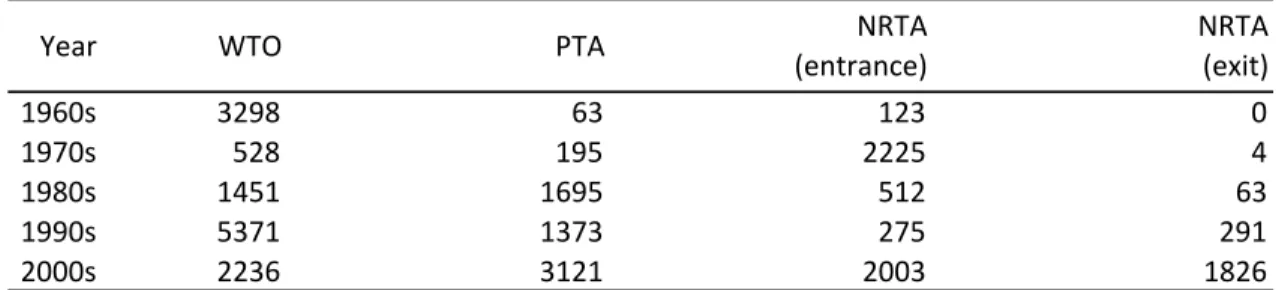
Table 1 describes changes in trade agreements status for the trade policy variables across country pairs in the dataset following their description above. For example, if the WTO dummy regarding somem andx is 0 until 1965 and is 1 from this year on, the column WTO and row 1960s count
one change in trade agreement status. For NRTA (exit) it is the inverse rationale but on the NRTA variable. As it is unusual for countries to interrupt either its WTO or PTA membership, there is only information about a variable passing from 1 to 0 when it comes about NRTAs. The existence of variation is crucial to provide power to regressions. Naturally, this change is not uniform throughout time, but one can see that it exists in all time periods12
The empirical model also has importer and exporter time-varying fixed effects. Those can adequately control for the “multilateral resistance term" suggested by Anderson and Van Wincoop
12 In the 1960’s GSP was not yet created, but some countries like Australia already had nonreciprocal schemes that
Table 1: Observations with changes in trade agreements status
1960s 3298 0
1970s 528 4
1980s 1451 63
1990s 5371 291
2000s 2236 1826
Year
195 1695 1373
PTA NRTA
(entrance) WTO 63 123 NRTA (exit) 3121 2225 512 275 2003
(2003) in a panel context, as proposed by Baier and Bergstrand (2007). There are also time-invariant country-pair fixed effects to account for unobserved heterogeneity and minimize the endogeneity of trade agreements, as suggested by Baldwin and Taglioni (2006). Notice that the econometric model does not bring the usual controls prevalent in the gravity literature, like GDP, colonial status or common language. Once I use all fixed effects, it is impossible to estimate them. As they are not of interest, fixed effects are a better choice because they control for all observable and unobservable trade costs in their respective dimensions.
Altogether, the benchmark specification is given by:
ln(Mmxt) =β1W T Omxt+β2PT Amxt+β3NRT Amxt
+β4ComCurrmxt+αmt+γxt+ξmx+εmxt
(1)
whereln(Mmxt) is the log of imports, F T Amxt, NRT Amxt, W T Omxt are the trade policy dummies
discussed above; ComCurrmxt is 1 if m and x are in the same currency union; αmt and γxt are
importer and exporter time-varying fixed effects, respectively;ξmx is the country pair fixed effect
andεmxt is an error term.
Industry-level estimation follows a similar structure of the baseline specification and the trade policy variables are all the same. The dependent variable is the log of imports disaggregated at the two-digit industry level. Although preferences are not extended to exports of all industries or products, it certainly has some impact on the overall economy. Hence, estimations can identify different effects of preferences throughout the various sectors.
Letmbe the importer,xthe exporter,ithe industry andtthe year. For this dataset, specification
is given by:
ln(Mmxit) =β1W T Omxt+β2PT Amxt+β3NRT Amxt∗PrimProdmxit
+β4NRT Amxt∗Text&Clothmxit+β5NRT Amxt∗NonPrimProdmxit
+β6ComCurrmxt+αmt+γxt+ξmx+δi+εmxit
Empirical Strategy 18
whereln(Mmxit) is the log of bilateral imports inside industry i; F T Amxt, NRT Amxt, W T Omxt are
the trade policy dummies;PrimProdmxit indicates thatmis importing primary products from xat
t;Text&Clothmxit andNonPrimProdmxit are analogous indicator variables for textiles and clothing
and non-primary products;ComCurrmxt is 1 ifmandxare in the same currency union;mt andxt are
importer and exporter time-varying fixed effects, respectively;mxis the country-pair fixed effect;i
are industry fixed effects andmxit is an error term.
I use the methodology developed by Guimaraes and Portugal (2010) to estimate the gravity equation with high dimension fixed effects with Ordinary Least Squares (OLS). In the end, the sample size used in regressions will decrease due either to the existence of zero trade flows, which cannot be estimated in a log-linear model or due to the existence of multiple fixed effects.
4 Results
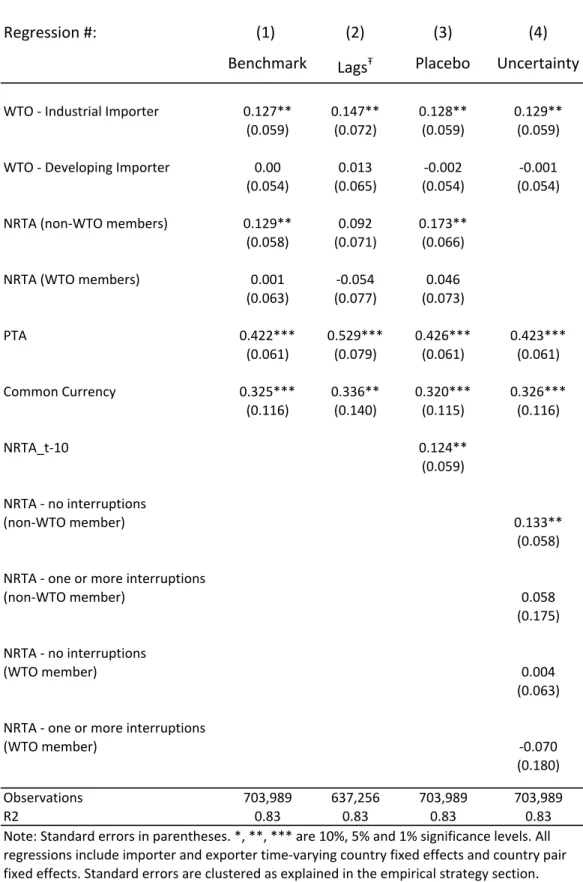
Table 2 brings the core results from the OLS regression analysis of the impact of NRTAs on country-pairs trade flows controlling for WTO and PTA membership and the large set of fixed effects discussed above. The WTO dummy variable comes in two versions according to importer’s level of income - there’s a dummy when the importer is an industrial country and another one when it is a developing one.13 This division responds to a historically different behavior of WTO members, as noted by Subramanian and Wei (2007): since their entry into the institution, developed members have liberalized their markets with much more enthusiasm than poor ones. Besides that, this division allows a much more precise calculation of the net effect of NRTA membership for WTO and non-WTO members. Even though there is the hierarchical assumption about the trade policy dummies, the NRTA effect contains the WTO effect as the WTO dummy is zero when country pairs belong both to an NRTA and the WTO. Hence, to obtain the impact of NRTAs for WTO members, I subtract the NRTA estimate from the WTO-industrial estimate as they are mainly the ones conceding trade benefits through this kind of agreement.14
Regression 1 displays the benchmark result. First, NRTAs demonstrate positive effects only when country pairs are not both WTO members. They increase trade by 14%(=e0.129−1)with a
statistical significance of 5%. When it comes to non-members both the magnitude of the coefficient and the statistical significance vanish. Splitting the WTO dummy seems to make sense as there’s also a positive trade effect of 14%(=e0.103
−1)when importers are industrialized, and it is significant at
5%. When both countries are developing economies, WTO effect is zero. Furthermore, PTAs and Common Currencies’ display coefficients with a large magnitude that are statistically significant at 1% - Common Currencies boost trade by 38%(=e0.325−1), while PTAs, by 52%(=e0.422−1).
The magnitude of the contemporaneous PTA trade effect is similar to that estimated by Baier and Bergstand (2007) who use a similar approach to this paper and obtain a trade effect of 58%. This pattern remains stable across the regressions.
13 The WTO does not have an official list of industrial and developing countries and some of them which you would
consider today a rich one, like South Korea, actually does not have this status inside the institution. A list of developed and developing countries I used to form both dummies is available on the appendix.
14 I do so using the Stata lincom command. Appendix brings results for the benchmark specification when trade
4 Results 20
Table 2: Main Results
Dependent Variable: log of real bilateral imports
Regression #: (1) (2) (3) (4)
Benchmark LagsŦ Placebo Uncertainty
WTO - Industrial Importer 0.127** 0.147** 0.128** 0.129**
(0.059) (0.072) (0.059) (0.059)
WTO - Developing Importer 0.00 0.013 -0.002 -0.001
(0.054) (0.065) (0.054) (0.054)
NRTA (non-WTO members) 0.129** 0.092 0.173**
(0.058) (0.071) (0.066)
NRTA (WTO members) 0.001 -0.054 0.046
(0.063) (0.077) (0.073)
PTA 0.422*** 0.529*** 0.426*** 0.423***
(0.061) (0.079) (0.061) (0.061)
Common Currency 0.325*** 0.336** 0.320*** 0.326***
(0.116) (0.140) (0.115) (0.116)
NRTA_t-10 0.124**
(0.059)
NRTA - no interruptions
(non-WTO member) 0.133**
(0.058)
NRTA - one or more interruptions
(non-WTO member) 0.058
(0.175)
NRTA - no interruptions
(WTO member) 0.004
(0.063)
NRTA - one or more interruptions
(WTO member) -0.070
(0.180)
Observations 703,989 637,256 703,989 703,989
R2 0.83 0.83 0.83 0.83
Regression 2 investigates if there are any lagged effects concerning NRTAs that are hidden in the previous regression. It estimates lagged variables for each of the trade policy alternatives for five years. For example, for the WTO there is a variable that is 1 if int 1 mandxwere both WTO
members; there is another one that is 1 if int2 mandxwere WTO members and so on. Reported
results are the sum of each of those five estimates by trade policy variable. As you can see, the only effect that grows in magnitude is the PTA effect. NRTA effect vanishes and the WTO effect for industrial importers remains stable.
Regression 3 shows that one can hardly argue that the effect of NRTAs for WTO non-members is a causal one. It investigates a possible endogeneity of estimates with a placebo dummy,NRT At10,
that is 1 all ten years before an NRTA starts for some country pair. Estimates suggests the existence of a strong endogeneity as the placebo effect is very similar to the NRTA effect for WTO non-members and also the WTO effect for industrialized importers - it has a 13.2% (e0.124
−1) positive trade
effect significant at 5%.15 It suggests that the NRTA and WTO-industrial dummies are influenced by the same natural medium term trend between rich importers and poor exporters and it could explain the lack of trade effect and statistical significance of the NRTA dummy when country pairs are WTO members. Nonetheless, I cannot say that this placebo effect represents the same effect of the NRTA dummy: appendix brings a regression with a placebo dummy that is one not only all ten years before an NRTA starts but also during its lifespan. The estimate shows no detectable trade effect regarding all those years jointly.16
Regression 4 tries to account for uncertainty and lack of consistency of NRTAs. Because NRTAs rules are not so clear, they are much more subject to donor’s choices than agreements like the WTO or PTAs. It is likely that discretion has some impact on NRTAs’ performance: trade preferences that were once suddenly interrupted with no previous warning, for example, must affect future export decisions of beneficiary firms. To investigate this, I assume that interruptions during an NRTA’s lifespan are a signal of uncertainty to recipients, and hence trade effects would be expected to be lower. On the other hand, agreements that are more perennial must resemble PTAs consistency and thus have a bigger probability of showing positive trade effects. Throughout the dataset, NRTAs without interruptions are more prevalent than those with one or more - out of 137,828 observations where NRTA dummy equals one, 133,333 are those with no NRTA interruptions, and 4,495 are those with at least one. Estimates show the expected pattern. For agreements without interruption, trade effect is 14.2%(=e0.133
−1)and significant at 1%. On the other side, estimates for agreements
that have been interrupted more than once show coefficient and statistical significance of zero. It seems that more perennial NRTAs are the ones driving the benchmark result.
15 Results are the same If I use instead a dummy that is 1 all five years before the beginning of an NRTA. The same is not true with a dummy that is 1 all 20 years before NRTAs start.
4 Results 22
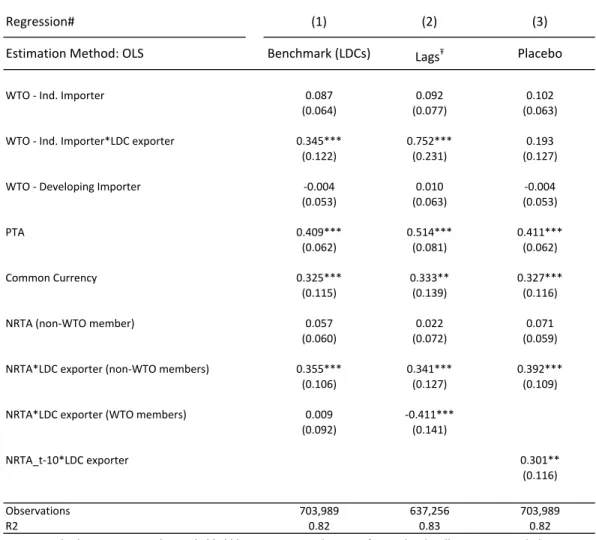
Table 3 investigates the impact of NRTAs when exporters are LDCs with the same regressions as Table2.17 Besides the interaction between the NRTA dummy and the LDC indicator, Regression 1 also has the same interaction with the WTO-industrial variable. LDCs display a greater NRTA trade effect when it comes to non-WTO members, of 42.6% (= e0.355 1) significant at 1%. It is expected since, as discussed before, they usually face better preferences as members of NRTAs. More surprisingly is the identical WTO effect when the importer is an industrial country and exporter, an LDC one. As we are dealing with very poor nations, those huge gains may reflect not only multilateral trade preferences but also the fact that WTO accession requires some degree of economic reforms that helps turn fragile economies into more regular ones. Ultimately, this result certainly adds some strength to the main general result: as with table 2, NRTAs generate no effects for WTO members as its estimate is zero.
Regression 2 investigates the existence of lagged effects for LDCs. Different from table 2, they exist in this case. When WTO members are industrial importers and LDC exporters trade is boosted by 112%(=e0.752
−1), significant at 1%. The NRTA effect for LDCs remains the same
when it comes to non-WTO members, but is negative and very significant for members, declining trade by 33%(=e0.411
−1), although this fall is not sufficient to offset the magnitude of the WTO
effect. Regression 3 estimates the placebo effect for LDCs. Once again coefficient has a larger magnitude than the benchmark one and is very similar to the NRTA estimate - it boosts trade by 35%(=e0.301−1).
Table 4 investigates effects of trade agreements through time interacting each trade policy dummy with an indicator variable for the 1960’s, 1970’s, 1980’s, 1990’s and 2000’s, which goes until 2014 in the dataset. Regression 1 does this for all country pairs and Regression 2, for LDCs. Regression 1 estimates tell a story of the loss of importance of NRTAs throughout decades, the inverse effect for PTAs and an overall lack of significant trade effects for the WTO. First, WTO membership only shows some statistically significant effect for industrialized importers in the 90’s as trade rose by 45%(=e0.374−1) that time, maybe boosted by the massive entry of developing
countries after the Uruguay round. Second, NRTAs seem to have promoted trade, especially in the past. There are statistically significant trade effects in the 1970’s, 1980’s and 1990’s, but in the most recent years, there’s no impact at all. On the other side, PTAs, which were very rare in the past, promote trade very strongly since the 1990’s and their effect in the 2000’s is even bigger, of 39% (=e0.33
−1)and 70%(=e0.533
−1)respectively.
Table 3: Least Developed Countries
Dependent Variable: log of real bilateral imports
Regression# (1) (2) (3)
Estimation Method: OLS Benchmark (LDCs) LagsŦ Placebo
WTO - Ind. Importer 0.087 0.092 0.102
(0.064) (0.077) (0.063)
WTO - Ind. Importer*LDC exporter 0.345*** 0.752*** 0.193 (0.122) (0.231) (0.127)
WTO - Developing Importer -0.004 0.010 -0.004
(0.053) (0.063) (0.053)
PTA 0.409*** 0.514*** 0.411***
(0.062) (0.081) (0.062)
Common Currency 0.325*** 0.333** 0.327***
(0.115) (0.139) (0.116)
NRTA (non-WTO member) 0.057 0.022 0.071
(0.060) (0.072) (0.059)
NRTA*LDC exporter (non-WTO members) 0.355*** 0.341*** 0.392*** (0.106) (0.127) (0.109)
NRTA*LDC exporter (WTO members) 0.009 -0.411*** (0.092) (0.141)
NRTA_t-10*LDC exporter 0.301**
(0.116)
Observations 703,989 637,256 703,989
R2 0.82 0.83 0.82
Ŧ: Includes 5 year lags. Reported coefficients are the sum of these five estimates.
Note: Standard errors in parentheses. *, **, *** are 10%, 5% and 1% significance levels. All regressions include importer and exporter time-varying country fixed effects and country pair fixed effects. Standard errors are clustered as explained in the empirical strategy section.
4 Results 24
Table 4: Heterogeneous effects through time
Dependent Variable: log of real bilateral imports
Regression #: (1) (2) Estimation Method: OLS Decades Decades (LDC)
WTO - Industrial Importer (60s) 0.167 WTO - Industrial Importer (60s)*LDC 0.237
(0.130) (0.246)
WTO - Industrial Importer (70s) 0.105 WTO - Industrial Importer (70s)*LDC 0.596***
(0.102) (0.193)
WTO - Industrial Importer (80s) 0.055 WTO - Industrial Importer (80s)*LDC 0.545**
(0.098) (0.217)
WTO - Industrial Importer (90s) 0.374*** WTO - Industrial Importer (90s)*LDC 0.071
(0.097) (0.290)
WTO - Industrial Importer (00s) 0.056 WTO - Industrial Importer (00s)*LDC 0.427***
(0.085) (0.142)
WTO - Developing Importer (60s) -0.218 WTO - Developing Importer (60s) -0.193
(0.137) (0.135)
WTO - Developing Importer (60s) 0.003 WTO - Developing Importer (70s) 0.007
(0.095) (0.094)
WTO - Developing Importer (70s) -0.124* WTO - Developing Importer (80s) -0.141*
(0.074) (0.072)
WTO - Developing Importer (80s) 0.004 WTO - Developing Importer (90s) -0.174***
(0.071) (0.059)
WTO - Developing Importer (00s) 0.116 WTO - Developing Importer (00s) -0.225***
(0.080) (0.061)
NRTA (non-WTO members) (60s) 0.067 NRTA*LDC (non-WTO members) (60s) 0.286
(0.223) (0.279)
NRTA (non-WTO members) (70s) 0.348*** NRTA*LDC (non-WTO members) (70s) 0.309*
(0.125) (0.161)
NRTA (non-WTO members) (80s) 0.201* NRTA*LDC (non-WTO members) (80s) 0.405**
(0.111) (0.157)
NRTA (non-WTO members) (90s) 0.253*** NRTA*LDC (non-WTO members) (90s) 0.398***
(0.081) (0.141)
NRTA (non-WTO members) (00s) 0.075 NRTA*LDC (non-WTO members) (00s) 0.414***
(0.092) (0.145)
PTA (60s) -0.251 PTA*LDC (60s) -0.782
(0.175) (0.551)
PTA (70s) -0.029 PTA*LDC (70s) -0.069
(0.151) (0.344)
PTA (80s) 0.025 PTA*LDC (80s) -0.238
(0.095) (0.322)
PTA (90s) 0.337*** PTA*LDC (90s) -0.097
(0.074) (0.139)
PTA (00s) 0.533*** PTA*LDC (00s) 0.194
(0.082) (0.157)
Observations 703,989 703,989
R2 0.82 0.82
Table 5 uses the disaggregated data and model described before to investigate the impact of NRTA membership in different sectors of the economy. Results show that NRTA membership boosts mainly primary products exports which are the main comparative advantage of beneficiaries. The positive trade effect for primary products is of 84%(=e0.615
−1)significant at 1%. There’s no
trackable effect for textiles and clothing as its estimate is zero. On the other hand, the effect is negative and significant at 1% for non-primary products, reducing trade by 43%(=e0.568
−1). Estimates for
LDCs in regression 2 reproduces almost the same pattern, except non-primary products, in which the fall in trade is much bigger, of 60% significant at 1%. As I am not identifying NRTA preferences at the industry level, these results suggest a rearrangement in the structure of the economy as a consequence of incentives given by those preferences. It is possible that, once members of NRTAs, exporters focus on what they can produce better and be competitive in donors’ markets reducing the weight given to non-primary products.
Table 6 investigates other possibilities of trade policies concerning developing countries besides NRTAs. The econometric specifications check how PTAs behave when members are poor countries. Overall, estimations show that trade effects remain resolute regardless of the status of members. Regressions split PTAs according to their notification status as discussed in the introduction: there’s a dummy for PTAs which are notified under the Enabling Clause and another one for those notified under Article XXIV. Regression 1 shows that both kinds of PTAs promote trade strongly and have a very significant positive effect - of 64%(=e0.5−1)for Enabling Clause and 52% for Article XXIV
(=e0.42
−1).
Regression 2 brings the interaction of the PTA Article XXIV dummy with a variable that indicates that importer is a developing country. It displays that the effect of PTAs is the same in this case. The same goes when both importer and exporter are developing countries as shown in regression 3 - there is nothing special about this case and PTAs work well as aways. Regression 4 tries to see what happens when a currently NRTA beneficiary enters a PTA independently. In fact, there’s no different effect in this case as PTAs work just fine. This is the same case for LDCs - PTAs notified both under the Enabling Clause or Article XXIV show no different effects for those members as shown in regression 5. Finally, regression 6 shows something different. When the PTA Article XXIV dummy interacts with the NRTA dummy, there’s a negative effect of 30% (=e0
.366−1) significant at 1%. The sum of the PTA dummy with this interaction gives the
4 Results 26
Table 5: Disaggregated data by industry
Dependent Variable: log of real bilateral imports
Regression #: (1)
Estimation Method: OLS Industry
WTO - Industrial Importer -0.022 WTO - Industrial Importer -0.000
(0.077) (0.070)
WTO - Developing Importer -0.308*** WTO - Developing Importer -0.304***
(0.092) (0.091)
NRTA (Primary Products ) 0.615*** NRTA (Primary Products) 0.511**
(0.187) (0.197)
NRTA (Textiles & Clothing) 0.197 NRTA (Textiles & Clothing) 0.214
(0.144) (0.147)
NRTA (non-Primary Products) -0.568*** NRTA (non-Primary Products) -0.466**
(0.163) (0.160)
PTA 0.316*** PTA 0.315***
(0.083) (0.085)
NRTA (Primary Products)*LDC 0.349 (0.208)
NRTA (Textiles & Clothing)*LDC -0.412 (0.430)
NRTA (non-Primary Products)*LDC -0.920*** (0.210)
Observations 351,086 351,086
R2 0.46 0.46
(2)
Industry (LDC)
Table 6: Preferential Trade Agreements
Dependent Variable: log of real bilateral imports
Regression #: (1) (2) (3) (4) (5) (6)
Estimation Method: OLS
WTO - Industrial Importer 0.141** 0.127* 0.129** 0.132** 0.142** 0.140**
(0.062) (0.070) (0.064) (0.062) (0.062) (0.062)
WTO - Developing Importer 0.0363 0.0389 0.0373 0.0455 0.0377 0.0366
(0.053) (0.054) (0.053) (0.053) (0.053) (0.053)
NRTA (non-WTO members) 0.142** 0.129** 0.133** 0.0970 0.138** 0.139**
(0.058) (0.062) (0.061) (0.062) (0.059) (0.058)
PTA (Enabling Clause) 0.500*** 0.503*** 0.505*** 0.502*** 0.528*** 0.557***
(0.102) (0.103) (0.102) (0.101) (0.121) (0.112)
PTA (Article XXIV) 0.420*** 0.380*** 0.379*** 0.458*** 0.441*** 0.414***
(0.068) (0.101) (0.082) (0.071) (0.076) (0.069)
Common Currency 0.366*** 0.368*** 0.365*** 0.354*** 0.363*** 0.373***
(0.114) (0.114) (0.114) (0.114) (0.114) (0.114)
PTA Article XXIV*Importer Developing Country 0.055
(0.113)
PTA Article XXIV*Importer and Exporter Developing 0.095
(0.108)
PTA Article XXIV*NRTA Exporter -0.044
(0.077)
PTA Enabling Clause*NRTA Exporter -0.031
(0.076)
PTA Article XXIV*LDC Exporter 0.116
(0.241)
PTA Enabling Clause*LDC Exporter -0.222
(0.166)
PTA Article XXIV*NRTA Members -0.366***
(0.092)
Observations 664187 664187 664187 664187 664187 664187
R2 0.822 0.822 0.822 0.822 0.822 0.822
28
5 Concluding Remarks
In this paper, I estimate and characterize the effect of nonreciprocal trade agreements on bene-ficiaries’ exports providing a set of brand new results. The methodology employed allows the identification of heterogeneous effects across members and results question whether there is a causal effect of NRTAs on trade flows.
Some steps are yet to be concluded. The most obvious one is to test the robustness of results with alternative econometric specifications as the PPML model proposed by Santos and Tenreyro (2006). It could allow for the use of zero trade flows, which constitute a great part of the dataset. Anyway, it is not clear that it is possible to estimate a PPML model with the dimension of fixed effects employed here. One would have to work with a smaller data set and there would be a natural trade-off involved.
References
Anderson, James and Eric van Wincoop. 2003. "Gravity with Gravitas: a solution to the border puzzle."American Economic Review, 93 (1).
Baier, Scott and Jeffrey Bergstrand. 2007. "Do free trade agreements actually increase mem-bers’ international trade?."Journal of International Economics. 71: 72-95.
Baldwin, Richard and Daria Taglioni. (2006). "Gravity for dummies and dummies for gravity equations." Cambridge: National Bureau of Economic Research Working Paper 12516.
Eicher, Theo and Christian Henn. 2011. "In search of WTO trade effects: preferential trade agreements promote trade strongly, but unevenly". Journal of International Economics83(2),
137-153.
Frazer, Garth and Johannes Van Biesebroeck. 2010. "Trade Growth under the African Growth and Opportunity Act."The Review of Economics and Statistics92, 128-144.
Gil Pareja, Salvador, Rafael Llorca-Vivero and José Antonio Martínez-Serrano. 2014. "Do non-reciprocal preferential trade agreements increase beneficiaries’ exports?"Journal of Development Economics107, 291-304
Guimaraes, Paulo and Pedro Portugal. 2010. "A Simple Feasible Alternative Procedure to Es-timate Models with High-Dimensional Fixed Effects."Stata Journal. 10(4), 628-649.
Hakobyan, Shushanyk. 2015. "Export Competitiveness of Developing Countries and US Trade Policy."Canadian Journal of Economics. 48(2).
Head, Keith and Thierry Mayer. 2013. "Gravity equations: workhorse, toolkit and cookbook."
Handbook of International Economics. Vol. 4
Liu, Xuepeng. 2009. "GATT/WTO Promotes Trade Strongly: Sample Selection and Model Specification."Review of International Economics17(3), 429-446
References 30
Rose, Andrew. 2004. "Do We Really Know That the WTO Increases Trade?" American Eco-nomic Review. vol. 94(1), 98-114, 2004.
Santos Silva, J.M.C. and Silvana Tenreyro. 2006. "The log of gravity."Review of Econonomics and Statistics. 88 (4), 641-658.
de Sousa, Jose. 2012. "The currency union effect on trade is decreasing over time."Economics Letters. 117(3), 917-920.
Subramanian, Arvind and Shang Jin Wei. 2007. "The WTO Promotes Trade, Strongly but Unevenly."Journal of International Economics. 72(1), 151-175.
Appendix
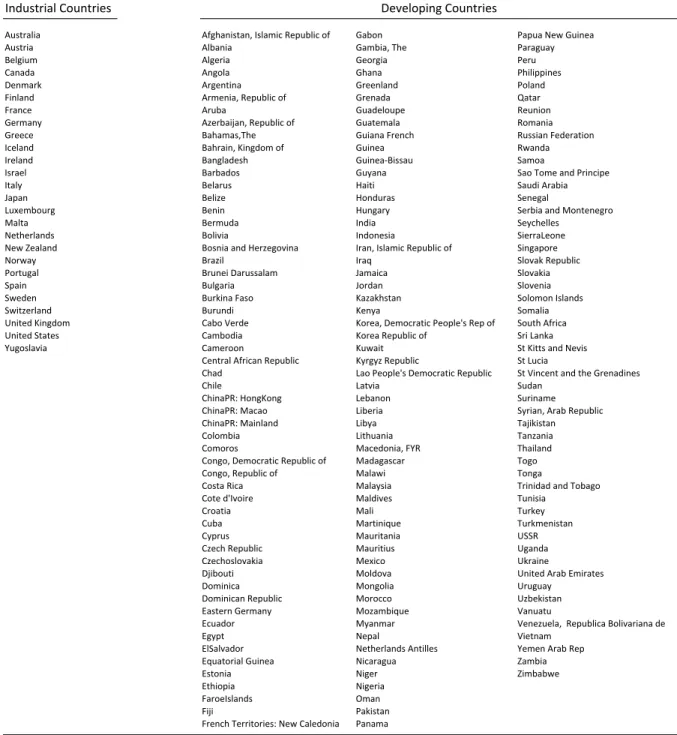
Table A1: Countries Included in Sample
Industrial Countries
Australia Afghanistan, Islamic Republic of Gabon Papua New Guinea
Austria Albania Gambia, The Paraguay
Belgium Algeria Georgia Peru
Canada Angola Ghana Philippines
Denmark Argentina Greenland Poland
Finland Armenia, Republic of Grenada Qatar
France Aruba Guadeloupe Reunion
Germany Azerbaijan, Republic of Guatemala Romania Greece Bahamas,The Guiana French Russian Federation Iceland Bahrain, Kingdom of Guinea Rwanda
Ireland Bangladesh Guinea-Bissau Samoa
Israel Barbados Guyana Sao Tome and Principe
Italy Belarus Haiti Saudi Arabia
Japan Belize Honduras Senegal
Luxembourg Benin Hungary Serbia and Montenegro
Malta Bermuda India Seychelles
Netherlands Bolivia Indonesia SierraLeone New Zealand Bosnia and Herzegovina Iran, Islamic Republic of Singapore
Norway Brazil Iraq Slovak Republic
Portugal Brunei Darussalam Jamaica Slovakia
Spain Bulgaria Jordan Slovenia
Sweden Burkina Faso Kazakhstan Solomon Islands
Switzerland Burundi Kenya Somalia
United Kingdom Cabo Verde Korea, Democratic People's Rep of South Africa United States Cambodia Korea Republic of Sri Lanka Yugoslavia Cameroon Kuwait St Kitts and Nevis
Central African Republic Kyrgyz Republic St Lucia
Chad Lao People's Democratic Republic St Vincent and the Grenadines
Chile Latvia Sudan
ChinaPR: HongKong Lebanon Suriname ChinaPR: Macao Liberia Syrian, Arab Republic ChinaPR: Mainland Libya Tajikistan Colombia Lithuania Tanzania Comoros Macedonia, FYR Thailand Congo, Democratic Republic of Madagascar Togo Congo, Republic of Malawi Tonga
Costa Rica Malaysia Trinidad and Tobago Cote d'Ivoire Maldives Tunisia
Croatia Mali Turkey
Cuba Martinique Turkmenistan
Cyprus Mauritania USSR
Czech Republic Mauritius Uganda Czechoslovakia Mexico Ukraine
Djibouti Moldova United Arab Emirates Dominica Mongolia Uruguay
Dominican Republic Morocco Uzbekistan Eastern Germany Mozambique Vanuatu
Ecuador Myanmar Venezuela, Republica Bolivariana de
Egypt Nepal Vietnam
ElSalvador Netherlands Antilles Yemen Arab Rep Equatorial Guinea Nicaragua Zambia
Estonia Niger Zimbabwe
Ethiopia Nigeria FaroeIslands Oman Fiji Pakistan French Territories: New Caledonia Panama
Appendix 32
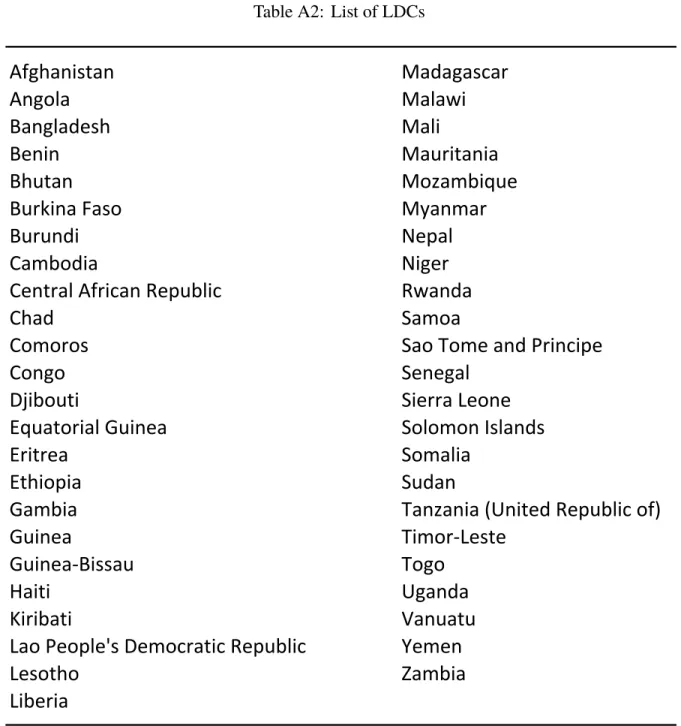
Table A2: List of LDCs
Afghanistan
Madagascar
Angola
Malawi
Bangladesh
Mali
Benin
Mauritania
Bhutan
Mozambique
Burkina Faso
Myanmar
Burundi
Nepal
Cambodia
Niger
Central African Republic
Rwanda
Chad
Samoa
Comoros
Sao Tome and Principe
Congo
Senegal
Djibouti
Sierra Leone
Equatorial Guinea
Solomon Islands
Eritrea
Somalia
Ethiopia
Sudan
Gambia
Tanzania (United Republic of)
Guinea
Timor-Leste
Guinea-Bissau
Togo
Haiti
Uganda
Kiribati
Vanuatu
Lao People's Democratic Republic
Yemen
Lesotho
Zambia
33
Table A3: List of Industries
Primary Products
00 - Live animals other than animals of division 03 51 - Organic chemicals
01 - Meat and meat preparations 52 - Inorganic chemicals
02 - Dairy products and birds' eggs 53 - Dyeing, tanning and colouring materials
03 - Fish (not marine mammals), crustaceans, molluscs and aquatic invertebrates, and preparations thereof 54 - Medicinal and pharmaceutical products
04 - Cereals and cereal preparations 55 - Essential oils and resinoids and perfume materials; toilet, polishing and cleansing preparations
05 - Vegetables and fruit 56 - Fertilizers (other than those of group 272)
06 - Sugars, sugar preparations and honey 57 - Plastics in primary forms
07 - Coffee, tea, cocoa, spices, and manufactures thereof 58 - Plastics in non-primary forms 08 - Feeding stuff for animals (not including unmilled cereals) 59 - Chemical materials and products, n.e.s.
09 - Miscellaneous edible products and preparations 61 - Leather, leather manufactures, n.e.s., and dressed furskins
11 - Beverages 62 - Rubber manufactures, n.e.s.
12 - Tobacco and tobacco manufactures 63 - Cork and wood manufactures (excluding furniture)
21 - Hides, skins and furskins, raw 64 - Paper, paperboard and articles of paper pulp, of paper or of paperboard 22 - Oil-seeds and oleaginous fruits 64 - Paper, paperboard and articles of paper pulp, of paper or of paperboard 23 - Crude rubber (including synthetic and reclaimed) 66 - Non-metallic mineral manufactures, n.e.s.
24 - Cork and wood 67 - Iron and steel
25 - Pulp and waste paper 68 - Non-ferrous metals
27 - Crude fertilizers, other than those of division 56, and crude minerals (excluding coal, petroleum and precious stones) 69 - Manufactures of metals, n.e.s.
28 - Metalliferous ores and metal scrap 71 - Power-generating machinery and equipment
29 - Crude animal and vegetable materials, n.e.s. 72 - Machinery specialized for particular industries
41 - Animal oils and fats 73 - Metalworking machinery
42 - Fixed vegetable fats and oils, crude, refined or fractionated 74 - General industrial machinery and equipment, n.e.s., and machine parts, n.e.s. 43 - Animal or vegetable fats and oils, processed; waxes of animal or vegetable origin; 75 - Office machines and automatic data-processing machines
Textiles & Clothing
26 - Textile fibres (other than wool tops and other combed wool) and their wastes (not manufactured into yarn or fabric) 78 - Road vehicles (including air-cushion vehicles) 65 - Textile yarn, fabrics, made-up articles, n.e.s., and related products 79 - Other transport equipment
84 - Articles of apparel and clothing accessories 81 - Prefabricated buildings; sanitary, plumbing, heating and lighting fixtures and fittings, n.e.s.
85 - Footwear 82 - Furniture, and parts thereof; bedding, mattresses, mattress supports, cushions and similar stuffed furnishings 83 - Travel goods, handbags and similar containers
87 - Professional, scientific and controlling instruments and apparatus, n.e.s.
88 - Photographic apparatus, equipment and supplies and optical goods, n.e.s.; watches and clocks 89 - Miscellaneous manufactured articles, n.e.s.
91 - Postal packages not classified according to kind
93 - Special transactions and commodities not classified according to kind 96 - Coin (other than gold coin), not being legal tender
97 - Gold, non-monetary (excluding gold ores and concentrates) 89 - Miscellaneous manufactured articles, n.e.s. 91 - Postal packages not classified according to kind
93 - Special transactions and commodities not classified according to kind 96 - Coin (other than gold coin), not being legal tender
97 - Gold, non-monetary (excluding gold ores and concentrates)
76 - Telecommunications and sound-recording and reproducing apparatus and equipment 77 - Electrical machinery, apparatus and appliances, n.e.s., and electrical parts thereof (including non-electrical counterparts, n.e.s., of electrical household-type
Appendix 34
Table A4: Robustness
Dependent Variable: log of real bilateral imports
Regression #: (1) (2) (3) (4) (5) (6)
Estimation Method: OLS Mutually
Incl. Coding
Only exact NRTA data
Clusters only for country-pairs.
Placebo: 10 years before + NRTA's
life span
Placebo Effect for WTO membership
Observations > $500,000
WTO - Industrial Importer
(Mutually Inclusive Coding) 0.192**
(0.079)
WTO - Developing Importer
(Mutually Inclusive Coding) 0.168**
(0.064)
NRTA (non-WTO members)
(Mutually Inclusive Coding) -0.022
(0.052)
PTA 0.382*** 0.421*** 0.422*** 0.378*** 0.385*** 0.344***
(0.054) (0.087) (0.035) (0.059) (0.064) (0.055)
Common Currency 0.323*** 0.365 0.325*** 0.323*** 0.330*** 0.258***
(0.117) (0.205) (0.075) (0.116) (0.116) (0.090)
WTO - Industrial Importer
(Mutually Exclusive Coding) 0.081 0.127*** 0.0758 0.0805 0.046
(0.081) (0.038) (0.053) (0.064) (0.057)
WTO - Developing Importer
(Mutually Exclusive Coding) 0.072 -0.002 -0.030 -0.053 -0.119**
(0.072) (0.031) (0.051) (0.060) (0.049)
NRTA (non-WTO members)
(Mutually Inclusive Coding) 0.228*** 0.129*** 0.137** 0.103* 0.133**
(0.070) (0.036) (0.059) (0.060) (0.052)
NRTA(t-10, end) 0.052
(0.060)
WTO_t-10 -0.216***
(0.057)
Observations 703,989 170,014 703,989 703,989 703,989 468,473
R2 0.82 0.85 0.83 0.83 0.82 0.84