Received: 20 November 2006 / Accepted: 07 March 2007 / Published (online): 01June 2007
Analysis of the distances covered by first division Brazilian soccer players
obtained with an automatic tracking method
Ricardo M. L. Barros 1, Milton S. Misuta 1, Rafael P. Menezes 1, Pascual J. Figueroa 2, Felipe A. Moura 3, Sergio A Cunha 3, Ricardo Anido 2 and Neucimar J. Leite 2
1
Laboratory of Instrumentation for Biomechanics, College of Physical Education, Campinas State University, Campi-nas, Brazil, 2Institute of Computing, Campinas State University, Campinas, Brazil, 3Laboratory of Biomechanical Analysis, Department of Physical Education, Paulista State University, Departamento de Educação Física, Universidade Estadual Paulista, Rio Claro, Brazil
Abstract
Methods based on visual estimation still is the most widely used analysis of the distances that iscovered by soccer players during matches, and most description available in the literature were obtained using such an approach. Recently, systems based on computer vision techniques have appeared and the very first results are available for comparisons. The aim of the present study was to analyse the distances covered by Brazilian soccer players and compare the results to the European players’, both data measured by automatic tracking system. Four regular Bra-zilian First Division Championship matches between different teams were filmed. Applying a previously developed automatic tracking system (DVideo, Campinas, Brazil), the results of 55 outline players participated in the whole game (n = 55) are presented. The results of mean distances covered, standard deviations (s) and coefficient of variation (cv) after 90 minutes were 10,012 m, s = 1,024 m and cv = 10.2%, respectively. The results of three-way ANOVA according to playing positions, showed that the distances covered by external defender (10642 ± 663 m), central midfielders (10476 ± 702 m) and external mid-fielders (10598 ± 890 m) were greater than forwards (9612 ± 772 m) and forwards covered greater distances than central defenders (9029 ± 860 m). The greater distances were covered in standing, walking, or jogging, 5537 ± 263 m, followed by moderate-speed running, 1731 ± 399 m; low speed running, 1615 ± 351 m; high-speed running, 691 ± 190 m and sprinting, 437 ± 171 m. Mean distance covered in the first half was 5,173 m (s = 394 m, cv = 7.6%) highly significant greater (p < 0.001) than the mean value 4,808 m (s = 375 m, cv = 7.8%) in the second half. A minute-by-minute analysis revealed that after eight minutes of the second half, player performance has already decreased and this reduction is maintained throughout the sec-ond half.
Key words: Biomechanics, soccer, distance covered, tracking.
Introduction
Kinematical analysis of soccer players during play can provide useful information about their performance. The distance covered by players in a match, according to play-ers positioning and range of velocities can be used, for example, to better planning subsequent training periods or evaluating the player performance during competitions.
For the collection and analysis of such information many methods, based on various principles, have thus been proposed in the literature. One of the pioneering
papers describing the fundamentals of motion analyses in soccer players was that of Reilly and Thomas (1976). The method consisted of the counting of numbers of strides for each discrete activity; this was converted into distance on the basis of length of average stride for each type of movement (e.g. standing, walking, jogging and sprinting). Methods based on visual estimation, however, still the most widely used for the analysis of the distances covered by soccer players during matches, and most de-scription available were obtained using such an approach (Bangsbo et al., 1991; Mohr et al., 2003; Withers et al., 1982). Such methods, however, are extremely time con-suming, as well as, providing only low spatial and tempo-ral resolutions; moreover, most of them do not allow simultaneous analyses of more than one player.
Newer options are being developed, however. Hennig and Briehle (2000) used a global positioning system (GPS) for the analysis of the movements of soccer players. This kind of system locates the position of an object on the globe by using satellites which receive sig-nals emitted by a transmitter located on the earth’s sur-face. Other possibilities would include the use of sensor-transmitters for the localization of players on the playing field (Holzer et al., 2003). Methods based on such princi-ples are potentially able to supply real-time measurements of the positions of various players during the game, as well as that of the trajectory of the ball. However, they require the attachment of devices to the body of the play-ers, but this has not yet been permitted by the rules of FIFA for official competitions. Results using this ap-proach were obtained in simulationor training.
Image processing and analyses have also been used although the majority of them present only partial results. In the paper of Ohashi et al. (2002), only a single player was tracked in each game. Iwase and Saito, (2004) re-ported that all players were tracked, but for only short periods of time. On the other hand, in the study of Toki and Sakurai (2005), all players were tracked for a whole game, but manually (frame-by-frame). Needham and Boyle (2001) dealt with the problem of tracking multiple sports players but again only partial results are reported.
Preliminary results using automatic tracking sys-tems have also been described (Figueroa et al., 2004; Misuta et al., 2005; Shiokawa et al., 2003; Toki and Sa-kurai, 2005). Advances in the application of information technology for sports performance and the use of a
mercial automatic system for tracking soccer (Amisco System) are discussed in Liebermann et al. (2002).
In two recent papers, we have dealt with the prob-lem of the automatic detection of soccer players in the analysis of video sequences. In the first one (Figueroa et al., 2006a), we considered the problem of recovering background pixel information for use in segmentation and tracking of video image components. The solution pro-posed was to involve a non-parametric morphological labelling operation which takes into consideration the specific problem of lighting changes and the fact that a given scene may include both slow and fast motion. Seg-mentation of soccer players was based on differences between image sequences and the corresponding back-ground representation recovered after applying morpho-logical filters. The problems related to the reduction of shadows in digital video of soccer games were also treated.
In the second paper (Figueroa et al., 2006b), track-ing was performed for all players durtrack-ing an entire game using a representation based on Graph Theory, with nodes corresponding to the blobs obtained by image segmenta-tion and edges, weighted using the informasegmenta-tion about blobs trajectory in the image sequence, representing the distance between nodes. A new way of treating occlusions was presented, which involved the splitting of segmented blobs based on morphological operators, as well as, backward and forward application of graphs allowing an increase in the number of automatically tracked frames. The method automatically located players in 94% of processed frames with a relative error of only 1.4% of the distance covered. An interface was used to complete the trajectories manually when automatic tracking fails.
Also recently, Rampinini et al. (2007) used a match analysis image recognition system, (ProZone®, Leeds, UK), to validate field tests as indicators of match-related physical performances in soccer players. They report total distances covered by 18 European professional soccer players at different ranges of velocities. Di Salvo et al. (2006, 2007), using another computerized match analysis system (Amisco®, Nice, France) published the validation of the system and data of distances covered at different playing positions and work rate from 300 European elite soccer players.
The aim of the present study was to analyse the distances covered by soccer players measured with an automatic tracking system (DVideo, Campinas, Brazil). The analysis comprises a) determination of the distance covered by 55 Brazilian soccer players of the First Divi-sion Championship according to playing positions, ranges of velocities and game periods; b) general comparison of the distances covered by Brazilian and European players; c) evaluation of the accumulated distance covered in a minute-by-minute analysis of the play in the two halves in order to determine how long it takes before a statistical significant reduction in the distance covered occurs.
Methods
Data collection
This research received the approval of the Ethics Commit-tee of the Paulista State University. Four regular Brazilian
First Division Championship matches between different teams were filmed, from 2001 to 2004 with temperatures ranging from 20°C to 30°C. In each game, four digital cameras (JVC, model GR-DVL9500, 30 Hz) were fixed at the highest points of the stadiums, each covering ap-proximately a quarter of the field, but including overlap-ping regions. Since the games took place in different stadiums, separate evaluations of best possible locations for the cameras were made. Figure 1 illustrates the loca-tions of the cameras.
Figure 1. Positioning of cameras in the stadiums.
Subjects
The trajectories of 112 different players were tracked in the four games. In order to be able to compare the dis-tances covered by the players in the two halves, however, only the results of those outline players who participated in the whole game (n = 55 players) were analyzed. Only the first 45 minutes in each half were considered, inde-pendent of any allowance for time lost, as this varied from game to game.
Automatic tracking method
After the games, the video sequences were transferred to personal computers (PC) for analysis. Since stadium, lighting conditions, uniforms etc varied from one game to another, individual software parameters were established for processing each game. The two basic automatic pro-cedures of segmentation and tracking were adopted using an interface of the DVideo software (Barros et al., 2006¸ Figueroa et al., 2003).
Situations not automatically solved were corrected manually. The majority of these consisted of players tra-jectory changes during periods of occlusions, which re-quired only the correction of the labels for those parts of the trajectories. Two additional tools were used. The tracking of mouse positions when the player was being followed by an operator and the frame-by-frame marking of the positions of the players. The percentage of auto-matic tracking remained around 95% for each player. Figure 2 illustrates the segmentation and tracking steps of the method.
Figure 2. Results of image segmentation (top) and tracking (bottom).
Before the games, approximately 20 control points were established directly by measurement of the field using a tape measure. These positions were then used to calculate image-object transformations for the calibration
of the cameras. After measuring the players positions in the video sequences, the 2D coordinates of the players in relation to these field coordinate systems were recon-structed using an image-object transformation method (Direct Linear Transformation-DLT).
The 2D coordinates of the players trajectories were then filtered using a third order Butterworth low-pass filter. In a previous study (Misuta et al., 2005), the cutoff frequency was defined as 0.4 Hz and the spatial resolu-tion was estimated to be 0.3 m in relaresolu-tion to the absolute position on the field and 1.4% of the distance covered.
The distances covered by each player were calcu-lated as the cumulative sum of players displacement be-tween two successive sampling. The Matlab® environ-ment was used to calculate the distances covered and to perform the statistical analyses.
The players were classified in five positional groups: central defenders (CD, n = 15), external defenders (ED, n = 12), central midfield players (CM, n = 11), ex-ternal midfield players (EM, n = 9) and forwards (F, n = 8). From the time-position curve obtained for each player, the time-velocity curve was numerically derived. The distances covered in each one of the following five ranges of velocities were calculated: 0 ≤ V1 < 11 km·h-1 (stand-ing, walking and jogging); 11 ≤ V2 < 14 km·h-1 (low speed running); 14 ≤ V3 < 19 km·h-1 (moderate-speed running); 19 ≤ V4 < 23 km·h-1 (high-speed running); V5 ≥ 23 km·h-1 (sprinting). This classification of playing posi-tions and ranges of velocities were selected in order to make possible comparisons with the data described in Di Salvo et al. (2007), obtained from European soccer play-ers with a similar video-based tracking system.
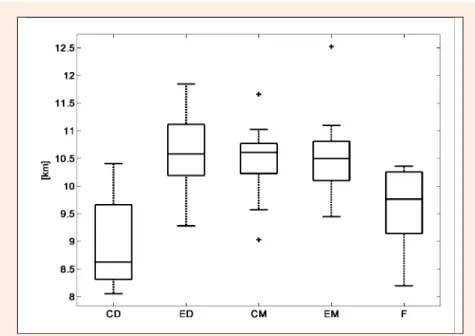
Figure 4. Box Plot representation of distances covered by First Division Brazilian soccer players (n = 55) according to playing positions after 90 minutes of play, including only those who played the whole game. The players were
classified in five positional groups: central defenders (CD, n = 15), external defenders (ED, n = 12), central
mid-field players (CM, n = 11), external midfield players (EM, n = 9) and forwards (F, n = 8).
Statistical analysis
The distances covered were expressed in terms of mean, standard deviation (s) and percentual coefficient of varia-tion (standard deviavaria-tion divided by mean multiplied by 100; cv). Box Plots were used to represent the distribu-tions of the distances covered according to playing posi-tions, ranges of velocities and game periods. Median value curves and interquartil range were used to represent the distances covered as a function of time.
The differences between the mean distances cov-ered by the 55 players after the end of the first and second halves were evaluated, as well as, between the cumulative
minute-by-minute analyses, indicating the moment when the means reveal a significant difference. Paired t-tests for repeated measures were performed, after initial testing of the normality of the distributions (Lilliefors test, P<0.01). Alternatively Kruskal-Wallis non-parametric test was used. Two significance levels were adopted: P<0.05 for significant differences and P<0.001 for highly significant differences. The results were then compared to the values found in the literature.
Three-way analysis of variance (ANOVA) was used to compare the means distances covered according to three factors: playing positions, with five factor levels
Figure 5. Box Plot representation of distances covered by First Division Brazilian soccer players (n=55) according to ranges of velocities after 90 minutes of play, including only those who played the whole game. The ranges of
ve-locities are 0 ≤ V1 < 11 km/h (standing, walking and jogging); 11 ≤ V2 < 14 km/h (low speed running); 14 ≤ V3 < 19
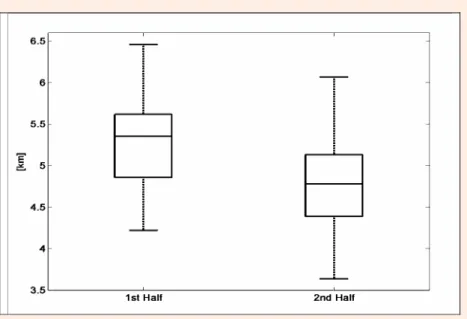
Figure 6. Box Plot representation of distances covered by First Division Brazilian soccer players (n = 55) according to game periods after 90 minutes of play, including only those who played the whole game.
(CD, ED, CM, EM, F); ranges of velocities, with five factor levels (V1, V2, V3, V4 and V5) and the game peri-ods with two factor levels (1st and 2nd halves). Initially a full model was used for testing all interactions. The non-significant interactions were removed from the model and the ANOVA was recalculated. Where a significant effect was detected, Tukey's honestly significant difference criterion (p < 0.05) was performed. The data were ana-lyzed using Matlab® 7.0.
Results
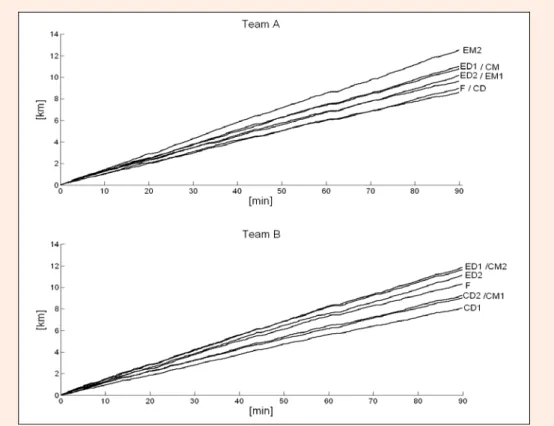
Figure 3 shows the distances covered as a function of time for those outline players who played the entire game for both teams (A and B).This representation makes it possi-ble to distinguish the performance of individual player and simultaneously observe certain aspects of the
dynam-ics of the game. For instance, the midfield player MP3 of team A regularly covered greater distances/time interval than the other players. Furthermore, the curves of all the players show a slight plateau after about 62 minutes, revealing a reduction of the average velocities. The video shows that this period corresponds to an interruption due to fault commitment in the game.
Figures 4, 5 and 6 show the Box Plots representa-tion of total distances covered by the First Division Bra-zilian soccer players (n = 55), respectively according to playing positions, ranges of velocities and game periods.
Table 1 shows the values of distances covered by Brazilian soccer players according to playing positions, ranges of velocities and game periods. Table 2 summa-rizes the results of ANOVA and Tukey's honestly signifi-cant difference criterion.
Table 1. Mean distances covered (± Standard Deviation)by First Division Brazilian soccer players (n = 55) according to
play-ing positions, ranges of velocities (V1 to V5) and game period (1st and 2nd halves). The players were classified in five positional
groups: central defenders (CD, n = 15), external defenders (ED, n = 12), central midfield players (CM, n = 11), external
mid-field players (EM, n = 9) and forwards (F, n = 8). All values of distances covered are in meters.
Distances covered in different ranges of velocities in the first and second halves
Positions 0 ≤ V1 < 11
km·h-1
11 ≤ V2 < 14
km·h-1
14 ≤ V3 < 19
km·h-1
19 ≤ V4 < 23
km·h-1
V5 ≥ 23
km·h-1
Total IND VEL
Total IND PER
1st 2nd 1st 2nd 1st 2nd 1st 2nd 1st 2nd 1st 2nd
CD 2860
(106) 2628 (209) 705 (89) 586 (120) 718 (142) 622 (148) 295 (115) 265 (100) 191 (94) 161 (84) 4768 (353) 4262 (532) 9029 (860)
ED 2832
(117) 2735 (160) 946 (155) 858 (115) 1008 (190) 923 (106) 416 (111) 363 (97) 290 (114) 272 (101) 5491 (360) 5151 (357) 10642 (663)
CM 2885
(127) 2788 (113) 974 (150) 801 (194) 1066 (201) 871 (194) 387 (106) 332 (95) 178 (70) 189 (73) 5493 (457) 4983 (383) 10476 (702)
EM 2862
(140) 2739 (109) 998 (183) 843 (214) 1075 (214) 869 (220) 425 (121) 331 (73) 245 (103) 212 (89) 5605 (411) 4993 (520) 10598 (890)
F 2738
(140) 2587 (239) 834 (237) 635 (155) 927 (213) 718 (170) 394 (106) 299 (82) 269 (84) 212 (67) 5161 (618) 4450 (370) 9612 (772) Total IND POS 2846 (134) 2680 (209) 874 (188) 726 (181) 935 (229) 786 (197) 375 (119) 316 (96) 231 (102) 206 (91) 5,173 (394) 4808 (375) Total IND
PER 5537 (263) 1615 (351) 1731 (399) 691 (190) 437 (171) 10012 (1024)
Table 2. Statistical results from ANOVA and Tukey's honestly significant difference criterion with respect to three factors: Playing positions, with five factor levels (CD, ED, CM, EM, F); ranges of velocities, with five factor levels (V1, V2, V3, V4 and
V5) and the game periods with two factor levels (1st and 2nd).
Factor Statistial Significant Diferences (p < 0.05)
Playing Positions: ED, CM, EM > F > CD Range of Velocities: V1 > V3 >V2 > V4 > V5
Periods: 1st > 2nd
Playing Positions X Range of Velocities: V1: CM > F; V2: ED, CM, EM > CD, F (except CMxF); V3: ED, CM, EM > CD Range of Velocities X Periods: V1: 1st > 2nd, V2: 1st > 2nd, V3: 1st > 2nd
Statistically significant differences were found for the three main factors: playing position (F = 32.62, p = 0), ranges of velocities (F = 5514.02, p = 0) and game peri-ods (F = 73.99, p = 0). Two interactions presented signifi-cant differences: playing positions against ranges of ve-locities (F = 4.48, p = 0) and ranges of veve-locities against periods (F = 4.64, p = 0.0011).
The results of the statistical analysis according to playing positions, removing the effects of velocity and period, showed that the distances covered by external defender (10642 ± 663 m), central midfielders (10476 ± 702 m) and external midfielders (10598 ± 890 m) did not present statistical differences. However these three groups covered greater distances than forwards (9612 ± 772 m) and forwards covered greater distances than central de-fenders (9029 ± 860 m).
Comparing the distances covered in the five ranges of velocities, statistical differences were found among all of them. The greater distances were covered in V1 (stand-ing, walk(stand-ing, jogging), 5537 ± 263 m, follow by V3 (moderate-speed running), 1731 ± 399 m, V2 (low speed running), 1615 ± 351 m, V4 (high-speed running), 691 ± 190 m and V5 (sprinting), 437 ± 171 m.
According to the ANOVA, the distances covered in the first half (5,173 ± 394 m) were greater than in the second half (4,808 ± 375 m), independently of playing positions and ranges of velocities. A highly significant reduction of 7% was observed from the first to the second half; moreover, fifty one players (93%) covered greater distances in the first half.
The interaction playing positions against ranges of velocities revealed the following results. In V1, the only significant difference appeared comparing the distances
covered by CD (2744 ± 201 m) with F (176 ± 89 m). ED (902 ± 140 m), CM (888 ± 191 m) and EM (920 ± 208 m) covered significantly greater distance than CD (645 ± 120 m) and F (734 ± 218 m), in the range of velocity V2 (low speed running), except for the comparison between CM and F. In V3 (moderate-speed running), ED (965 ± 156 m), CM (969 ± 236 m), and EM (971 ± 235 m) covered significant greater distances than CD (670 ± 150 m). No statistical differences were found among playing positions in V4 (high-speed running) and V5 (sprinting).
The interaction of ranges of velocities against time showed significant differences in V1 (standing, walking, jogging) comparing distances covered in the first (2846 ± 134 m) and second (2680 ± 209 m) halves. Greater dis-tances were also covered in the first half (874 ± 188 m) than in the second (726 ± 181 m), in V2 (low speed run-ning). The same significant difference was found in V3 (moderate-speed running), comparing the distances cov-ered in the first (935 ± 229 m) and second (786 ± 197 m) halves. No statistical differences were found comparing the distances covered in the first and second halves in V4 (high-speed running) and V5 (sprinting).
Non-significant differences (p = 0.3353) was found in the interaction of playing positions against periods, therefore, the Tukey's honestly significant difference criterion was not applied. Although the distances covered in the first half were significantly greater than in the sec-ond half when comparing all players together, it was not possible, for instance, to stat that CD players covered greater distances in the first than in the second half due to the overall variability.
The curves presented in Figure 7 correspond to the minute-by-minute medians of the distance covered in the
Figure 7. Minute-by-minute comparison of median distances covered by First Division Brazilian soccer players (n = 55) in the first and second halves. Vertical bars represent the 95% confidence interval for the median. To improve visuali-sation, bars are displayed for each minute. Once differences have reached significance, these differences are sustained.
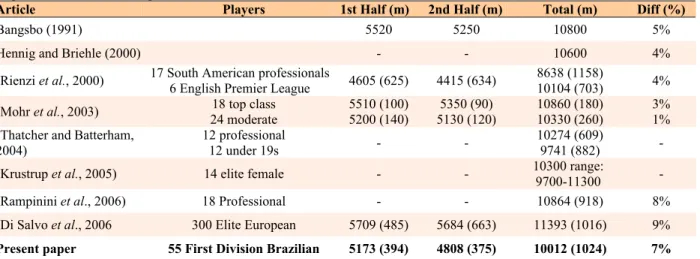
Table 3. Mean distances covered (± Standard Deviation) by First Division Brazilian soccer players (n=55) in the 1st, 2nd halves compared to similar data reported in the literature.
Article Players 1st Half (m) 2nd Half (m) Total (m) Diff (%)
Bangsbo (1991) 5520 5250 10800 5%
Hennig and Briehle (2000) - - 10600 4%
(Rienzi et al., 2000) 17 South American professionals
6 English Premier League 4605 (625) 4415 (634)
8638 (1158)
10104 (703) 4%
(Mohr et al., 2003) 18 top class 24 moderate
5510 (100) 5200 (140)
5350 (90) 5130 (120)
10860 (180) 10330 (260)
3% 1% (Thatcher and Batterham,
2004)
12 professional
12 under 19s - -
10274 (609)
9741 (882) -
(Krustrup et al., 2005) 14 elite female - - 10300 range:
9700-11300 -
(Rampinini et al., 2006) 18 Professional - - 10864 (918) 8%
(Di Salvo et al., 2006 300 Elite European 5709 (485) 5684 (663) 11393 (1016) 9%
Present paper 55 First Division Brazilian 5173 (394) 4808 (375) 10012 (1024) 7%
Diff. refers to percentage difference in relation to distances covered in the first and second halves.
first and second halves by the 55 players, with the vertical bars representing the 95% confidence interval for the medians. The minute-by-minute statistical tests revealed that after the fifth minute the median distance covered in the first half was significantly greater than in the second (p < 0.05). After eight minutes highly significant (p < 0.001) differences were found.
Discussion
The method proved to be applicable in official matches and provided useful information about the distances cov-ered by soccer players. The data were collected from four different stadiums, with different lighting conditions (both daylight and artificial lighting) and without any special requirements for players’ uniforms.
Uncertainties in relation to the measurement of dis-tances covered were estimated in previous works to ac-count for approximately 1% of the 10,012 m covered during the match, although inter-players variability was 10.2% for the four games, 7.6% and 7.8% for the first and second halves of those games, respectively. This means that the uncertainties associated with the method were at least seven times less than that associated within the play-ers. It thus seems possible to affirm that the method pro-vides reliable data about the distances covered by soccer players during official matches.
Although the method demonstrates applicability, it requires further development. The 95% of the tracking which was done automatically, is much higher than that of previous reported methods (Bangsbo et al., 1991; Mohr et al., 2003; Ohashi et al., 2002; Toki and Sakurai, 2005; Withers et al., 1982). Even so, the number of frames re-quiring manual tracking (5%) represents a great amount of work.
One possible way of overcoming this problem is the use of more cameras to record the game. The majority of problems occurred while tracking a player located on the opposite side of the field from the cameras. Such a solution would require placing cameras on both sides of the stadium, which would increase processing time, al-though it seems a reasonable option. Bangsbo et al. (2006), for example, used eight cameras.
The results of these First Division Brazilian soccer players are summarized in Table 3 and compared to re-cent and similar results found in the literature.
Although the results of Brazilian players are not matched for age and proficiency with those investigated with different methods, the comparison does provide a useful reference for consideration.
Bearing in mind the mean distances covered, these results agree with those of Mohr et al. (2003) who used time – motion analysis to demonstrate that elite players typically cover a total distance of 9 – 12 km during a game.
The mean distances covered these First Division Brazilian soccer players were also similar to those ob-tained in other countries analysing top class or moderate soccer players (Mohr et al., 2003), professional players and those under 19 (Thatcher and Batterham, 2004) as well as elite female players (Krustrup et al., 2005) or Top-Level European players (Di Salvo et al., 2007; Rampinini et al., 2007). They contrasts with those reported by (Rienzi et al., 2000) who found that international South American players covered significantly less total distance (p < 0.05) than English Premier League players did dur-ing a game.
Standard deviations vary considerably among the studies probably due to inter-players variability as shown in the Table 3. It remains unclear whether these differ-ences can be explained by the differdiffer-ences between groups or whether methodological effects may be involved. A more consistent result is related to the comparison of variabilities obtained in the three studies that used track-ing systems based on image processtrack-ing (Di Salvo et al., 2007; Rampinini et al., 2007; the present paper).
con-ducted with a large number of players(n = 55), the mean distance covered by Brazilian soccer players revealed a consistent reduction of 7% in the second half period (highly significant, p < 0.001). It is important to empha-size that this result considered only the players who participated in the whole game. Analysing the references, it was not possible to know whether all of them followed the same procedure.
According to Mohr et al. (2005), the time – motion analyses and performance measures during match-play, fatigue or reduced performance seems to occur at three different stages in the game: (1) after short-term intense periods in both halves; (2) in the initial phase of the sec-ond half; and (3) towards the end of the game.
The results of the three-way ANOVA used for ana-lysing the distances covered according to playing posi-tions, ranges of velocities and game periods were mainly compared to the recent study of Di Salvo et al. (2007) because of the similarities in the data collection (tracking system) and classifications of playing positions and ranges of velocities.
The results of Brazilian players were that ED, CM and EM covered grater distance than F, as well as CD. According to Di Salvo et al. (2007), CM and EM players covered a greater distance than CD and ED, as well as the group of F. The only difference was that Brazilian ED players covered distances as much as CM and EM play-ers.
The comparisons between Brazilian and European (Di Salvo et al., 2007) players according to range of ve-locities showed that the order of distances covered in each range of velocity independent of playing positions was the same (V1>V3>V2>V4>V5). Taking into account the playing positions, in V1 the only significantly difference was found comparing Brazilian CM and F players. In V2, the group of ED, CM and EM Brazilian players covered significantly greater distances than CD and F while the Europeans presented the follow order: CM > EM > F, ED > CD. In V3, the results of Brazilian players were ED, CM, EM > CD while the European presented CM, EM > ED > F > CD. In V4 and V5 no differences were found in the Brazilian players covered distances.
The main discrepancy between the results of the present study with the paper of Di Salvo et al. (2007) concerns the comparison of distances covered by all play-ers in the first and second halves. The present paper showed consistently reduction in the distances covered by players in the second half, in agreement with the majority of papers in the literature, but different than the results reported by Di Salvo et al. (2007).
Considering the interaction of range of velocities against periods of game, the two studies pointed out sta-tistical differences for the three lower ranges of velocities (V1, V2 and V3). The only difference was that Di Salvo et al. (2007) found that players covered a greater distance in the second half in V1.
In the present study, the minute-by-minute analysis revealed significant differences after the fifth minute (p < 0.05), with highly significant differences after the eighth. From then on, the performance was always reduced when comparing the same cumulated time intervals in the first and second halves.
These results agree only partially with Mohr et al. (2005) and Krustrup et al.(2006), since these authors found no significant differences between the distance covered in the second 5-min periods of the first and sec-ond halves. In the present study, the differences were maintained throughout the entire game. No similar results were found in the literature and this seems to be another original contribution of the paper. This information may be useful in better understanding the fatigue of soccer players during the game and/or evaluating the players performance.
Furthermore, the representation of the distances covered as a function of time has proved to be very sensi-tive to the performance of individual players, as well as, to the dynamics of the game, therefore being suitable for comparisons.
Conclusion
In this paper, we have presented results of distances cov-ered during soccer matches for 55 outline First Division Brazilian soccer players and compared the results with similar studies. The data presented were obtained using a method of automatic tracking. This novel method has proved to be a useful and less labor-intensive and should constitute an important tool for supplying data about the performance of players.
The results of the statistical analysis according to playing positions showed that the distances covered by external defender, central midfielders and external mid-fielders were greater than forwards and forwards covered greater distances than central defenders, in agreement with recent published papers.
The greater distances were covered standing, walk-ing or joggwalk-ing, follow by moderate-speed runnwalk-ing, low speed running, high-speed running and sprinting, also agreeing with similar studies.
The present paper showed consistently reduction in the distances covered by players in the second half, in agreement with the majority of previous studies, but dif-ferent than the recently results reported in the literature. Moreover after eight minutes of the second half, player performance has already decreased and this reduction is maintained throughout the second half.
Acknowledgement
We would like to thank the players who participated in the study. This research was supported by Fapesp (00/01293-1, 00/07258-3 and 05/53262-6), Capes (Prodoc), CNPq (477771/2004-1) and Rede Globo de Televisão.
References
Bangsbo, J., Mohr, M. and Krustrup P. (2006) Physical and metabolic demands of training and match-play in the elite football player.
Journal of Sports Sciences24(7), 665-674.
Bangsbo, J., Norregaard, L. and Thorso, F. (1991) Activity profile of competition soccer. Canadian Journal of Sport Sciences16(2), 110-116.
Barros, R.M.L., Russomanno, T.G., Brenzikofer, R. and Figueroa, P.J. (2006) A method to synchronise video cameras using the audio band. Journal of Biomechanics39(4), 776-780.
(serial online)6(1), (12 screens/inclusive page), June. Available from URL: http://www.ingentaconnect.com/content/uwic/ujpa Di Salvo, V., Baron, R., Tschan, H., Calderon Montero, F.J., Bachl, N.
and Pigozzi, F. (2007) Performance Characteristics According to Playing Position in Elite Soccer. International Journal of
Sports Medicine (serial online) 28(3), (06 screens/inclusive
page), March. Available from URL: http://www.thieme-connect.com/ejournals/toc/sportsmed/
Figueroa, P., Leite, N., Barros, R.M.L., Cohen, I. and Medioni, G. (2004) Tracking soccer players using the graph representation.
Proceedings of the 17th International Conference on Pattern
Recognition (ICPR), August 23-26, Cambridge-UK,IV.
787-790.
Figueroa, P.J., Leite, N.J. and Barros, R.M. (2003) A flexible software for tracking of markers used in human motion analysis.
Com-puter Methods and Programs in Biomedicine72(2), 155-165.
Figueroa, P.J., Leite, N.J. and Barros, R.M.L. (2006a) Background recovering in outdoor image sequences: An example of soccer players segmentation. Image and Vision Computing24(4), 363-374.
Figueroa, P.J., Leite, N.J. and Barros, R.M.L. (2006b) Tracking soccer players aiming their kinematical motion analysis. Computer
Vi-sion and Image Understanding101(2), 122-135.
Hennig, E. and Briehle, R. (2000) Game analysis by GPS satellite tracking of soccer players. XI Congress of the Canadian Society
for Biomechanics, Montreal-Canada. Book of Abstract. 44.
Holzer, C., Hartmann, U., Beetz, M. and von der Grun, T. (2003) Match analysis by transmitter position measurement. V World Con-gress of Science and Football, Lisbon-Portugal. Book of
Ab-stract. 152.
Iwase, S. and Saito, H. (2004) Parallel tracking of all soccer players by integrating detected positions in multiple view images. Proceed-ings of the 17th International Conference on Pattern
Recogni-tion (ICPR),August 23-26, Cambridge-UK, IV. 751 - 754.
Krustrup, P., Mohr, M., Ellingsgaard, H. and Bangsbo, J. (2005) Physi-cal demands during an elite female soccer game: importance of training status. Medicine and Science in Sports and Exercise
37(7), 1242-1248.
Krustrup, P., Mohr, M., Steensberg, A., Bencke, J., Kjaer, M. and J. Bangsbo (2006). Muscle and blood metabolites during a soccer game: implications for sprint performance. Medicine and
Sci-ence in Sports and Exercise38(6), 1165-1174.
Liebermann, D.G., Katz, L., Hughes, M.D., Bartlett, R.M., McClements, J. and Franks, I. M. (2002) Advances in the application of in-formation technology to sport performance. Journal of Sports
Sciences20(10), 755-769.
Misuta, M.S., Menezes, R.P., Figueroa, P.J., Cunha, S.A. and R.M.L. Barros (2005) Representation and analysis of soccer players' tra-jectories. XXth Congress of the International Society of
Biome-chanics, Cleveland, USA, 415.
Mohr, M., Krustrup, P. and Bangsbo, J. (2003) Match performance of high-standard soccer players with special reference to develop-ment of fatigue. Journal of Sports Sciences21(7), 519-28. Mohr, M., Krustrup, P. and Bangsbo, J. (2005) Fatigue in soccer: a brief
review. Journal of Sports Sciences23(6), 593-599.
Needham, C. J. and Boyle, R. D. (2001). Tracking multiple sports players through oclusion. British Machine Vision Conference,
Manchester-UK. 93-102.
Ohashi, J., Miyagi, O., Nagahama, H., Ogushi, T. and Ohashi, K. (2002) Application of an analysis system evaluating intermittent activ-ity during a soccer match. Proc. Science and Football IV, W. Spinks, T. Reilly and A. Murphy, London and New York,
Routledge. 32-136.
Rampinini, E., Bishop, D., Marcora, S.M., Ferrari Bravo, D., Sassi, R. and Impellizzeri, F.M. (2007) Validity of Simple Field Tests as Indicators of Match-Related Physical Performance in Top-Level Professional Soccer Players. International Journal of Sports
Medicine (serial online) 28(3), (08 screens/inclusive page),
March. Available from URL: http://www.thieme-connect.com/ejournals/toc/sportsmed/
Reilly, T. and Thomas, V. (1976. A motion analysis of work-rate in different positional roles in professional football match play.
Journal of Human Movement Studies2, 87-97.
Rienzi, E., Drust, B., Reilly, T., Carter, J.E. and Martin, A. (2000) Investigation of anthropometric and work-rate profiles of elite South American international soccer players. The Journal of
Sports Medicine and Physical Fitness40(2), 162-1699.
Shiokawa, M., Takahashi, K., Kan, A., Usui, K.O.S., Choi, C.S. and Deguchi, T. (2003) Computer analysis of a soccer game by the DLT method focusing on the movement of the players and the ball. V World Congress of Science and Football,
Lisbon-Portugal. Book of Abstract. 267.
Thatcher, R. and Batterham, A.M. (2004) Development and validation of a sport-specific exercise protocol for elite youth soccer play-ers. The Journal of Sports Medicine and Physical Fitness44(1), 15-22.
Toki, S. and Sakurai, S. (2005) Quantitative match analysis of soccer games with two dimensional DLT procedures. XXth Congress
of International Society of Biomechanics, Cleveland-USA. 911.
Withers, R. T., Maricic, Z., Wasilewski, S. and Kelly, L. (1982) Match analyses of Australian professional soccer players. Journal of
Human Movement Studies8, 159-176.
Key points
• A novel automatic tracking method was presented. No previous work was found in the literature report-ing data of simultaneous trajectories of all soccer players obtained by an automatic tracking method.
• The study reveals 7% reduction in mean distance covered in the second half and moreover after eight minutes of the second half, player performance has already decreased and this reduction is maintained throughout the second half.
AUTHORS BIOGRAPHY
Ricardo M.L. BARROS Employment
Assoc. Prof., College of Physical Education, Campinas State Univ., Campinas, Brazil.
Degrees
MS, PhD
Research interest
Biomechanics.
E-mail:ricardo@fef.unicamp.br
Milton S. MISUTA Employment
PhD student, PhD Program of Physical Education, College of Physical Education, Campinas State University, Campinas, Brazil.
Degree
Physical Education, MS
Research interest
Sports biomechanics.
E-mail:misuta@fef.unicamp.br
Rafael P. MENEZES Employment
Master student, College of Physical Education, Campinas State University, Campinas, Brazil.
Degree
Physical Education
Research interest
Sports biomechanics.
E-mail:misuta@fef.unicamp.br
Pascual J. FIGUEROA Employment
PosDoc student, College of Physical Education/Institute of Computing, Campinas State University, Campinas, Brazil.
Degrees
Computer Sciences, MS, PhD
Research interest
Computer sciences.
FELIPE A. MOURA Employment
PhD student, PhD Program of Physical Education, Department of Physical Education, Paulista State University, Departamento de Educação Física, Universidade Estadual Paulista, Rio Claro, Brazil.
Degrees
PT, MS
Research interests
Biomechanics, soccer.
E-mail:pnmlo@hotmail.com
Sergio A. CUNHA Employment
Associate Professor, College of Physical Education, Campinas State University, Campinas, Brazil.
Degrees
Physical Education, MS, PhD
Research interest
Sports Biomechanics.
E-mail:scunha@fef.unicamp.br
Ricardo ANIDO Employment
Associate Professor, Institute of Computing, Campinas State University, Campinas, Brazil.
Degrees
Computer Sciences, MS, PhD
Research interest
Computer sciences.
E-mail:ranido@ic.unicamp.br
Neucimar J. LEITE Employment
Associate Professor, Institute of Computing, Campinas State University, Campinas, Brazil.
Degrees
Computer Sciences, MS, PhD
Research interest
Computer sciences.
E-mail:neucimar@ic.unicamp.br
Prof. Dr. Ricardo M. L. Barros