RODRIGO ANDRADE TOLENTINO
AFTERMARKET SHORT COVERING IN IPOS
AND LONG-TERM STOCK LIQUIDITY
RODRIGO ANDRADE TOLENTINO
AFTERMARKET SHORT COVERING IN IPOS
AND LONG-TERM STOCK LIQUIDITY
Dissertação apresentada à Escola de Economia de São Paulo da Fundação Getúlio Vargas, como requisito para a obtenção de título de Mestre em Economia
Orientador:
Prof. Dr. Andre Portela
Tolentino, Rodrigo Andrade.
AFTERMARKET SHORT COVERING IN IPOS
AND LONG-TERM STOCK LIQUIDITY / Rodrigo Andrade Tolentino. - 2009. 31 f.
Orientador: André Portela Souza.
Dissertação (mestrado) - Escola de Economia de São Paulo.
1. Liquidez (Economia). 2. Preços -- Estabilização. 3. Ações (Finanças) -- Retrovenda . I. Souza, André Portela. II. Dissertação (mestrado) - Escola de Economia de São Paulo. III. Título.
RODRIGO ANDRADE TOLENTINO
AFTERMARKET SHORT COVERING IN IPOS
AND LONG-TERM STOCK LIQUIDITY
Dissertação apresentada à Escola de ECONOMIA de São Paulo da Fundação Getúlio Vargas, como requisito para obtenção de título de Mestre em ECONOMIA
Orientador: Prof. Dr. André Portela Data da Aprovação:
_____ / _____/ ________
Banca Examinadora:
Prof. Dr. André Portela (Orientador) FGV – EESP
Prof. Dr. Antônio Gledson de Carvalho FGV – EAESP
INDEX OF TABLES
Table 1 – Aftermarket Short Covering as Proportion of Total Trade..……..…………22
Table 2 – Variables Description ………..….………..…….……..23
Table 3 – Correlation Matrix...………...………….…….24
Table 4 – OLS-Number of Transactions (without aftermarket short covering) …...…25
Table 5 – OLS-Traded Volume (without aftermarket short covering).…….…...……26
Table 6 – OLS-Number of transaction ……...………....27
Table 7 – OLS-Traded Volume ……….…...28
Table 8 – 2SLS-First Stage ………....….……….…….29
INDEX
1 - Introduction ... 9
2 – The Price Stabilization Process ... 12
3 – Data and Methodology ... 14
3.1 – Data and Variables Description ... 14
3.2 – Methodology ... 16
4 – Empirical Results ... 18
5 – Conclusion ... 20
RESUMO
Este trabalho investiga o efeito da recompra de ações no mercado secundário
(ASC), realizada pelo banco de investimento no período de estabilização, sobre a
liquidez de longo prazo. Devido ao fato da recompra aumentar a liquidez no período
de estabilização e da liquidez seguir processo com dependência de trajetória, a
recompra pode elevar a liquidez de longo prazo. Mostramos, neste trabalho, que a
recompra tem um efeito positivo sobre a liquidez nos 6 meses subseqüentes ao
período de estabilização. Esta relação positiva se mantém mesmo quando as
variáveis utilizadas na literatura para explicar a liquidez são usadas como controle e após a instrumentalização da recompra.
ABSTRACT
This study investigates the effect of the aftermarket short covering (ASC)
carried out by the underwriter during the price stabilization period on stock long-term liquidity. Because the ASC increases liquidity during the stabilization period and
liquidity is a persistent characteristic of stocks, the ASC can increase long-term
liquidity. In fact, we show that the ASC has a positive effect on liquidity over the 6
months subsequent to the stabilization period. This positive relation holds true even
after controlling for many variables found important to explain liquidity by previous
authors and the instrumentalization of the ASC.
1 - INTRODUCTION
Stock liquidity is a critical issue for corporate financing. Enhanced liquidity can lower transaction costs and price volatility, and improve firm access to capital market by attracting investors for seasoned equity offerings (Corwin et al., 2004). Stock Liquidity can also lower the gross spreads that investment banks charge in equity offerings (Butler et al., 2005) and decrease the return that investors require to hold a particular stock (Amihud and Mendelson, 1986). These facts render liquidity in the secondary-market an important issue for IPOs. During the price stabilization period, underwriters can buy back and resell part of the stocks distributed. This action increases stock liquidity during this period. This study builds on the argument that because stock liquidity presents some persistence, price stabilization has a permanent positive effect on it.
Liquidity in the secondary-market is likely to be a path dependent process. Diverse initial conditions can generate diverse paths that can not be easily changed: low initial liquidity may turn investors less prone to acquire and, consequently, trade a particular stock. On the opposite, high initial liquidity may attract more investors, resulting in persistent high liquidity. In view of this persistence, the characteristics of the IPO and facts occurring in the initial trading period that affect liquidity (e.g., asymmetrical information, issue size, initial returns) are important because their effects on liquidity may persist. For instance, Reese (1998) finds a positive relation between initial returns (underpricing) and liquidity (measured in terms of volume traded) in the third year after the listing.
a total of 52 Brazilian IPOs that occurred between 2004 and 2007 and for which there was some ASC. One can see that for nearly 10% of these firms, the ASC corresponded to more than 40% of the whole trade; for more than 60% of these firms, the ASC corresponded to more than 20%; and for less than 20% of these firms, it was below 10%.
The empirical literature on the determinants of the initial liquidity in the secondary market is brief. Corwin et al. (2004), using a sample of 304 IPOs that took place on Nasdaq between 1995 and 1998, find that initial liquidity is higher for IPOs associated to reputed investment banks, large number of members in the underwriting syndicate and high pre-IPO demand. Booth and Chua (1996) suggest that issuers underprice to promote oversubscription, which allows disperse initial ownership and, in turn, increases secondary market liquidity. Hahn and Ligon (2004), using a sample of 1176 IPOs on Nasdaq between 1988 and 1997, find that underpricing has a positive effect on liquidity. Phan et al. (2001), using a sample of 113 IPOs that occurred in Australia between 1996 and 1999, find that liquidity is positively associated to underpricing and ownership structure.
The empirical literature relating ASC and liquidity is also brief, and restricted to liquidity during the stabilization period. Ellis et al. (2000), using a sample of 306 IPOs that took place on Nasdaq between 1996 and 1997, find that the underwriter is the only active provider of liquidity, specially when the stock trades below the issue price. Hanley et al. (1993), using a sample of 1,523 IPOs that took place on Nasdaq IPOs between 1982 and 1987, show that liquidity (measured in terms of low bid-ask spread) is higher for IPOs that are stabilized. Schultz and Zaman (1994) show that underwriters are more active in repurchasing in the aftermarket when the issue was overpriced and that, without the ASC, the bid-ask spread would be higher. Finally, Boehmer and Fishe (2004) build a case study to argue that stabilization is important to enhance liquidity and support price in the aftermarket.
disclose how much of the greenshoe option was exercised. However, it is not bound to disclose information about the stabilization process and share allocation, e.g., initial allotment among the distinct groups of investors, overallotment, and the ASC. In Brazil, since 20031 it is mandatory for underwriters to publish a note at the end of stabilization period disclosing how the shares were initially allotted among investor groups, the overallotment, the ASC, and the value of the greenshoe exercised. These data on Brazilian IPOs allows us to investigate the impact of stabilization on long-term liquidity. Our empirical findings show that ASC has a positive effect on liquidity (measured in terms of volume of trade and number of deals) that last until seven months after the IPO. This result persists even when the ASC is instrumentalized.
Our findings also contribute to the literature on why underwriters in IPOs allocate shares that will be repurchased later on. Some of the reasons already pointed are: 1) to favor some specific clientele (Benveniste et al., 1996; Zhang, 2004; Chowdry and Nanda 1996); 2) to permanently increase price in the secondary market (Schultz and Zaman, 1984); and 3) to make it harder to realize that the IPO was overpriced (Hanley et al., 1993). Our results suggest another reason: 4) overallotment and subsequent repurchase increases long-term liquidity.
This study is organized as follows. Section 2 explains the stabilization process and discusses the institutional differences between Brazil and the United States. Section 3 describes the data and the methodology. Section 4 presents the results, and Section 5 concludes.
2 – THE PRICE STABILIZATION PROCESS
Wilhelm (1999) lists three existing instruments of price stabilization in IPOs available in the US: 1) stabilizing bid: a bid posted by the underwriter at a price close to the offer price and properly identified as a stabilization bid; 2) penalties to syndicate members whose costumers flip shares in the first days of trading (this penalties are not public); and 3) the repurchase of shares in the aftermarket: the underwriter overallots the issue by selling short a number of shares in excess to the amount originally defined. This short position subsequently is covered either by repurchases of shares in the aftermarket (ASC), by the exercise of the greenshoe option (a covenant that gives the underwriter the option to buy a supplementary number of shares from the issuer at the offer price) or a combination of both. Aggarwal (2000), based on a sample of 137 US IPOs between May and July of 1997 verifies that in only 54 cases the syndicate agreement had a covenant to penalize members of the syndicate whose clients flip their shares. In only 28 IPOs the underwriter in fact used such instrument. The stabilization bid was not used in any IPO. The ASC was used in 114 IPOs. Therefore, stabilization bid and imposed penalties are either rarely used as stabilization instruments or there is little transparence when they are used. ASC usually occurs at a price near the offer one (Hanley et al., 1993; and Schultz and Zaman, 1994).
In the US there is no limit for the overallotment which is commonly greater than the greenshoe (Edwards and Hanley, 2007). The National Association of Securities Dealers (NASD) specifies that the greenshoe might not be larger than 15% of the number of shares issued.2 Chung et al. (2001) report that 92% of the IPOs in the US have greenshoe option. The stated period for the exercising of the greenshoe is usually of 30 days, although it is not restricted by law or other formal rules (Muscarella et al., 1992). Finally, the underwriter is not bound to disclose information about the level of overallotment and the ASC.
When the aftermarket price remains above the offer price, the underwriter normally prefers to cover the short position by exercising the greenshoe option (Muscarella et al., 1992). The underwriter assumes no risk when the overallotment is
2 For the US, the 15% limit was established in August of 1983. Before that, the limit was 10%
lower than the greenshoe: if the aftermarket price rises above the offer one, the short position is covered through the exercise of the greenshoe option at the offer price. On the contrary, the covering is made through ASC. Losses occur only when the overallotment is larger than the greenshoe and the price rises in the aftermarket. In fact, Aggarwal (2000) verified that in many cases short coverings were conducted at a price higher than the offer one. In some cases the difference in prices reached 5%, translating into financial losses for the underwriter.
In some aspects, the processes of going public and stabilization in Brazil are very similar to those in the US, e.g., the maximum amount of greenshoe is pre-specified in the prospectus and can not exceed 15% of the shares initially offered. Nonetheless, some differences exist, e.g., the mechanism of stabilization bid does not exist and the overallotment can not exceed the greenshoe option. The difference that interests the most for this study is that in Brazil the underwriters are bound to disclosure information about the stabilization activity. After the end of the stabilization period, the underwriter has to announce3: 1) the total number shares initially distributed (from which one can infer the overallotment); 2) whether there was stabilization; 3) how much of the overallotment was covered through ASC, and through the exercise of the greenshoe; 3) how much of total number shares initially distributed was allocated to each of the investors' groups.4
3 This is done through the publication of the so called
Anúncio de Encerramento de Oferta.
4 The groups of investors are individual investors, stockholders exercising preemptive rights,
3 – DATA AND METHODOLOGY 3.1 – Data and Variables Description
Our initial sample consists of all 106 IPOs issued on Bovespa from January 2004 to December 2007.5 From the initial sample the following issues were deleted: 1) Renar Maças (not made on a firm commitment basis); 2) Gol Linhas Aereas (offering had no provision for price stabilization); and 3) six offerings (Brasil Agro, MMX, Abyara, Investtur, MPX and Brasil Brokers) with very high price that excluded retail investors. Our final sample consists of 98 IPOs.
The data on offerings were obtained from the prospectuses and other official documents of the offerings, e.g., announcements of beginning and end of distribution. The announcement of end of distribution contains details on the overallotment, ASC (the gross number of shares repurchased, even if resold later on), and allocation of shares across investors groups. These data are available at the homepages of CVM, CBLC and Bovespa.6 Quotations for the stock price, volume traded and Ibovespa Index were taken from Economática. For each IPO stock we collected data for seven months after the IPO (140 trading days, each month representing 20 trading days): the first month – corresponding to the price stabilization period – and the six subsequent ones.
Some characteristics of the Brazilian stock market restrict the availability of liquidity measures: 1) stocks listed on Bovespa trade on an electronic auction. As consequence, measures of liquidity such as bid-ask spreads do not exist; 2) most stocks of IPOs that occurred after 2004 trade on a daily basis, precluding the use of measures based on the number of days in which the stock is traded; and 3) some shares were not traded during some days, therefore measures based on the impact of volume traded on price could not be used. In view of these restrictions, the measures of liquidity available are 1) number of transactions (the daily average of the number of time the stock was traded in the month); 2) traded volume (the daily average of the volume traded on the stock in the month); 3) number of stocks traded; and 4) share turnover. Our results for the number of stocks traded and share turnover
5 Before 2004, IPOs in Brazil were rare.
were not statistically significant. In fact, for the number of stocks traded, only the issue price and size presented statistical explanatory power (other variables that other researchers found important to explain liquidity such as price range and underpricing failed to present statistical significance); for share turnover, no variable presented statistical significance. In view of this, we restrict our analysis to the number of transactions and volume traded.
The set of firm-specific variables that other researchers found that may affect long-term liquidity and that we use as control variables are: 1) underpricing: the difference between closing price in the first trading day and the issue price divided by the issue price; 2) issue volume: the natural logarithm of the amount issued measured in reais; 3) number of shares: natural logarithm of the number of shares issued; 4) SDreturn: the standard deviation of the share returns during the month in analysis; 5) price: the issue price; 6) underwriter: the reputation of the underwriter according to the index developed in Carter and Manaster (1990) and updated by Jay Ritter;7 7) price range: the difference between the maximum and minimum price in initial filling range divided by the midpoint of the range 8) spread: gross spreads as percentage of the offer price; 9) PE/VC: dummy variable that takes value one when the issuing firm had private equity or venture capital investors, and zero otherwise; and 9) three variables for the average allotment to foreign, institutional domestic and retail investors these variables were normalized by the issue size. The set of macro economic variables (non-issuer-specific control variables) that affect liquidity are 1) market volume: daily average of the volume traded on Bovespa during the month in analysis; 2) SD market Volume: the standard deviation of the daily volume traded on Bovespa during the month in analysis; 3) Ibov Return: daily average return of Bovespa stock index (Ibovespa) during the month in analysis: 4) SD Ibov Return: the standard deviation of Ibovespa returns during the month in analysis. Price Range and Price are variables associated with the issue risk. Riskier IPOs are more difficult to be priced and present a larger price range. Average allotment to foreign, institutional domestic and retail investors are measures of ownership dispersion. SDreturn is the variable that represents the risk associated to the share return. (Table 2 summarizes these variables and Table 3, their correlation).
7
3.2 – Methodology
Our purpose is to access the effect of the ASC (that occurs in the first month after the IPO) on the long-term liquidity of stocks (from the second until the seventh month after the IPO). We use a linear model where liquidity is a function of the intensity of the ASC and a set of variables that controls for firm-specific characteristics and macroeconomic conditions. Formally, the econometric model has the following specifications:
i i
t
i ASC Y
Liquidity, 0 1 2 , (1)
where
t , i
Liquidity is a measure of the liquidity of firm i's stock on Month t 2,...,7;
i
ASC is the intensity of the aftermarket short covering for firm i(measured as the ratio between the ASC and the and the total amount initially distributed); and
i
Y is a vector of control variables, characterizing the issue of firm iand its macroeconomic environment.
The estimated coefficient for variable ASC in equation (1) may be biased due to endogeneity: the value of the ASC may be determined by other factors that also determine liquidity in the secondary market. For instance, Carvalho and Pinheiro (2008) found that the offer size is negatively related to the ASC, while the price range and gross spreads are positively correlated to ASC. To correct for endogeneity, we used the instrumental variable method through two-stage least square regressions. In the first stage, we run a regression of ASC on Yi and XIV (a set of variables that explain ASC but not Liquidityi,t). Formally, the first stage has the following
specification:
IV i
i X Y
where
i
ASC is the intensity of the aftermarket short covering for firm i; IV
X is a vector of instrumental variables; and
i
X is the same as in Equation 1.
In the second stage, the predicted values of ASCiobtained from equation (2)
are used in the liquidity regression. Formally:
0 1 1 IV i 2 i
t ,
i ( X Y ) Y
Liquidity 2 , (3)
This method provides consistent estimators for the coefficient of ASCi, 2.
Our instrumental variables are: 1) SD Market Volume 1: the standard deviation of the daily volume traded on Bovespa during the stabilization period (the first month after the IPO); 2) Ibov Return 1: the daily average return of Ibovespa index during the stabilization period; 3) SD Ibov Return1: the standard deviation of the returns of Ibovespa index during the stabilization period. These instruments are not affected by
i
4 – EMPIRICAL RESULTS
Tables 4 to 9 present the empirical analysis of the determinants of long-term liquidity. Initially, Tables 4 (number of transactions) and 5 (volume traded) present the determinants of liquidity without including the ASC as a regressor. Some of the results are in lines with what other researchers found: 1) the number of shares outstanding has positive effect on the number of transactions and the volume traded; 2) the issue price has positive effect on the volume traded but not on the number of trades; 3) underpricing has a positive and statistically significant effect on both measures of liquidity; 4) in general, Price Range has a negative impact on liquidity (the coefficient is statistically significant for all but some few months), suggesting that critical asymmetrical information leads investors away from trading; 5) the lower the amount allocated to each individual retail investor, the higher the volume traded, suggesting that a retail investors do not support long-term liquidity; 5) presence of venture capital investors has no effect on long-term liquidity; 6) in general, macroeconomic conditions has no effect on liquidity. Overall the results for the volume traded are statistically stronger than those for the number of transaction.
Tables 6 (number of transactions) and 7 (volume traded) shows the effect of the ASC on long-term liquidity. One can see that: 1) ASC presents positive effect over liquidity in the third to the seventh months that is statistical significant either at the 5% or 1% levels; 2) the second month after the IPO is the only one for which the ASC does not present statistical significance; 3) when compared to the results in Tables 4 and 5, the inclusion of the ASC as a regressor increases the statistical significance of the other variables; 4) when compared to the results in Tables 4 and 5, the inclusion of the ASC as a regressor increases the adjusted R-squared by 2 to 5% in months 3 to 7. Overall, these results corroborate our conjecture that ASC presents a permanent effect on liquidity.
instrumental variables: 1) SD Market Volume 1: the standard deviation of daily volume traded on Bovespa during the stabilization period; 2) Ibov Return 1: the daily average of the returns on Ibovespa index during the stabilization period; 3) SD Ibov Return 1: the standard deviation of the returns of Ibovespa index during the stabilization period. These variables represent the market conditions during the stabilization, and they are not affected by the characteristics of the IPO and affect the intensity of the ASC. All the other variables used in the previous analysis are also included as regressor.
5 – CONCLUSION
Liquidity in the secondary-market is likely to be a path dependent process. Different initial conditions can generate diverse paths that can not be easily changed: low initial liquidity may turn investors less prone to acquire and, consequently, trade a particular stock. On the opposite, high initial liquidity may attract more investors, resulting in persistent high liquidity.
In this study we pursue the argument that because the underwriter's aftermarket short covering increases liquidity during the stabilization period and liquidity is a persistent characteristic of stock, the aftermarket short covering increases long-term liquidity. To our knowledge, no study has empirically investigated this issue. This, most likely, is due to the lack of public data on stabilization. In Brazil, since 2003 underwriters are bound to publish a note at the end of stabilization period disclosing how the shares were allotted among investor groups, the overallotment, the aftermarket short covering, and the value of the greenshoe exercised. This data availability for Brazilian IPOs motivates the investigation on the impact of stabilization on long-term liquidity.
6 – REFERENCES
Aggarwal, Reena, 2000, Stabilization Activities by Underwriters after Initial Public Offerings. Journal of Finance 55 (3), 1075-1103.
Benveniste, Lawrence M., Walid Y. Busab, and William J. Wilhelm Jr., 1996, Price Stabilization as a Bonding Mechanism in New Equity Issues. Journal of Financial Economics 42, 223-255.
Boehmer, Ekkehart, and Raymond. P. H. Fishe, 2004, Underwriter Short Covering in the IPO Aftermarket: A Clinical Study. Journal of Corporate Finance 10, 575-594. Booth, James R., and Lena Chua, 1996, Ownership dispersion, costly information,
and IPO underpricing, Journal of Financial Economics 41, 291-310.
Chowdhry, Bhagwan, and Vikram Nanda, 1996, Stabilization, Syndication, and Pricing of IPOs. Journal of Financial and Quantitative Analysis 31 (1), 25-42.
Chung, Richard, Lawrence Kryzanowski, and Ian Rakita, 2001, Relative Importance of the Price Stabilization Role of Overallotment Options In Canadian IPOs. Financial Managemeng Association Conference, Toronto.
De Carvalho, Antonio G., and Douglas B. Pinheiro, 2008, Determinants of Stabilization in Initial Public Offerings, Working Paper, Fundação Getúlio Vargas. Available at SSRN: http://papers.ssrn.com/sol3/papers.cfm?abstract_id=1140800 Corwin Shane. A., Jeffrey H. Harris, and Marc L. Lipson, 2004, The development of
secondary market liquidity for NYSE-listed IPOs, Journal of Finance 59, 2339 –
2374.
Demsetz, Harold, 1968. The cost of transactions, Quarterly Journal of Economics 82, 33--53.
Ellies, Katrina, Rony Michaely, and Maureen O’Hara, 2000, When the underwriter is the market maker: An examination of trading in the IPO aftermarket, Journal of Finance 55, 1039 – 1074.
Hahn, TeWhan, and James A. Ligon, 2004, Liquidity and Initial Public Offering Underpricing, Working Paper, The University of Idaho. Available at SSRN: http://papers.ssrn.com/sol3/papers.cfm?abstract_id=929141
Hanley, Kathleen W., Arun Kumar, and Paul Seguin, 1993, Price Stabilization in the Market for New Issues. Journal of Financial Economics 34, 177-197.
Pham, Peter K., Petko S. Kalev, and Adam B. Steen, 2003. Underpricing, stock allocation, ownership structure and post-listing liquidity of newly listed firms, Journal of Banking and Finance 27(5), 919-947.
Reese, William A., 1998, IPO underpricing, trading volume, and investor interest, Working Paper, Tulane University. Available at SSRN: http://ssrn.com/abstract=115348
Ruud, Judith S., 1993, Underwriter Price Support and the IPO Underpricing Puzzle. Journal of Financial Economics 34, 135-151.
Schultz, Paul and Mir A. Zaman, 1994, Aftermarket Support and Underpricing of Initial Public Offerings. Journal of Financial Economics 35, 199-219.
Wilhelm Jr, William J., 1999, Secondary Market Stabilization of IPOs. Journal of Applied Corporate Finance 12 (1), 78-85.
Table 1
Aftermarket Short Covering as Proportion of Total Trade
Shares traded is calculated as the number of shares repurchased in the aftermarket short covering divided by the number of shares traded during the first month subsequent to the IPO. Volume traded is calculated as the number of shares traded multiplied by the issue price and divided by the volume traded during the first month subsequent to the IPO. Results calculated for a total of 52 firms for which there was some aftermarket short covering.
Proportion of shares and volume traded
number of firms (percentage)
shares traded volume traded
40% x 5
(9.6)
6 (11.5)
30% x < 40% 8
(15.4)
11 (21.2)
20% x < 30% (38.5) 20 (36.6) 19
10% x < 20% 10
(19.2)
9 (17.3)
x < 10% 9
(17,3)
7 (13.5)
total number of firms 52
(100)
Table 2
Variables Description
Variable Description
Number of Transaction
the daily average of the number of time the stock was traded in the month
Traded Volume the daily average of the volume traded on the stock in the month
ASC
the ratio between the amount of stocks of the issuing firm bought by the underwriter during the stabilization period and the total amount initially distributed.
Issued Volume the natural logarithm of the amount issued measured in reais Number of shares natural logarithm of the number of shares issued
SDreturn the standard deviation of the share returns during the month in analysis
Price the issue price
Underpricing the difference between closing price in the first trading day and the issue price divided by the issue price
Underwriter
Underwriter’s reputation according to the ranking developed by Carter and Manaster (1990) and updated by Jay Ritter1 for the period between 2001-2004. The rate correspond to the most reputable member of the syndicate Underwriters not ranked were attributed the rate, i.e., 1.1.
Price Range the difference between the maximum and minimum price in initial filling range divided by the midpoint of the filling range
Spread gross spreads as percentage of the offer price
PE/VC dummy that takes value one if the issuing firm had private equity or venture capital investors, and zero otherwise
Average allotment
average amount allocated to foreign, domestic institutional and retail investors normalized by the issue size:
shares issued of number total n n
varegeallotment umberofsharesacquiredbythegroup umberofinvestorsinthegroup
A
Market Volume daily average of the volume traded in Bovespa in reais during the month in analysis
SD Market Volume the standard deviation of the daily volume traded in Bovespa in reais during the month in analysis
Ibov Return daily average return of Bovespa stock index (Ibovespa) during the month in analysis
SD Ibov Return the standard deviation of Ibovespa returns during the month in analysis
1
Table 3 Correlation Matrix
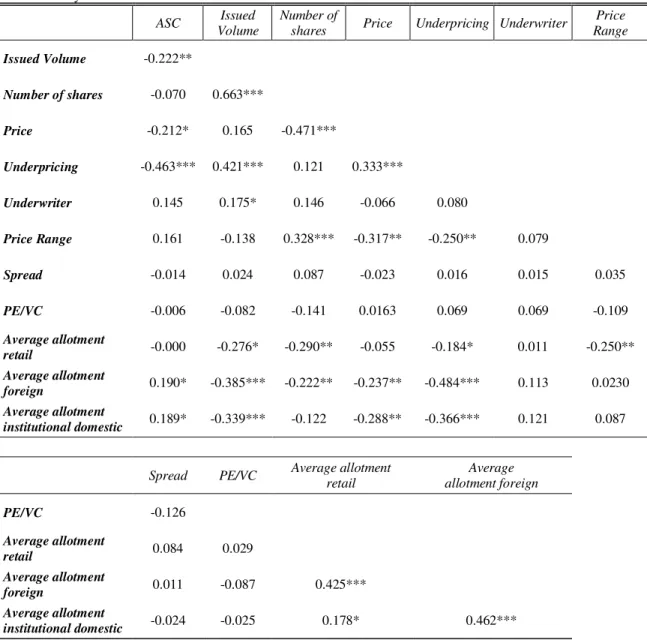
Correlations between independent variables. The variables are: ASC: the ratio between the amount of stocks of the issuing firm bought by the underwriter during the stabilization period and the total amount initially distributed; Issue Volume: the natural logarithm of the amount issued measured in reais; Number of shares: natural logarithm of the number of shares issued; Price: the issue price; Underpricing: the difference between closing price in the first trading day and the issue price divided by the issue price; Underwriter: underwriter reputation; Price Range: the difference between the maximum and minimum price in initial filling range divided by the midpoint of the filling range: Spread: gross spreads as percentage of the offer price; Price: the offer price; PE/VC: dummy that takes value one if the issuing firm had private equity or venture capital investors, and zero otherwise; Average allotment to foreign, institutional domestic and retail investors: average amount allocated to foreign, institutional domestic and retail investors normalized by the issue size.
ASC Issued
Volume
Number of
shares Price Underpricing Underwriter
Price Range
Issued Volume -0.222**
Number of shares -0.070 0.663***
Price -0.212* 0.165 -0.471***
Underpricing -0.463*** 0.421*** 0.121 0.333***
Underwriter 0.145 0.175* 0.146 -0.066 0.080
Price Range 0.161 -0.138 0.328*** -0.317** -0.250** 0.079
Spread -0.014 0.024 0.087 -0.023 0.016 0.015 0.035
PE/VC -0.006 -0.082 -0.141 0.0163 0.069 0.069 -0.109
Average allotment
retail -0.000 -0.276* -0.290** -0.055 -0.184* 0.011 -0.250**
Average allotment
foreign 0.190* -0.385*** -0.222** -0.237** -0.484*** 0.113 0.0230
Average allotment
institutional domestic 0.189* -0.339*** -0.122 -0.288** -0.366*** 0.121 0.087
Spread PE/VC Average allotment
retail
Average allotment foreign
PE/VC -0.126
Average allotment
retail 0.084 0.029
Average allotment
foreign 0.011 -0.087 0.425***
Average allotment
institutional domestic -0.024 -0.025 0.178* 0.462***
Table 4
Number of Transactions
(without aftermarket short covering)
Regression on number of transactions, calculated as the daily average of the number of time the stock was traded in the month. The independent variables are: Issue Volume: the natural logarithm of the amount issued measured in reais;
Number of shares: natural logarithm of the number of shares issued; SDreturn: the standard deviation of the share returns during the month in analysis; Price: the offer price; Underpricing: the difference between closing price in the first trading day and the issue price divided by the issue price; Underwriter: underwriter reputation; Price Range: the difference between the maximum and minimum price in initial filling range divided by the midpoint of the filling range: Spread: gross spreads as percentage of the offer price; PE/VC: dummy that takes value one if the issuing firm had private equity or venture capital investors, and zero otherwise; Average allotment to foreign, institutional domestic and retail investors: average amount allocated to foreign, institutional domestic and retail investors normalized by the issue size; Market Volume: daily average of the volume traded in Bovespa in reais during the month in analysis; SD Market Volume: the standard deviation of the daily volume traded in Bovespa in reais during the month in analysis;
Ibov Return: daily average return of Bovespa stock index (Ibovespa) during the month in analysis: SD Ibov Return: the standard deviation of Ibovespa returns during the month in analysis. Dummies of sector are used in all regressions. The estimators were calculated using the robust matrix of covariate. T-Statistic is reported in brackets. The constant was omitted. The sample consists of the 96 IPOs for which there was overallotment.
number of transaction Month 2 Month 3 Month 4 Month 5 Month 6 Month 7
Issue Volume 133.7 147.8 179.5* 151.8 231.4* 179.7
(1.13) (1.02) (1.79) (1.61) (1.89) (1.24)
Number of shares 385.4** 424.1** 262.2** 353.2*** 323.4*** 456.9***
(2.60) (2.54) (2.49) (2.91) (2.66) (2.75)
SDreturn 3,137.2 -17.1 -2.4 14.6 6.1 29.2
(0.96) (0.68) (0.12) (0.61) (0.19) (0.82)
Price 12.4* 10.5 6.1 10.6* 6.9 15.3*
(1.84) (1.43) (1.25) (1.95) (1.17) (1.74)
Underpricing 832.7** 1,133.7 876.5 722.2* 1,487.1* 1,190.7*
(2.24) (1.36) (1.31) (1.92) (1.92) (1.98)
Underwriter -18.0 -12.3 -10.2 -10.9 -18.0 -11.5
(1.01) (0.51) (0.56) (0.81) (1.09) (0.52)
Price Range -1,876.8** -1,440.1* -851.9 -1,386.7* -1,491.1** -1,944.6**
(2.01) (1.97) (1.50) (1.73) (2.04) (2.04)
Spread 8,526.7 336.3 1,555.8 5,705.3 3,154.9 4,320.8
(1.44) (0.10) (0.53) (1.13) (0.81) (0.76)
PE/VC 116.0 -2.9 4.4 88.7 84.2 107.2
(1.15) (0.04) (0.07) (0.96) (1.05) (1.07)
Market Volume 0.0 0.0 0.0 0.0 0.0** 0.0
(1.46) (0.03) (0.36) (0.16) (2.14) (0.34)
SD Market Volume -0.0* 0.0 -0.0 -0.0 -0.0* 0.0
(1.79) (0.96) (1.48) (0.44) (1.88) (0.42)
Ibov Return -13,528.5 -24,477.5* -1,348.7 5,586.4 7,164.3 8,928.4
(1.28) (1.68) (0.18) (0.75) (0.74) (0.77)
SD Ibov Return 19,553.2 -4,133.1 -44.7 2,215.8 -17,572.1* -4,037.2
(1.23) (0.58) (0.01) (0.33) (1.72) (0.46)
Average allotment retail 1,502.6 1,8656* 703.3 513.9 1,013.2 1,385.8
(1.56) (1.73) (1.14) (0.81) (0.97) (1.25)
Average allotment foreign
-5.0 -0.7 2.2 1.7 5.8 1.6
(0.63) (0.10) (0.36) (0.29) (0.64) (0.20)
Average allotment institutional domestic
7.0 17.3 14.9 14.3 25.8 24.9
(0.37) (0.87) (0.87) (0.88) (1.19) (1.02)
Observations 96 96 96 96 96 96
Adjusted R2 0.60 0.53 0.53 0.58 0.62 0.57
Table 5 Traded Volume
(without aftermarket short covering)
Regression on traded volume, calculated as the daily average of the volume traded on the stock in the month. The independent variables are: Issue Volume: the natural logarithm of the amount issued measured in reais; Number of shares: natural logarithm of the number of shares issued; SDreturn: the standard deviation of the share returns during the month in analysis; Price: the offer price; Underpricing: the difference between closing price in the first trading day and the issue price divided by the issue price; Underwriter: underwriter reputation; Price Range: the difference between the maximum and minimum price in initial filling range divided by the midpoint of the filling range: Spread: gross spreads as percentage of the offer price; PE/VC: dummy that takes value one if the issuing firm had private equity or venture capital investors, and zero otherwise; Average allotment to foreign, institutional domestic and retail investors: average amount allocated to foreign, institutional domestic and retail investors normalized by the issue size; Market Volume: daily average of the volume traded in Bovespa in reais during the month in analysis; SD Market Volume: the standard deviation of the daily volume traded in Bovespa in reais during the month in analysis; Ibov Return: daily average return of Bovespa stock index (Ibovespa) during the month in analysis: SD Ibov Return: the standard deviation of Ibovespa returns during the month in analysis. Dummies of sector are used in all regressions. The estimators were calculated using the robust matrix of covariate. T-Statistic is reported in brackets. The constant was omitted. The sample consists of the 96 IPOs for which there was overallotment.
volume traded Month 2 Month 3 Month 4 Month 5 Month 6 Month 7
Issued Volume 7,348.8* 5,947.5 5,476.0 5,525.2 6,234.5 8,203.4
(1.95) (1.09) (1.54) (1.33) (1.44) (1.25)
Number of shares 12,372.2*** 15,398.1** 9,093.0** 10,474.3** 11,777.0** 16,940.6**
(2.90) (2.48) (2.62) (2.60) (2.64) (2.44)
SDreturn 102,118.3 -479.8 149.0 578.0 287.5 1,223.0
(1.03) (0.65) (0.31) (0.98) (0.29) (1.21)
Price 487.0** 597.5** 398.4** 590.4** 485.2* 741.6*
(2.46) (2.05) (2.02) (2.10) (1.86) (1.87)
Underpricing 42,490.8*** 56,299.2* 29,426.5* 30,021.8*** 48,192.7* 64,680.7**
(2.79) (1.84) (1.81) (3.01) (1.97) (2.04)
Underwriter -708.2 -617.5 -174.0 -443.9 -372.8 -500.2
(1.25) (0.71) (0.33) (0.94) (0.61) (0.50)
Price Range -47,459.9* -28,079.5 -22,020.3 -18,074.7 -35,072.5* -59,186.4*
(1.91) (1.17) (1.44) (1.08) (1.91) (1.87)
Spread 185,416.1 -102,269.4 -38,269.7 26,171.9 42,031.7 26,070.3
(1.32) (0.87) (0.59) (0.35) (0.46) (0.19)
PE/VC 4,112.2 -1,220.4 -107.8 881.2 2,210.0 2,435.8
(1.65) (0.51) (0.08) (0.58) (1.19) (0.92)
Market Volume 0.0 0.0 0.0 -0.0 0.0 0.0
(1.44) (0.06) (0.14) (0.53) (1.66) (0.21)
SD Market Volume -0.0 0.0 -0.0 0.0 -0.0 0.0
(1.58) (0.89) (0.31) (0.94) (1.41) (0.84)
Ibov Return -333,160.9 -529,882.5 83,545.0 303,585.3 274,617.5 500,477.3
(1.14) (1.05) (0.40) (1.27) (0.94) (0.98)
SD Ibov Return 278,094.7 -62,140.8 -109,882.0 91,280.6 -399,636.7 -115,596.1
(0.68) (0.27) (0.74) (0.48) (1.47) (0.39)
Average allotment retail
63,258.0* 83,875.6* 38,124.3* 46,443.6* 52,141.4 94,529.1*
(1.92) (1.90) (1.84) (1.79) (1.47) (1.67)
Average allotment foreign
-58.0 138.6 32.7 39.7 146.2 106.0
(0.25) (0.56) (0.18) (0.24) (0.51) (0.33)
Average allotment institutional domestic
533.2 661.7 335.6 424.1 583.3 911.6
(0.98) (0.95) (0.77) (0.95) (0.86) (1.22)
Observations 96 96 96 96 96 96
Adjusted R2 0.70 0.57 0.65 0.64 0.65 0.61
Table 6
Number of transaction
Regression on number of transactions, calculated as the daily average of the number of time the stock was traded in the month. The independent variable ASC is the ratio between the amount of stocks of the issuing firm bought by the underwriter during the stabilization period and the total amount initially distributed. The control variables are: Issue Volume: the natural logarithm of the amount issued measured in reais; Number of shares: natural logarithm of the number of shares issued; SDreturn: the standard deviation of the share returns during the month in analysis; Price: the offer price;
Underpricing: the difference between closing price in the first trading day and the issue price divided by the issue price ;
Underwriter: underwriter reputation; Price Range: the difference between the maximum and minimum price in initial filling range divided by the midpoint of the filling range: Spread: gross spreads as percentage of the offer price; PE/VC: dummy that takes value one if the issuing firm had private equity or venture capital investors, and zero otherwise;
Average allotment to foreign, institutional domestic and retail investors: average amount allocated to foreign, institutional domestic and retail investors normalized by the issue size; Market Volume: daily average of the volume traded in Bovespa in reais during the month in analysis; SD Market Volume: the standard deviation of the daily volume traded in Bovespa in reais during the month in analysis; Ibov Return: daily average return of Bovespa stock index (Ibovespa) during the month in analysis: SD Ibov Return: the standard deviation of Ibovespa returns during the month in analysis. Dummies of sector are used in all regressions. The estimators were calculated using the robust matrix of covariate. T-Statistic is reported in brackets. The constant was omitted. The sample consists of the 96 IPOs for which there was overallotment.
Number of transaction Month 2 Month 3 Month 4 Month 5 Month 6 Month 7
ASC -14.8 1,861.6** 1,376.9** 1,267.7*** 1,590.6** 1,683.2**
(0.02) (2.53) (2.63) (2.66) (2.14) (2.27)
Issued Volume 133.8 121.7 160.7* 136.9* 199.2* 155.7
(1.11) (1.06) (1.90) (1.74) (1.73) (1.26)
Number of shares 385.0*** 489.0*** 307.9*** 378.7*** 369.3*** 491.6***
(2.72) (3.19) (3.07) (3.43) (2.97) (3.31)
SDreturn 3,147.2 -26.6 -12.1 2.8 -6.0 13.0
(0.90) (1.07) (0.65) (0.12) (0.18) (0.38)
Price 12.3* 14.7** 9.0* 13.2** 11.2* 18.7**
(1.87) (2.21) (1.89) (2.60) (1.68) (2.26)
Underpricing 829.3** 1,693.9* 1,264.7* 1,106.4*** 2,005.7** 1,771.4**
(2.05) (1.85) (1.78) (2.91) (2.30) (2.54)
Underwriter -17.8 -31.6 -23.3 -23.7 -35.8* -30.1
(1.01) (1.10) (1.15) (1.58) (1.73) (1.16)
Price Range -1,875.4** -1,538.4** -907.0 -1,402.0* -1,531.4** -1,936.1**
(2.07) (2.21) (1.62) (1.77) (2.09) (2.12)
Spread 8,526.7 -136.2 1,308.3 5,540.5 2,656.2 3,741.9
(1.43) (0.04) (0.46) (1.12) (0.68) (0.68)
PE/VC 115.7 4.1 11.6 94.4 94.3 114.2
(1.23) (0.06) (0.20) (1.01) (1.15) (1.13)
Market Volume 0.0 -0.0 0.0 0.0 0.0** 0.0
(1.48) (0.05) (0.11) (0.18) (2.04) (0.84)
SD Market Volume -0.0* 0.0 -0.0 -0.0 -0.0 0.0
(1.67) (1.34) (1.21) (0.60) (1.57) (0.25)
Ibov Return -13,505.4 -26,886.3* -2,853.7 10,513.1 12,729.6 1,760.8
(1.30) (1.92) (0.38) (1.30) (1.20) (0.16)
SD Ibov Return 19,631.9 -6,871.3 1,503.0 7,110.8 -14,692.1 -9,633.4
(1.05) (1.05) (0.26) (1.04) (1.35) (1.03)
Average allotment retail 1,501.3 2,392.2 988.0 701.7 1,394.6 1,792.1
(1.57) (1.97) (1.45) (1.08) (1.21) (1.54)
Average allotment foreign
-5.1 1.9 4.9 2.8 7.0 4.2
(0.62) (0.26) (0.73) (0.46) (0.78) (0.47)
Average allotment institutional domestic
6.0 22.2 15.2 15.0 30.8 25.0
(0.35) (1.11) (0.91) (0.88) (1.39) (1.03)
Observations 96 96 96 96 96 96
Adjusted R2 0.59 0.58 0.57 0.60 0.64 0.59
Table 7 Traded Volume
Regression on traded volume, calculated as the daily average of the volume traded on the stock in the month. The independent variable ASC is the ratio between the amount of stocks of the issuing firm bought by the underwriter during the stabilization period and the total amount initially distributed. The control variables are: Issue Volume: the natural logarithm of the amount issued measured in reais; Number of shares: natural logarithm of the number of shares issued;
SDreturn: the standard deviation of the share returns during the month in analysis; Price: the offer price; Underpricing: the difference between closing price in the first trading day and the issue price divided by the issue price ; Underwriter: underwriter reputation; Price Range: the difference between the maximum and minimum price in initial filling range divided by the midpoint of the filling range: Spread: gross spreads as percentage of the offer price; PE/VC: dummy that takes value one if the issuing firm had private equity or venture capital investors, and zero otherwise; Average allotment to foreign, institutional domestic and retail investors: average amount allocated to foreign, institutional domestic and retail investors normalized by the issue size; Market Volume: daily average of the volume traded in Bovespa in reais during the month in analysis; SD Market Volume: the standard deviation of the daily volume traded in Bovespa in reais during the month in analysis; Ibov Return: daily average return of Bovespa stock index (Ibovespa) during the month in analysis: SD Ibov Return: the standard deviation of Ibovespa returns during the month in analysis. Dummies of sector are used in all regressions. The estimators were calculated using the robust matrix of covariate. T-Statistic is reported in brackets. The constant was omitted. The sample consists of the 96 IPOs for which there was overallotment.
Traded Volume Month 2 Month 3 Month 4 Month 5 Month 6 Month 7
ASC 11,275.5 60,823.5** 33,377.9** 39,686.5*** 50,477.6** 71,335.7**
(0.47) (2.24) (2.59) (3.43) (2.24) (2.28)
Issued Volume 7,261.3** 5,093.6 5,020.8* 5,058.4 5,213.0 7,187.2
(1.99) (1.23) (1.70) (1.42) (1.32) (1.33)
Number of shares 12,679.2*** 17,518.0*** 10,200.2*** 11,272.2*** 13,233.3*** 18,409.7***
(3.07) (3.12) (3.29) (3.27) (3.01) (3.07)
SDreturn 94,517.7 -789.3 -85.0 205.9 -98.2 540.3
(0.92) (1.10) (0.19) (0.37) (0.10) (0.56)
Price 513.1** 736.2*** 470.4** 673.0** 619.9** 884.7**
(2.58) (2.94) (2.57) (2.54) (2.32) (2.45)
Underpricing 45,088.6** 74,603.8** 38,836.0** 42,050.2*** 64,651.8** 89,290.8**
(2.61) (2.14) (2.24) (4.24) (2.31) (2.35)
Underwriter -801.7 -1,249.1 -490.7 -843.6* -937.0 -1,284.3
(1.33) (1.21) (0.88) (1.73) (1.29) (1.10)
Price Range -48,604.0* -31,289.0 -23,357.5 -18,551.1 -36,350.9* -58,827.7*
(1.98) (1.35) (1.54) (1.13) (1.99) (1.96)
Spread 185,448.2 -117,707.0 -44,268.7 21,011.4 26,205.6 1,535.1
(1.30) (1.03) (0.72) (0.30) (0.29) (0.01)
PE/VC 4,367.1* -993.6 66.7 1,060.4 2,531.0 2,734.9
(1.84) (0.43) (0.05) (0.70) (1.35) (1.04)
Market Volume 0.0 -0.0 -0.0 -0.0 0.0 0.0
(1.48) (0.02) (0.08) (0.56) (1.55) (0.80)
SD Market Volume -0.0 0.0 -0.0 0.0 -0.0 0.0
(1.43) (1.28) (0.08) (0.83) (0.99) (0.67)
Ibov Return -350,762.3 -608,580.6 47,061.4 457,824.4* 451,235.6 196,713.5
(1.19) (1.23) (0.22) (1.83) (1.38) (0.45)
SD Ibov Return 218,044.3 -151,606.2 -72,363.9 244,527.2 -308,236.3 -352,763.6
(0.45) (0.71) (0.55) (1.29) (1.08) (1.04)
Average allotment retail
64,236.4* 101082.1** 45,048.3** 52,323.1* 64,244.9 111749.5*
(1.93) (2.04) (2.00) (1.96) (1.64) (1.84)
Average allotment foreign
-46.7 223.8 97.6 73.4 186.6 215.1
(0.20) (0.82) (0.50) (0.43) (0.65) (0.62)
Average allotment institutional domestic
564.1 820.3 343.7 447.7 742.9 953.7
(1.00) (1.15) (0.80) (0.96) (1.09) (1.33)
Observations 96 96 96 96 96 96
Adjusted R2 0.70 0.61 0.67 0.67 0.68 0.65
Table 8 First Stage
First stage regression. The independent variable ASC is the ratio between the amount of stocks of the issuing firm bought by the underwriter during the stabilization period and the total amount initially distributed. Instrumental variable are: SD Market Volume1: Standard deviation of the volume in Ibovespa Index in reais, in the first month after the IPO; Ibov Return1: daily average of Ibovespa return in the first month after the IPO: SD Ibov Return1: Standard deviation of Ibovespa return in the first month after the IPO. The other independent variables are: Issue Volume: the natural logarithm of the amount issued measured in reais; Number of shares: natural logarithm of the number of shares issued; SDreturn: the standard deviation of the share returns during the month in analysis; Price: the offer price; Underpricing: the difference between closing price in the first trading day and the issue price divided by the issue price; Underwriter: underwriter reputation; Price Range: the difference between the maximum and minimum price in initial filling range divided by the midpoint of the filling range: Spread: gross spreads as percentage of the offer price; PE/VC: dummy that takes value one if the issuing firm had private equity or venture capital investors, and zero otherwise; Average allotment to foreign, institutional domestic and retail investors: average amount allocated to foreign, institutional domestic and retail investors normalized by the issue size; Market Volume: daily average of the volume traded in Bovespa in reais during the month in analysis; SD Market Volume: the standard deviation of the daily volume traded in Bovespa in reais during the month in analysis; Ibov Return: daily average return of Bovespa stock index (Ibovespa) during the month in analysis: SD Ibov Return: the standard deviation of Ibovespa returns during the month in analysis. Dummies of sector are used in all regressions. The estimators were calculated using the robust matrix of covariate. T-Statistic is reported in brackets. The constant was omitted. The sample consists of the 96 IPOs for which there was overallotment.
ASC Month 2 Month 3 Month 4 Month 5 Month 6 Month 7
Issued Volume (1.02) 0.022 (1.09) 0.025 (1.19) 0.026 (1.11) 0.024 (0.99) 0.022 (1.15) 0.026
Number of shares -0.037* -0.036 -0.038* -0.031 -0.031 -.034
(-1.77) (1.60) (1.80) (1.51) (1.41) (1.56)
SDreturn 0.489 0.001 0.003 0.005 0.007 0.007
(0.97) (0.17) (0.43) (0.49) (0.53) (0.57)
Price -0.002* -0.002** -0.002** -0.002** -0.002* -0.002*
(1.99) (2.06) (2.16) (2.08) (1.90) (1.95)
Underpricing -0.273*** -0.316*** -0.315*** -0.333*** -.308*** -0.321***
(3.90) (4.50) (4.59) (4.86) (4.37) (4.37)
Underwriter 0.008** 0.009** 0.009** 0.010** 0.009** 0.009**
(2.17) (2.32) (2.28) (2.57) (2.47) (2.44)
Price Range 0.077 -0.000 0.017 0.024 0.049 0.036
(0.72) (0.00) (0.15) (0.22) (0.46) (0.29)
Spread -0.099 0.105 0.119 0.054 0.232 0.163
(0.23) (0.23) (0.26) (0.12) (0.50) (0.34)
PE/VC -0.015 -0.007 -0.008 -0.006 -0.007 -0.007
(1.18) (0.61) (0.67) (0.48) (0.62) (0.57)
Market Volume -0.000 0.000** 0.000 -0.000 0.000 -0.000**
(0.79) (2.52) (1.55) (0.69) (1.33) (2.18)
SD Market Volume -0.000 -0.000 -0.000 0.000 -0.000** 0.000
(0.91) (0.70) (0.16) (0.41) (0.04) (0.89)
Ibov Return -2.263 -1.724 1.673 -2.665 -0.417 1.595
(0.92) (0.81) (0.89) (1.27) (0.19) (0.79)
SD Ibov Return 2.154 1.272 -0.323 -3.648** 0.562 0.952
(0.92) (0.96) (0.22) (2.22) (0.29) (0.65)
Average allotment retail -10.652 -63.484 -66.473 -25.972 -112.248 -57.478
(0.05) (0.30) (0.32) (0.13) (0.55) (0.26)
Average allotment foreign -1.209 -1.524 -1.796 -0.912 -0.915 -1.373
(0.76) (0.90) (1.14) (0.57) (0.57) (0.83)
Average allotment institutional domestic
-3.748 -2.942 -1.724 -2.476 -3.135 -2.651
(0.92) (0.68) (0.40) (0.59) (0.74) (0.59)
SD Market Volume1 -0.000 -0.000** -0.000** -0.000 -0.000* -0.000
(1.46) (2.36) (2.24) (1.54) (1.67) (1.64)
Ibov Return1 -5.563** -7.900*** -7.809*** -8.718*** -7.020*** -5.898**
(2.26) (3.07) (3.33) (3.52) (2.85) (2.05)
SD Ibov Return1 -1.395 -2.498 -2.822 -4.529** -2.673 -2.827
(-0.80) (1.41) (1.63) (2.08) (1.52) (1.53)
Observations 96 96 96 96 96 96
R2 ajustado 0.31 0.16 0.16 0.21 0.24 0.24
Table 9 Second Stage
The dependent variables are: number of transactions, calculated as the daily average of the number of time the stock was traded in the month; and traded volume, calculated as the daily average of the volume traded on the stock in the month. The independent variable ASC is calculated in the first stage for each month. Instrumental variable are: SD Market Volume1: Standard deviation of the volume in Ibovespa Index in reais, in the first month after the IPO; Ibov Return1: daily average of Ibovespa return in the first month after the IPO: SD Ibov Return1: Standard deviation of Ibovespa return in the first month after the IPO. The independent variables are: Issue Volume: the natural logarithm of the amount issued measured in reais;
Number of shares: natural logarithm of the number of shares issued; SDreturn: the standard deviation of the share returns during the month in analysis; Price: the offer price; Underpricing: the difference between closing price in the first trading day and the issue price divided by the issue price; Underwriter: underwriter reputation; Price Range: the difference between the maximum and minimum price in initial filling range divided by the midpoint of the filling range: Spread: gross spreads as percentage of the offer price; PE/VC: dummy that takes value one if the issuing firm had private equity or venture capital investors, and zero otherwise; Average allotment to foreign, institutional domestic and retail investors: average amount allocated to foreign, institutional domestic and retail investors normalized by the issue size; Market Volume: daily average of the volume traded in Bovespa in reais during the month in analysis; SD Market Volume: the standard deviation of the daily volume traded in Bovespa in reais during the month in analysis; Ibov Return: daily average return of Bovespa stock index (Ibovespa) during the month in analysis: SD Ibov Return: the standard deviation of Ibovespa returns during the month in analysis. Dummies of sector are used in all regressions. The estimators were calculated using the robust matrix of covariate. T-Statistic is reported in brackets. The constant was omitted. The sample consists of the 96 IPOs for which there was overallotment.
Number of
Transaction Month 2 Month 3 Month 4 Month 5 Month 6 Month 7
ASC -1238.8 3503.1*** 2133.9*** 1803.3** 1605.3 3419.3**
(0.56) (2.67) (2.78) (2.23) (1.27) (1.96)
Traded Volume
ASC 1541.2 88786.8* 40670.9** 47671.9* 56066.3 95518.2