ISSN 1546-9239
© 2010 Science Publications
Corresponding Author: H.J. Mahdi, Department of Pharmaceutical Technology, Faculty of Pharmacy, International Islamic University Malaysia, 25710 Kuantan, Pahang, Malaysia
Metabolic Fingerprinting of Three Malaysian Ginger (
Zingiber officinale
Roscoe)
Using Gas Chromatography-Mass Spectromertry
H.J. Mahdi, R. Andayani and Ishak
Department of Pharmaceutical Technology, Faculty of Pharmacy, International Islamic University Malaysia, 25710 Kuantan, Pahang, Malaysia
Abstract: Problem statement: There is a chemical variation among different ginger cultivars detected by previous studies including the volatile and non-volatile oleo-resins. In this study we try to determine whether these variations are related to a genetic factor rather than environmental or intrinsic factors.
Approach: A comprehensive metabolic fingerprinting from the leaves of three micro-propagated ginger cultivars Bukit Tinggi, Tanjung Sepat and Sabah was performed using a Gas Chromatography-Mass Spectrometry (GC-MS). Constituents of the ginger leaves were first extracted and then fractionated into methanolic and chloroform. The samples were subsequently methoximated and silylated prior to GC-MS analysis. Results: By applying this technique, we detected more than 300 compounds (polar and non-polar) in total originated from each ginger cultivar. Based on the GC-MS fragmentation, three different classes of metabolites were detected from the ginger cultivars, namely amino acids, carbohydrates and organic acids. A qualitative variation on the type of ginger metabolites was observed, albeit no marked different found in the level of the metabolites. Conclusion: Apparently the chemical variations among the three ginger cultivars were due to genetic effects since almost all other environmental and intrinsic factors were eliminated.
Key words: Ginger,metabolic fingerprinting, gas chromatography-mass spectrometry, derivatisation
INTRODUCTION
Ginger (Zingiber officinale Roscoe) is an important tropical horticultural plant, values all over the world as a spice and for its medicinal properties. Ginger belongs to the family Zingiberaceae, which contains about 1300 species in 50 genera, along with four other families is placed in the order Zingiberales which belong to class Monocotyledones (Berg, 1997). The plant is completely sterile (produce no seed) and only propagated by rhizomes (Berg, 1997; Rout et al., 1998). Members of the family have distributions in the tropics of South and South-Eastern Asia specially Indo-Malaysia (Simpson, 2006; Awang, 1992) and cultivated throughout the tropical and sub-tropical region, was among the first vegetative cultivated plants. The Chinese records showed ginger was cultivated in the Malacca region (Malaysia) in 1416 (Weiss, 2002). The Spanish introduced this spice into the new world, where it grew so successfully, that by 1547 (Levetin and McMahon, 2006). The underground rhizomes are the medicinally and culinary useful part of the plant (Syamkumar et al., 2003).
of using tissue cultured ginger plant for detection of chemical variation. Ma and Gang shown that there are no significant differences existed between conventional greenhouses grown versus in vitro propagation-derived ginger plants.
Metabolic fingerprinting: Metabolic fingerprinting appears to be the easiest approach to metabolome analysis which utilizes all detector readings for numerical analysis to unambiguously identify the specific metabolites represented in these experiments. In addition, metabolic fingerprints are applied for metabolic pattern comparison aimed at the discovery of experimental conditions which result in similar or identical metabolic responses. This approach is used in gene function analysis and has the potential to group genes with known function and orphan genes of unknown or hypothetical function into classes of similar or identical metabolic function. This type of metabolic pattern analysis appears to be especially promising when gene modifications result in ‘silent’ phenotypes (changing of the metabolic state in organisms, which do not show obvious visual or morphological traits) (Steinhauser and Kopka, 2007).
Measuring large numbers of compounds was developed within the last few years (Last et al., 2007). Hyphenated techniques that couple chromatography to mass spectrometry offer the greatest confidence in sample identification and quantification (Fiehn et al., 2000; Dunn, 2008). Since gas chromatography is only suitable for thermally stable non-polar compounds, while we want to do a comprehensive detection (as possible) of all metabolites, so that a chemical derivatisation is needed. Derivatisation is a chemical reaction of a sample that yields a product that is more volatile and stable and that has improved gas chromatography behavior over the original substances (Kitson et al., 1996). In most cases, derivatisation is performed to convert polar N-H, O-H and S-H groups into thermally stable, non-polar groups (Gullberg, 2005; Hübschmann, 2001). Metabolic fingerprinting, as one approach of metabolomic, is a comprehensive and high-throughput analysis of crude samples or sample extracts with minimal requirements for sample preparation (Dunn et al., 2005). Metabolic fingerprinting is suitable to use for sample classification (Halket et al., 2005) or sample screening which utilize all detector readings for numerical analysis (Fiehn, 2002). Metabolic fingerprinting analysis appears to be especially promising when gene modifications result in ‘silent’ phenotypes or silent mutation. Silent phenotypes are better defined as changes of the metabolic state in organisms, which do not show
obvious visual or morphological traits (Steinhauser and Kopka, 2007).
MATERIALS AND METHODS
In present study, we carried out a metabolic fingerprinting analysis for the leaves of micro-propagated ginger cultivars from Bukit Tinggi, Tanjung Sepat and Sabah in an attempt to detect chemical variations present among three ginger cultivars. The degree of correlation present among the ginger cultivars will be examined based on direct comparison of the ginger metabolites.
Plant materials: Nine-month old of ginger rhizomes cv. Bukit Tinggi, Tanjung Sepat and Sabah were obtained from there original plantation regions in Malaysia. A sterile young bud of ginger is used for initiating a stock culture of ginger plantlets grown in Murashige and Skoog (MS) media containing 3% (w/v) sucrose; 2 mg L−1 1-naphtalen acetic acid in combination with 2 mg L−1 kinetin as growth hormones and agar 0.08% (w/v). Ginger explants were sub-cultured monthly to eliminate any carryover affects of prior growth conditions (from the original source) on the chemical composition and to ensure that uniform growth conditions were applied equally to all plants. Three month old ginger explants were used in this experiment (Fig. 1).
Chemicals: Chloroform, methanol absolute, n-heptan (Fisher Scientific), sodium chloride, sucrose, sulphuric acid, sodium bicarbonate, anhydrous sodium sulphate, (Merck), methyl nonadecanoate, methoxyamine hydrochloride (O-methyl hydroxylamine HCl), N-methyl-N-(trimethyl-silyl) trifluoroacetamide (MSTFA) (Sigma-Aldrich) and pyridine (AnalaR).
Fig. 2: Picture of the GC-MS used in the study (Agilent Technologies 6890N network GC system)
Instruments: Mortar and pestle, Centrifuge (Rotofix 32, hettich Zentrifugen, Germany), Incubator shaker (INNOVA 4000, M1192, NEW BRUNSWICK SCIENTIFIC), Centrifuge evaporator (VR- maxi st. a.-1, Heto vacuum centrifuge, Heto-Holten A/s, Denmark), Incubator (precision incubator, BE 400, Memmert) and GC-MS system (Agilent Technologies 6890N network GC system) (Fig. 2).
Sample preparation: Sample preparation was done according to Jiang et al. (2006) method with a slight modification. For each ginger cultivar, three samples of explants (3 months old) were harvested; the leaves were cut and immediately immersed in to liquid nitrogen to stop any enzyme activity that may lead to change of chemical constituents. Subsequently, ginger leaves were grinded to fine powder while kept frozen under liquid nitrogen and homogenized. Then the plant samples were stored at -80°C freezer until further use (within 3 weeks).
Extraction of polar and non-polar metabolites: The extraction protocol was carried out according to Shepherd et al. (2007) with some modifications. Briefly, 500 mg of powdered frozen ginger leaves were weighed and immediately transferred to a glass culture tube (125×16 mm) containing 3 mL methanol. A non-polar internal standard 100 µL methanolic methyl nonadecanoate (0.2 mg mL−1) and 100 µL sucrose (2.5 mg mL−1) as a polar internal standard were added; shake vigorously on an incubator shaker for 30 min at 60°C. Distilled water (360 µL) was added and the sample was shaken for 30 min at 60°C, prior to addition of 6 mL of chloroform. The resulted mixture was further shaken for 60 min at 60°C. One and half milliliter distilled water was added and mixed
vigorously by hand and separated by centrifugation at a speed of 4000 rpm for 3 min. A polar methanolic fraction (upper layer) was separated from a non-polar chloroform fraction (lower layer) by pipette and transferred to 5 mL glass vial. Both fractions were either directly processing or alternatively were stored at -20°C until further use. Methanolic fractions could be stored immediately whereas chloroform fractions were first evaporated to dryness under nitrogen gas.
Derivatisation of methanolic fraction: Derivatisation of methanolic fraction was carried out according to Shepherd et al. (2007) with a slight modification.One milliliter of methanolic fraction was transferred into eppendorf tube and evaporated to dryness using a centrifuge evaporator. Subsequently, 40 µL of 20 mg mL−1 methoxyamine hydrochloride in anhydrous pyridine was added to the dry fraction and then the sample was incubated at 30°C for 90 min with continuous shaking. MSTFA (40 µL) was added and incubated at 37°C for 60 min. The derivatized sample (40 µL size) was diluted with 60 µL n-heptane and 1 µL sample was injected to GC-MS.
Derivatisation of chloroform fraction: For chloroform fraction, the protocol was carried out according to Shepherd et al. (2007) with a slight modification. Whole fraction was evaporated to dryness under dry pure nitrogen gas. Two milliliter of methanolic sulphuric acid (1% v/v) was added and incubated overnight at 50°C for trans-esterification. Five milliliters of sodium chloride (5% w/v) and 3 mL chloroform were added to the sample; the mixture was shaken and left to separate into two layers. The upper aqueous layer was discarded. To the lower chloroform layer add 3 mL of sodium bicarbonate (2% w/v), shake and leave to separate. The lower chloroform layer was removed, dried over anhydrous sodium sulphate and then evaporated to dryness using nitrogen gas. The dry fraction was solubilised in 50 µL chloroform and 10 µL pyridine. Silylation (derivatisation) was achieved with 80 µL MSTFA at 37°C for 60 min, after that, 40 µL of derivatized sample was taken, mixed with 60 µL n-Heptan and 1 µL sample was injected to GC-MS for analysis.
10°C min−1 rate till the end of analysis. The eluted analytes detected using (5973 network) mass selective detector and Electron Impact ionization (EID) will be carried out at 70 eV. Data were acquired using Enhanced ChemStation G1701CA version C00.0021, Agilent technology. The identity of compounds will be checked using the Wiley7n.1 spectra data base.
RESULTS
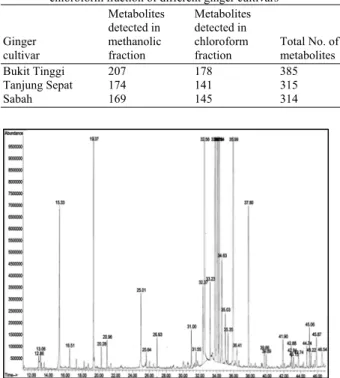
The main criteria for selection of suitable ions for an identification of compound should has a high peak area (>0.05%) and should be unique and/or be well resolved from other ions with the same mass to charge ratio (m/z) in the defined time window. Identification of the compounds indicated by the library search program as being more than 80% and viewed as being likely hits (Jiang et al., 2006). Compounds were identified by analysis of standards, comparison with wiley7n.1 database library. Spectra for each eluting compound were then compared manually to the data box and standard spectrum (NIST Chemistry WebBook) for the best hit to determine if the molecular ion peaks and the fragmentation patterns did in fact match. We found in total about 314-385 metabolites consisted of both polar and non polar compounds (Table 1) which was detected from the GC-MS metabolic fingerprinting of the leaves of three micro-propagated Bukit Tinggi, Tanjung Sepat and Sabah ginger cultivars.
Approximately 30% of the total number of peaks could be identified both in methanolic and chloroform fractions of Bukit Tinggi ginger cultivar, whereas, only about 24 and 25.7% of the total peaks were identified for Tanjung Sepat and Sabah ginger cultivars respectively. Furthermore, based on the GC-MS fragmentation, three different classes of metabolites were detected from the ginger cultivars, namely amino acids, carbohydrates and some organic acids.
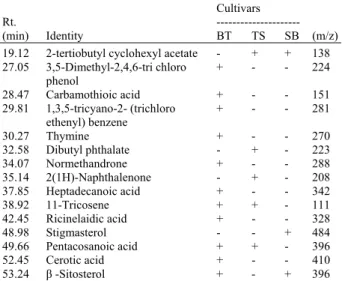
The GC-MS chromatogram of the methanolic fraction (Fig. 3-5) and the chloroform fraction (Fig. 6-8) of the three samples of ginger leaves extract showed qualitatively apparent differences in the type of metabolites (Table 2 and 3). The polar fraction of the BT ginger cultivar contained a remarkably high level of sugars compared to two other cultivars at the retention time window around 33-42 min. The TS ginger cultivar showed a relatively high content of amino acids rather than the SB and TS cultivars at the retention time windows from 19-29 min.
Table 1: Number of metabolites detected in methanolic and chloroform fraction of different ginger cultivars
Metabolites Metabolites
detected in detected in
Ginger methanolic chloroform Total No. of
cultivar fraction fraction metabolites
Bukit Tinggi 207 178 385
Tanjung Sepat 174 141 315
Sabah 169 145 314
Fig. 3: Total Ion Chromatogram (TIC) of MSTFA derivatized methanolic fraction of ginger (Z. officinale Roscoe) leaves of Bukit Tinggi cultivar employing GC-MS.
Fig. 4: Total Ion Chromatogram (TIC) of MSTFA derivatized methanolic fraction of ginger (Z. officinale Roscoe) leaves of Tanjung Sepat cultivar employing GC-MS.
Table 2: A qualitative comparison of the type of ginger metabolites in the methanolic fraction
Cultivars
Rt. ± SD --- (n = 3) (min) Identity BT TS SB (m/z) 19.70±0.04 l-Threonine - + + 248
20.00±0.05 Glycine - + + 276
21.68±0.05 L-Serine - + + 278 22.38±0.05 L-Threonine - + + 291 25.69±0.05 L-Aspartic acid - + + 232 27.98±0.08 Glutamic acid - + + 363 29.21±0.00 L-Asparagine - + - 231 31.66±0.04 Ribonic acid - + + 333
32.58±0.02 Sorbose + + - 437
Note: BT: Bukit Tinggi; TS: Tanjung Sepat; SB: Sabah; Rt: Retention time; (+): Refer to present of compounds; (-): Refer to absence of compounds
Table 3: A qualitative comparison of the level of ginger metabolites in the chloroform fraction
Cultivars
Rt. ---
(min) Identity BT TS SB (m/z)
19.12 2-tertiobutyl cyclohexyl acetate - + + 138 27.05 3,5-Dimethyl-2,4,6-tri chloro + - - 224 phenol
28.47 Carbamothioic acid + - - 151 29.81 1,3,5-tricyano-2- (trichloro + - - 281 ethenyl) benzene
30.27 Thymine + - - 270
32.58 Dibutyl phthalate - + - 223
34.07 Normethandrone + - - 288
35.14 2(1H)-Naphthalenone - + - 208 37.85 Heptadecanoic acid + - - 342
38.92 11-Tricosene + + - 111
42.45 Ricinelaidic acid + - - 328
48.98 Stigmasterol - - + 484
49.66 Pentacosanoic acid + + - 396
52.45 Cerotic acid + - - 410
53.24 β -Sitosterol + - + 396
Note: BT: Bukit Tinggi; TS: Tanjung Sepat; SB: Sabah; Rt: Retention time; (+): Refer to present of compounds; (-): Refer to absence of compounds
Fig. 5: Total Ion Chromatogram (TIC) of MSTFA derivatized methanolic fraction of ginger (Z. officinale Roscoe) leaves of Sabah cultivar employing GC-MS
Table 4: A quantitative comparison of the level of ginger metabolites in the methanolic fraction
Cultivars
Rt. ± Sd --- (n = 3) (min) Identity BT TS SB (m/z)
24.99±0.04 Malic acid 2 2 2 335
25.53±0.04 L-proline 1 1 2 258
33.19±0.04 β -D-galacto furanose 2 2 1 319
33.78±0.05 D-fructose 2 2 2 307
34.09±0.06 L-glucose 5 TMS 2 2 2 231 34.58±0.05 Glucose, oxime 1 1 1 319 35.31±0.04 α-D-glucopyranose 1 1 1 204
35.92±0.06 D-glucose 2 2 2 231
37.76±0.05 Myo-inositol 1 2 2 343
39.63±0.04 Glucose 1 1 1 231
41.87±0.04 D-manno-pyranose 1 1 1 219
Note: Rt: Retention time; BT: Bukit Tinggi; TS: Tanjung Sepat; SB: Sabah; (1): Indicates <0.5%; (2): Indicates 0.5-5%; of total integrated peak area of TIC of a particular sample
Fig. 6: Total Ion Chromatogram (TIC) of MSTFA derivatized chloroform fraction of ginger (Z. officinale Roscoe) leaves of Bukit Tinggi cultivar employing GC-MS
Table 5: A quantitative comparison of the level of ginger metabolites in chloroform fraction
Cultivars
Rt. ± Sd ---
(n = 3) (min) Identity BT TS SB (m/z) 15.01±0.011 Meta-cresol 1 1 1 180 23.25±0.011 α-Neoclovene 1 1 1 204 25.05±0.000 Lauric acid 1 1 1 214 27.59±0.000 Tau-Cadinol 1 1 1 204 28.06±0.006 α-Gurjunene 1 1 1 204 28.66±0.004 (Z) -3-(4-n-Buty 1 1 1 194
l-3- thienyl)
propenal
29.09±0.013 m-Xylene 1 1 1 297
29.60±0.009 Myristic acid 1 1 1 242 30.10±0.027 α-Hexylcinnamic 1 1 1 216 aldehyde
31.70±0.004 Pentadecanoic 1 1 1 256 acid
31.96±0.004 Neophytadiene 1 1 1 137 32.25±0.004 Tetradecanoic 1 1 1 285 acid
32.47±0.009 Neophytadiene 1 1 1 278 33.19±0.007 9-Hexadecenoic 1 1 1 236 acid
33.82±0.011 Palmitic acid 3 3 3 270 34.28±0.004 Cinnamic acid 1 1 1 265 35.64±0.004 Margaric acid 1 1 1 284 36.09±0.007 Palmitic acid, 2 2 2 328 TMS
37.08±0.024 Linoleic acid 3 3 3 294 37.20±0.022 Linolenic acid 3 3 3 236 37.51±0.013 Stearic acid 2 2 2 298 39.00±0.007 Linoleic acid 2 1 1 352 TMS
39.10±0.007 Oleic acid 2 2 2 354 39.56±0.004 Stearic acid 2 2 2 356 TMS
44.10±0.007 Behenic acid 2 1 1 354 45.64±0.004 Tricosanoic acid 1 1 1 368 47.28±0.004 Cholest-7-ene 1 1 1 399 47.43±0.000 Tetracosanoic 1 1 1 382 acid
Note: Rt: retention time; BT: Bukit Tinggi; TS: Tanjung Sepat; SB: Sabah; (1) Indicates <0.5%; (2): Indicates 0.5-5%; (3) Indicates >5% of total integrated peak area of TIC of a particular sample
Fig. 8: Total Ion Chromatogram (TIC) of MSTFA derivatized chloroform fraction of ginger (Z. officinale Roscoe) leaves of Sabah cultivar employing GC-MS
DISCUSSION
The low percent of identified peaks (24-30%) both in methanolic and chloroform fractions of the three ginger cultivars. It might be due to some reasons such as peak overlapping, a low level of analytes (∼0.05-1%) or simply, because no information is available so far in the spectra data base library.
A qualitative variation on the type of ginger metabolites was observed were some of metabolites were present in one but not in the other cultivars. In the other hand, a slightly difference in the level of metabolites were detected among the three ginger cultivars. It seems that these chemical variations have not caused by the geographical or environmental differences as micro-propagated ginger explants were used in this study. It could be due the genetic variations of the gingers. These results could not be attributed to the environmental factors since all these plants were grown under identical conditions, same composition of the culture media as well as same plants age.
Genes are differentially expressed under different environmental and intrinsic conditions such as nutrient availability (Oh et al., 2002). Variation in gene expression rate will lead to variation in metabolites concentration. Accordingly, when we eliminate all effective external factors we expect to get the same level of gene expression and consequently no quantitative differences will detect and the metabolites concentration do not show any significant variation among the cultivars.
CONCLUSION
The GC-MS metabolic fingerprinting analysis of derivatized ginger leaves extract reveals the presence of chemical variation among the three ginger cultivars. Bukit Tinggi ginger cultivar showed the highest number of detected metabolites. In the other hand, Tanjung Sepat and Sabah cultivars showed almost the same number of detected metabolites. No marked differences in the concentrations of detected compounds among the three ginger cultivars leaf samples. Some of the detected metabolites can be used as biochemical markers for the identification and differentiation between ginger cultivars. These results were at the level of metabolic fingerprinting. A more precise method for detection of components concentration like metabolic profiling of specific metabolites group or target metabolic analysis may be needed to confirm the results.
ACKNOWLEDGMENT
Also we would like to acknowledge and thanks all researchers and technicians who have contribute to this project.
REFERENCES
Awang, D.V.C., 1992. Ginger. Can. Pharm. J., 125: 309-311.
Barnes, J., L.A. Anderson and J.D. Phillipson, 2002. Herbal Medicines. 2nd Edn., Pharmaceutical Press, London Grayslake, IL., UK., pp: 243.
Berg, L.R., 1997. Introductory Botany: Plants, People and the Environment. Ft. Worth: Saunders College Pubication, pp: 466.
Chevallier, A.C., 2001. Encyclopaedia of Medicinal Plants. 2nd Edn., Dorling Kindersley, London, pp: 336. Dunn, W.B., 2008. Current trends and future
requirements or the mass investigation of microbial, mammalian and plant metabolomes.
Phys. Biol., 5: 24. stacks.iop.org/physBiol/5/011001
Dunn, W.B., N.J.C. Baileyb and H.E. Johnsonc, 2005. Measuring the metabolome: Current analytical technologies. Analyst, 130: 606-625. www.rsc.org/analyst
Fiehn, O., 20002. Metabolomics the link between genotypes and phenotypes. Plant Mol. Biol., 48: 155-171.
Fiehn, O., J. Kopka, P. Dörmann, T. Altmann and R.N. Trethewey et al., 2000. Metabolite profiling for plant functional genomics. Nature Biotechnol., 18: 1157-1161.
Garner-Wizard, M., S.H.B. Milot, E.J. Neustadt, H.S. Oliff and M. Oppel et al., 2006. Ginger, an herbal medicinal product with broad anti-inflammatory actions. J. Med. Food, 8: 125-132. Gullberg, J., 2005. Metabolomics: A tool for studying
plant biology. Doctoral Thesis, Department of Forest Genetics and Plant Physiology, Faculty of Forest Science, Umeå, Sweden. http://dissepsilon.slu.se/archive/00000916/01/Jonas _Gullberg
Halket, J.M., D. Waterman, A.M. Przyborowska, R.K.P. Patel and P.D. Fraser et al., 2005. Making sense of the metabolome: Chemical derivatization and mass spectral libraries in metabolic profiling by GC/MS and LC/MS/MS. J. Exp. Bot., 56: 219-243. http://www.naturaldatabase.com
Hübschmann, H.J., 2001. Handbook of GC/MS: Fundamentals and Applications. John Wiley and Sons, New York, ISBN: 10: 3527301704, pp: 591.
Jiang, H., Z. Xie, H.J. Koo, S.P. McLaughlin and B.N. Timmermann, 2006. Metabolic profiling and phylogenetic analysis of medicinal Zingiber species: Tools for authentication of ginger (Zingiber officinale Rosc.). Phytochemistry, 67: 1673-1685.
Kitson, F.G., B.S. Larsen and C.N. McEwen, 1996. Gas Chromatography and Mass Spectrometry: A Practical Guide. Academic Press, San Diego. Last, R.L., A.D. Jones and Y. Shachar-Hill, 2007.
Towards the plant metabolome and beyond. Nat. Rev. Mol. Cell Bio., 8: 167-174.
Levetin, E. and K. McMahon, 2006. Plants and Society. 4th Edn., McGraw- Hill Higher Education, Boston, pp: 524.
Ma, X. and D.R. Gang, 2006. Metabolic profiling of in vitro micro-propagated and conventionally greenhouse grown ginger (Zingiber officinale). Phytochemistry, 67: 2239-2255.
Oh, M.K., L. Rohlin, K.C. Kao and J.C. Liao, 2002. Global expression profiling of acetate-grown Escherichia coli. J. Biol. Chem., 277: 1375-1383. Ravindran, P.N. and K.N. Babu, 2004. Ginger: The
Genus Zingiber. CRC Press, Boca Raton, pp: 576. Robbers, J.E., M.K. Speedie and V.E. Tyler, 1996.
Pharmacognosy and Pharmaco-Biotechnology. 1st Edn., Williams and Wilkins, USA., pp: 337. Rout, G.R., P. Das, S. Goel and S.N. Raina, 1998.
Determination of genetic stability of micro-propagated plants of ginger using Random Amplified Polymorphic DNA (RAPD) markers. Botanical Bull. Acad. Sinica, 39: 23-37.
Shepherd, T., G. Dobson, S.R. Verrall, S. Conner and D.W. Griffiths et al., 2007. Potato metabolomics by GC-MS: What are the limiting factors. Metabolomics, 3: 475-488.
Simpson, M.G., 2006. Plants Systematic, 1st Edn., Elsevier, Academic Press, Amsterdam, ISBN: 10: 0126444609. pp: 590.
Steinhauser, D. and J. Kopka, 2007. Methods, Applications and Concepts of Metabolite Profiling: Primary Metabolism. In: Plant Systems Biology, Fernie, A.R. and S. Baginsky (Eds.). Birkhäuser Verlag, Switzerland, pp: 171-194.
Sweetman, S.C., 2007. Martindale: The Complete Drug Reference. 35th Edn., Pharmaceutical Press, Chicago, London, ISBN: 10: 0853697043, pp: 3322. Syamkumar, S., B. Lowarence and B. Sasikumar, 2003. Isolation and amplification of DNA from rhizomes of turmeric and ginger. Plant Mol. Biol. Rep., 21: 171-171. Weiss, E.A., 2002. Spice Crop, 1st Edn., CABI