© Author(s) 2010. CC Attribution 3.0 License.
and Physics
An overview of the Amazonian Aerosol Characterization
Experiment 2008 (AMAZE-08)
S. T. Martin1, M. O. Andreae2, D. Althausen3, P. Artaxo4, H. Baars3, S. Borrmann2, Q. Chen1, D. K. Farmer5, A. Guenther6, S. S. Gunthe2, J. L. Jimenez5, T. Karl6, K. Longo7, A. Manzi8, T. M ¨uller3, T. Pauliquevis9,*, M. D. Petters10, A. J. Prenni11, U. P¨oschl2, L. V. Rizzo4, J. Schneider2, J. N. Smith6, E. Swietlicki12, J. Tota8, J. Wang13, A. Wiedensohler3, and S. R. Zorn2
1School of Engineering and Applied Sciences and Department of Earth and Planetary Sciences, Harvard University,
Cambridge, Massachusetts, USA
2Max Planck Institute for Chemistry, Mainz, Germany
3Leibniz Institute for Tropospheric Research, Leipzig, Germany 4Institute of Physics, University of S˜ao Paulo, Brazil
5Department of Chemistry and Biochemistry and Cooperative Institute for Research in the Environmental Sciences,
University of Colorado, Boulder, Colorado, USA
6NCAR Earth System Laboratory, National Center for Atmospheric Research, Boulder, Colorado, USA 7Center of Weather Forecast and Climatic Studies (CPTEC-INPE), Cachoeira Paulista, S˜ao Paulo, Brazil 8National Institute of Amazonian Research (INPA), Manaus, Brazil
9Institute of Astronomy, Geophysics and Atmospheric Science, University of S˜ao Paulo, Brazil
10Department of Marine, Earth, and Atmospheric Sciences, North Carolina State University, Raleigh, North Carolina, USA 11Department of Atmospheric Science, Colorado State University, Fort Collins, Colorado, USA
12Department of Physics, Lund University, Lund, Sweden
13Department of Earth and Atmospheric Sciences, University of Nebraska, Lincoln, Nebraska, USA
*now at: Earth and Natural Sciences Department, Federal University of Sao Paulo at Diadema, Diadema, Brazil
Received: 4 June 2010 – Published in Atmos. Chem. Phys. Discuss.: 30 July 2010
Revised: 2 November 2010 – Accepted: 17 November 2010 – Published: 2 December 2010
Abstract. The Amazon Basin provides an excellent envi-ronment for studying the sources, transformations, and prop-erties of natural aerosol particles and the resulting links be-tween biological processes and climate. With this framework in mind, the Amazonian Aerosol Characterization Experi-ment (AMAZE-08), carried out from 7 February to 14 March 2008 during the wet season in the central Amazon Basin, sought to understand the formation, transformations, and cloud-forming properties of fine- and coarse-mode biogenic aerosol particles, especially as related to their effects on cloud activation and regional climate. Special foci included (1) the production mechanisms of secondary organic com-ponents at a pristine continental site, including the factors regulating their temporal variability, and (2) predicting and understanding the cloud-forming properties of biogenic par-ticles at such a site. In this overview paper, the field site and the instrumentation employed during the campaign are intro-duced. Observations and findings are reported, including the
Correspondence to:S. T. Martin (scot [email protected])
1 Introduction
The Amazon Basin is a highly favorable environment for studying the sources, transformations, and properties of bio-genic aerosol particles (Andreae et al., 2002; Martin et al., 2010). In contrast, advection in the widely polluted north-ern midlatitudes of North America, Europe, and Asia mixes together anthropogenic and natural components of parti-cles. Amazonian studies can potentially isolate natural pro-cesses and, in doing so, can provide a baseline understanding against which anthropogenic effects on atmospheric aerosol sources and properties can be understood (Andreae, 2007). This kind of understanding is relevant not only to the North-ern Hemisphere of today but also to the Amazon Basin of the future under several possible development scenarios. Fo-cused on these possibilities, the Amazonian Aerosol Char-acterization Experiment (AMAZE-08) was carried out in the wet season of 2008.
A summary of the sources of Amazonian aerosol parti-cles and important influences on their atmospheric lifetimes and aging processes can be found in the review of Mar-tin et al. (2010). A short introduction is provided herein, as follows. In-Basin natural processes include emissions both of primary biological aerosol particles (PBAPs) and of gaseous sulfur, nitrogen, and carbon species from the ecosystem, oxidation of the gaseous species not just in the atmospheric gas phase but also in cloud water to produce low-volatility particle-phase products (i.e., secondary par-ticle components), and removal of gases and parpar-ticles by wet and dry deposition. The strongest anthropogenic influ-ence inside the Basin is biomass burning, which is especially prevalent in the dry season and in the southern part of the Basin during that time (i.e., outside of both the temporal and geographic scope of AMAZE-08). Influences originating out of the Basin and advecting into it include marine particles from the Atlantic Ocean, dust and biomass burning in Africa, and gaseous species from both regions that can be converted within the Basin into secondary components of particles. The particles from African sources arrive in the Basin sporadi-cally as events and are more common in the austral summer than winter. The biomass-burning emissions from Africa can be regarded largely as an anthropogenic component.
The scientific objective of AMAZE-08 was to understand the formation, transformations, and cloud-forming proper-ties of fine- and coarse-mode biogenic natural aerosol par-ticles, especially as related to their effects on cloud acti-vation and regional climate. Special foci included (1) the production mechanisms of secondary organic components at a pristine continental site, including the factors regulating their temporal variability, and (2) predicting and understand-ing the cloud-formunderstand-ing properties of biogenic particles at such a site. These foci can be broadly described as an investiga-tion on the link between biological processes and climate, as mediated by atmospheric chemistry (Barth et al., 2005; Keller et al., 2009).
The worldwide production mechanisms of secondary or-ganic components from the oxidation of volatile oror-ganic compounds (VOCs) have received considerable attention in the literature during the past few years (Chung and Sein-feld, 2002; Tsigaridis and Kanakidou, 2003; Tsigaridis et al., 2005; Henze and Seinfeld, 2006; Tsigaridis and Kanakidou, 2007; Heald et al., 2008). There has been significant uncer-tainty regarding the contribution by primary organic emis-sions, compared to in situ photochemical production of sec-ondary organic aerosol (SOA), to the mass concentration of organic particle material in urban areas, ranging from 80% primary in the study of Pandis et al. (1992) to 35% pri-mary in the studies of Zhang et al. (2005) and Volkamer et al. (2006, 2007). Attribution between anthropogenic and biogenic secondary organic material remains uncertain (Mil-let et al., 2006). Volkamer et al. (2006) and de Gouw and Jimenez (2009) emphasize that previous conclusions from global models may vastly underestimate the anthropogenic contribution. There are missing sources of SOA produc-tion in polluted anthropogenic regions (de Gouw et al., 2005; Takegawa et al., 2006; Volkamer et al., 2006) and also in the free troposphere (Heald et al., 2005), as implied by obser-vations of excess organic mass concentrations compared to best-model predictions. Carbon-14 dating of secondary or-ganic material in areas heavily influenced by anthropogenic sources implies a high biogenic fraction and thus an impor-tant role of biogenic species (Klinedinst and Currie, 1999; Szidat et al., 2004). In contrast, models for these conditions predict that the quantities of SOA material produced from biogenic sources should be small. The implication of the dis-crepancy between observations and models is that synergis-tic biogenic-anthropogenic interactions exist that are not well understood at present (de Gouw et al., 2005). These several observations, among others, have highlighted the need for a more thorough understanding of SOA production (Gold-stein and Galbally, 2007; Kroll and Seinfeld, 2008; Carlton et al., 2009; Hallquist et al., 2009).
The Amazon in the wet season represents a pristine envi-ronment having nearly pure biogenic aerosol particles (Ar-taxo et al., 1990; Gerab et al., 1998; Andreae et al., 2002; Claeys et al., 2004; Andreae, 2007; Martin et al., 2010), mak-ing it an ideal laboratory to isolate natural SOA production and thereby provide a baseline understanding against which to measure anthropogenic influences. The Amazon Basin is the region of highest VOC emissions globally (Guenther et al., 1995; Kesselmeier et al., 2009; Vrekoussis et al., 2009). Moreover, the high solar flux and large biogenic emissions lead to a large source of OH radicals (Lelieveld et al., 2008). As a result, SOA production in the gas phase is initiated dom-inantly by OH radicals. Ozone concentrations (5 to 20 ppb) are relatively low in Amazonia, and O3-initiated SOA
tors influencing the relative importance of gas- and aqueous-phase pathways for SOA production remain to be well delin-eated, especially for the environmental parameters prevalent in the Amazon Basin.
Predicting and understanding the cloud-forming proper-ties of atmospheric particles, especially for particles having high organic fractions, is essential for accurate predictions of convection dynamics, precipitation, and energy fluxes and their integration with climate at all scales. The pristine con-ditions of the wet season of the Amazon Basin, in which the organic volume fractions of particles approach 90% (Fuzzi et al., 2007), represent an excellent opportunity for the develop-ment of this understanding. Both the developdevelop-ment of warm clouds by activation of cloud condensation nuclei (CCN) and of cold clouds by activation of ice nuclei (IN) are important. Prior to AMAZE-08, ice nuclei had never before been stud-ied in Amazonia, and studies of the IN properties of organic particles in other parts of the globe have been hampered by the difficulty of disentangling the contribution of organic ma-terial from that of sulfate and dust, which have been mixed together. For this reason, measurements in the Amazon in the wet season are particularly important for the isolation of the IN properties of organic particles.
Roberts et al. (2001, 2002, 2003), Rissler et al. (2004), and Mircea et al. (2005) measured CCN number concentrations in the Amazon Basin during the wet season. Those studies, however, did not investigate the dependence of CCN activity on the particle size, including their possible temporal varia-tion. The construction of accurate microphysical models of cloud formation, precipitation, and energy fluxes is not pos-sible without information on the size-dependent CCN activ-ity. More advanced models linked to variable chemistry also cannot be developed without measurements on how particle chemistry potentially changes during the day and with size (i.e., from the condensation of secondary organic products as well as possible heterogeneous aging reactions such as by OH radical).
In this overview paper of AMAZE-08 (7 February to 14 March 2008), the field site and the instrumentation employed during the campaign are introduced (Sect. 2). Observations and findings are reported, including the large-scale context for the campaign (especially as provided by satellite obser-vations) (Sect. 3), a summary of AMAZE-08 publications available to date (Sect. 3.1), and five sections with new re-sults not published elsewhere (Sects. 3.2.1–3.2.5). The top-ics of these sections are selected to provide a perspective on the results from AMAZE-08 regarding the formation, the transformations, and the cloud-forming properties of bio-genic natural aerosol particles, especially as related to their effects on cloud activation and regional climate.
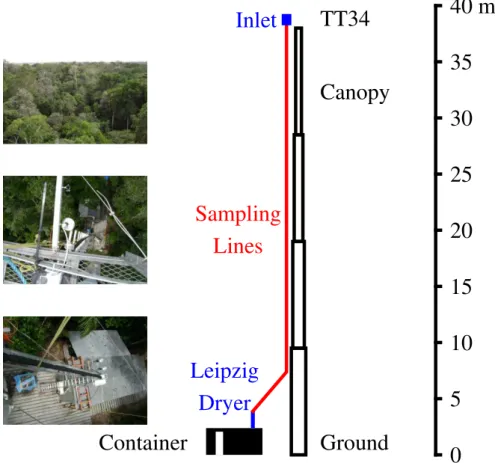
The principal measurement site of AMAZE-08 was tower TT34 (02◦35.657′S, 060◦12.557′W, 110 m a.s.l.) (Fig. 1). It was located in the central Amazon Basin, 60 km NNW of downtown Manaus and 40 km from the metropolis mar-gins. The site, accessed by a 34-km unpaved road, was within a pristine terra firme rainforest in the Reserva Biol´ogica do Cuieiras and managed by the Instituto Nacional de Pesquisas da Amazonia (INPA) and the Large-Scale Biosphere-Atmosphere Experiment in Amazonia (LBA). The base of tower TT34 was on a ridge, and the scale of hill-valley relief near the tower was ca. 50 m. The forest canopy height near the tower varied between 30 and 35 m. Housing for the researchers and a 60 kW diesel generator for power supply were located 0.33 km and 0.72 km downwind of TT34, respectively. The generator was separated from TT34 by a 50-m deep valley, with the researcher housing at the bottom of the valley.
Climatological and meteorological information for this region of the Amazon Basin is provided by Andreae et al. (2002) and Araujo et al. (2002). The rainfall during AMAZE-08 was consistent with the typical monthly values of the wet season (Fig. S1). The meteorological statistics recorded at the top of the tower during AMAZE-08 were 23 to 27◦C (quartiles of distribution) and 80 to 99% RH in the daytime; the nighttime statistics were 22 to 24◦C and 96 to 100% RH. The quartiles of pressure were 9.9 to 10×105Pa. The recommendation was to normalize AMAZE-08 data sets to standard temperature and pressure (0◦C, 105Pa, dry air). Normalization facilitated quantitative comparisons among AMAZE-08 data sets, as well as with data sets of earlier and future measurement campaigns.
In addition to TT34, there were three auxiliary sites. Tower K34 (2◦36.545′S, 60◦12.558′W, and 130 m a.s.l.; 1.6 km from TT34; 54 m height) housed several instru-ments directly at its top level (Ahlm et al., 2009). Site K23 (2◦38.307′S, 60◦9.430′W, and 108 m a.s.l.; 7.56 km from TT34) was used for tethered balloon soundings up to 800 m. A light detection and ranging instrument (LIDAR) and one site of the Aerosol Robotic Network (AERONET) were located 19.1 km from TT34 at the Silvicultura site (02◦35.913′S, 060◦02.240′W) (Althausen et al., 2009; Ans-mann et al., 2009).
At TT34, air was entrained into three inlets fixed at 38.75 m to the top of the tower. The air was brought by sampling lines to a ground-level container (2.2×5.9×2.5 m3) (Fig. S2). The inlet for gases consisted of an inverted funnel having an insect screen across it. The inlet for turbulent-flow aerosol sampling was a screen-covered open tube that was placed very close to a sonic anemometer and positioned in the direction of predominant wind flow. An inlet with an aerodynamic cutoff nominally of PM10but actually of PM7
TT34
Ground
Container
Sampling
Lines
Leipzig
Dryer
Inlet
Canopy
0
5
10
15
20
25
30
35
40 m
Fig. 1.Diagram of four-section telescopic tower (TT34), showing positions of inlet, canopy, sampling lines, dryer, and instrument container. Inset photos are shown larger in Fig. S2.
the container included a 6.4-mm (1/4′′OD) Teflon line for gas sampling, a 12.7-mm (1/2′′OD; 10.9 mm ID) stainless steel line for turbulent-flow aerosol sampling, and a 19-mm (3/4′′OD; 17.3 mm ID) stainless steel line for laminar-flow aerosol sampling. From the sampling height to the container, the three lines were wrapped together and encased by sec-tions of heating tape and insulation. Feedback control was used to maintain the temperature at 30±1◦C to avoid water condensation in the sampling lines.
Most of the particle instrumentation in the container sam-pled from the laminar line (Table 1). For the dimensions and flow of the laminar sampling line, the Reynolds number var-ied from 1200 to 2000 during the period of measurements. The calculated diffusional and gravitational deposition losses for a particle of dynamic shape factor of 1 and a den-sity of 1000 kg m−3 indicate 50% transmission cutoffs of
4 nm and 10.5 µm through the sampling lines, with increased transmission between those sizes (www.seas.harvard.edu/ AerosolCalculator). A Reynolds number of 2000 approaches the turbulent regime, and in this case the calculated 50% transmission cutoffs shift to 13 nm and 3.5 µm for losses by gravitational settling, diffusional impaction, and inertial de-position. The upper limit of the aerodynamic cutoff was
T
.
Martin
et
al.:
An
o
v
ervie
w
of
the
AMAZE-08
Location
TT34 K34 Silvicultura
Instrument Organization start stop line start stop start stop Flow (Lpm) Characteristic Time (s) Diameter Range (µm) Measured Quantity TEOM PM-2.5 tapered element CPTEC 17 Feb 14 Mar ground n/a 300 <2.5 particle mass concentration
oscillating microbalance for particulate matter under 2.5 µm
TEOM PM-10 tapered element CPTEC 17 Feb 14 Mar ground n/a 300 <10 particle mass concentration oscillating microbalance
for particulate matter under 10 µm
CO carbon monoxide CPTEC 17 Feb 14 Mar gas n/a 300 n/a
NO, NO2 oxides of nitrogen CPTEC 17 Feb 14 Mar gas n/a 300 n/a
O3 ozone CPTEC 17 Feb 14 Mar gas n/a 300 n/a
CO2 carbon dioxide CPTEC 17 Feb 14 Mar gas n/a 300 n/a
CFDC continuous-flow CSU 7 Feb 8 Mar laminar 1.5 btw 10 and 60 min <1.5 ice nuclei activity of particles diffusion chamber
(ice nuclei)
HR-ToF-AMS high-resolution Harvard-CU 7 Feb 14 Mar turbulent 0.1 150 0.06–0.8 size-resolved mass concentrations of
time-of-flight Aerodyne particle-phase organic, sulfate, nitrate,
Aerosol Mass Spectrometer ammonium, and chloride; aerodynamic particle
(AMS) size distribution; high-resolution mass
spectra of particles
F-HR-ToF-AMS Eddy covariance flux CU-Harvard 7 Feb 14 Mar turbulent As above As above As above chemically resolved fluxes of submicron
mode of the HR-ToF-AMS non-refractory chemical components (including
and sonic anemometer organic, sulfate, nitrate, chloride, ammonium)
and flux mass spectra
MAAP multiangle absorption IfT 18 Feb → laminar 5 60 n/a light absorption at 673 nm
photometer of deposited particles
LIDAR light detection and IfT ← → n/a n/a vertical profiles of backscatter and extinction
ranging coefficient at different wavelengths
PAR photosynthetically active INPA ← → n/a n/a n/a
radiation
pyranometer INPA ← → n/a n/a n/a downward and upward radiation fluxes
meteorological data INPA ← → ← → n/a n/a n/a wind speed and direction; rainfall amount;
on site relative humidity; temperature
SMPS scanning mobility Lund 21 Feb → laminar 1 300 0.01–0.5 number-size distribution of particles
particle sizer
HR-ToF-AMS high-resolution MPI-PC 7 Feb 14 Mar laminar 0.1 150 0.08–0.8 as above for other HR-TOF-AMS;
time-of-flight Aerodyne inlet was modified from
Aerosol Mass Spectrometer standard version
TD thermodenuder NCAR 28 Feb → laminar 0.6 n/a n/a particle volatility
CPC condensation particle MPI-PC 7 Feb 14 Mar laminar 1 1 >0.01 particle number concentration
counter
DMA CCNC/CPC differential mobility analyzer MPI-BG 14 Feb 14 Mar laminar 1 10000 0.03–0.3 size-resolved CCN activity
with CCNC & CPC of particles
UV-APS ultraviolet aerosol MPI-BG 7 Feb 14 Mar laminar 5 300 0.5–10 number-size distribution of coarse-mode
particle sizer particles, including identification
of the biological fraction
SEM scanning electron MPI-BG 15 Feb 14 Mar laminar 1 2000 n/a particle images
microscopy of filter samples
OPC laser-source optical MPI-PC 7 Feb 14 Mar laminar 1.2 6 0.3–20 number-size distribution of particles particle counter
Grimm 1.108
OPC white-light optical MPI-PC 7 Feb 14 Mar laminar 5 60 0.2–10 number-size distribution of particles particle counter
WELAS
gas adsorption NCAR 28 Feb 14 Mar n/a 0.2 1800 n/a analyzed by thermal desorption
gas-cartridges chromatography mass spectrometry
.atmos-chem-ph
ys.net/10/1
1415/2010/
Atmos.
Chem.
Ph
ys.,
10,
11415–
T able 1. Continued. Location TT34 K34 Silvicultura Instrument Or g anization start stop line start stop start stop Flo w (Lpm) Characteristic T ime (s) Diameter Range (µm) Measured Quan tity oxides of nitrogen NCAR 8 Feb 27 Feb top n/a 120 n/a ozone NCAR 8 Feb 27 Feb top n/a 300 n/a PTR-MS p roton-transfer -reaction NCAR 8 Feb 27 Feb top n/a 300 n/a speciation and concentration of v olatile mass spectrometer or g anic carbon compounds aethalometer USP 10 Feb → laminar 5 3600 n/a light absorption of deposited particles at multiple w av elengths CCNC cloud condensation USP 10 Feb → laminar 1 300 n/a inte grated CCN number concentration s nucleus counter fine & coarse filters USP 10 Feb → 10 m n/a days n/a anion and cation analysis by ion total filter USP 10 Feb → 10 m n/a days all chromatograph y; metals analysis by PIXE; total or g anic carbon analysis nephelometer USP 10 Feb → 10 300 all scattering coef ficient at multiple w av elengths sun photometer (AER ONET) USP 27 Feb → n/a n/a n/a Or g anization abbre viations: Center of W eather F orecast and Climatic Studies (CPTEC), Colorado State Uni v ersity (CSU), Uni v ersity of Colorado (CU), Leibniz Institute for T ropospheric Research (IfT), National Insti tute of Amazoni an Research (INP A), Lund Uni v ersity (Lund), Max Planck Institute for C hemistry – P article Chemistry (MPIC-PC), Max Planck Institute for Chemistry – Biogeochemistry (MPIC-BG), National Center for Atmospheric Research (NCAR), and Uni v ersity of S ˜ao P aulo (USP).
Mar 12 Mar 13 Mar 14
0 500 1000 1500 2000
TimeUTC
Concentration cm 3 TT34 container K34 tower
18:00 00:00 06:00 12:00
0 500 1000 1500 2000
TimeUTC
Concentration cm 3
Mar 89
Figure 2
Fig. 2.Particle number concentrations recorded inside the container at the bottom of tower TT34 and contemporaneously at the top of tower K34, which was located 1.6 km from TT34. (The excursions above 500 cm−3represented as abrupt spikes are tagged as pollu-tion events in Fig. S4. These spikes are believed to arise when the omnipresent regional plume from Manaus, which is generally west-ward, veers to the north and intersects the AMAZE-08 site. The similar magnitude of the spikes at TT34 and K34 supports that the inlet and sampling on both towers did not introduce bias into the measurements of the total particle number concentration).
the dryer on top of the container was consistently several de-grees warmer than inside the container. The RH therefore increased by up to 20% in the distribution lines inside the container prior to sampling by instruments. The set point of the air-conditioning inside the container was 23◦C, although the temperature was warmer by 3◦C or more near some of the instruments.
00:00 06:00 12:00 18:00 00:00 20
25 30 35 40
TimeHUTCL
Relative
Humidity
H
%
L
Feb 14
Figure 3
Fig. 3.Relative humidity in the laminar-flow aerosol sampling line using the dryer described by Tuch et al. (2009). The dryer con-sists of two diffusion dryers (silica gel), and the aerosol flow is di-verted into one dryer while the second one is regenerated. When the threshold RH for regeneration is reached, the aerosol flow is di-verted to that dryer. The method of regeneration is a dry-air flow obtained from a compressor.
corresponding diffusional, gravitational, and inertial deposi-tion losses suggest 50% transmission cutoffs of 17 nm and 3.1 µm, with 100% transmission between these cutpoints. The line for gas sampling entered the container without in-terception. For some gas measurements, additional sampling lines were temporarily placed at various heights along the tower (Karl et al., 2009).
The instruments housed inside the container and the sam-pling line used by each instrument are listed in Table 1. The subset of instruments related to Sect. 3.2 “New Results” include: a condensation particle counter (CPC, TSI model 3010); a scanning mobility particle sizer (Lund SMPS de-scribed by Svenningsson et al., 2008); an optical particle counter (OPC, Grimm model 1.108); an ultraviolet aero-dynamic particle sizer (UV-APS, TSI model 3314; Huff-man et al., 2010); the LIDAR instrument discussed previ-ously; two high-resolution time-of-flight Aerodyne Aerosol Mass Spectrometers (HR-ToF-AMS) (DeCarlo et al., 2006), one belonging to Harvard University Environmental Chem-istry Laboratory and equipped with a standard inlet (Liu et al., 2007) and the other belonging to the Max Plank In-stitute – Particle Chemistry (MPI-PC) group and equipped with a novel inlet shifted to favor larger diameter particles; a thermodenuder as described in Wehner et al. (2002); and a continuous-flow diffusion chamber for measurements of ice nuclei (Rogers et al., 2001).
3 Observations and findings
Back-trajectory analyses and satellite observations covering the trajectory paths during the period of AMAZE-08 pro-vide large-scale information concerning both the sources of
-80 -60 -40 -20 0 20
-30 -10 10 30
Longitude
Latitude
0 50 100 150 200 250
0 2000 4000 6000
Backward TimeHhrL
Height
H
m
L
0 50 100 150 200 250
0 2000 4000 6000
Backward TimeHhrL
Height
H
m
L
Figure 4
Fig. 4. Ten-day HYSPLIT backtrajectories at 200 m (red) and
3000 m (blue) during AMAZE-08. Each point along a trajectory represents a 12-h step. The green point marks the location of tower TT34.
particles and the transformations of particle components. The backtrajectories arriving at the site at 200 and 3000 m above ground level are shown every 12 h from 7 February to 14 March 2008 in Fig. 4 (Draxler and Hess, 1998) (see Fig. S3 for 500, 1000, 2000, and 4000 m). The figure shows that the synoptic-scale trade winds came predominantly and consistently from the northeast, travelling across the Atlantic Ocean and then over 1600 km of nearly pristine forest be-fore arrival at the research site. The low-altitude flow was from the northeast, changing to easterlies at mid-altitude. Local wind measurements at the top of the research tower confirmed that the daytime winds were dominantly from the north and northeast (Fig. 5). At nighttime, the winds stag-nated at times and could come from any direction.
HaLDaytime
N
NE
E
SE
S SW
W NW
0.1 0.2
0.3 N
NE
E
SE
S SW
W NW
0.1 0.2
0.3 N
NE
E
SE
S SW
W NW
0.1 0.2
0.3 N
NE
E
SE
S SW
W NW
0.1 0.2
0.3
HbLNighttime
N
NE
E
SE
S SW
W NW
0.1 0.2
0.3 N
NE
E
SE
S SW
W NW
0.1 0.2
0.3 N
NE
E
SE
S SW
W NW
0.1 0.2
0.3 N
NE
E
SE
S SW
W NW
0.1 0.2
0.3
0-1 1-2 2-3 >3 m s-1
Figure 5
Fig. 5. Daytime and nighttime wind roses measured at the top of tower TT34 during AMAZE-08. The concentric circles represent the fractional frequency of winds from different sector directions. Within each sector, the color coding of radial distance indicates the relative frequencies of the wind speeds.
with a Lagrangian parcel model is a strong simplification of the complexities of atmospheric movement. Vertical ex-change and cloud processing take place along the path of transport and modify concentrations and properties of air-mass tracers. Nevertheless, the consistency of the trajectories
from day to day and the weak vertical shear in the lower 3–5 km of trade winds both suggest that the representation in Fig. 4 is a reasonable first-order description of airmass transport. In the particular situation of AMAZE-08, there is strong observational support for the validity of this approach. Ben-Ami et al. (2010) documented the transport of dust and smoke across the Atlantic Ocean along the path suggested by the trajectories in Fig. 4 by using a combination of remote sensing and surface observations.
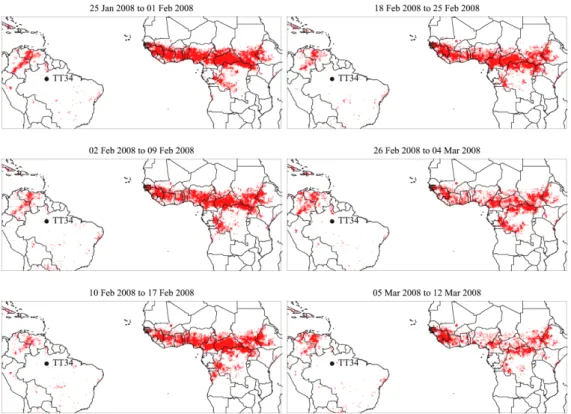
An implication of the backtrajectories shown in Fig. 4 is that, in addition to in-Basin sources and transformations, the particles of the Amazon Basin during AMAZE-08 were also affected at times by soil dust transport from northern Africa and biomass burning in equatorial Africa. Satellite obser-vations support this possibility and further indicate that the long-range transport of material from Africa to the research site was episodic during AMAZE-08 (Ben-Ami et al., 2010). Comparison of the ten-day backtrajectories and satellite-based MODIS fire counts (Figs. 4 and 6) suggests that ad-vection of biomass-burning products from Africa may have occurred. LIDAR measurements record a large plume of dust and smoke over Cape Verde on 3 February 2008 that ar-rives one week later at the research site in the Amazon Basin (Ansmann et al., 2009). Particle optical depth recorded by MODIS on the AQUA satellite during the period of AMAZE-08 is also supportive of the possibility of long-range transport of biomass-burning products (Fig. 7). In contrast, an influ-ence of regional biomass burning appears less plausible be-cause of the absence of fires along the in-Basin trajectories (Fig. 8). The absence of markers of fresh biomass burning both in the particle-phase mass spectra (e.g., elevated signal intensity atm/z60 and 73) and in the gas-phase mass spec-tra (e.g., the benzene:acetonitrile ratio) further confirms this conclusion (Chen et al., 2009; Karl et al., 2009).
Elevated African dust emissions occurred several times during the period of AMAZE-08, as apparent in the MODIS observations of Fig. 7. Based on the backtrajectories during these times, a portion of these emissions may have reached the research site approximately one week later. Simulations using the global chemical transport model “GEOS-Chem” for the AMAZE-08 time period, as well as measurements of fine-mode dust concentrations at the research site, sug-gest several significant events (>0.5 µg m−3) of African dust
transport to the research site compared to background con-centrations (<0.2 µg m−3) (Prenni et al., 2009a), in
gen-eral agreement with earlier reports of episodic dust intrusion (Prospero et al., 1981; Andreae et al., 1990; Artaxo et al., 1990; Swap et al., 1992; Formenti et al., 2001).
Fig. 6. Gridded statistical summaries of fires over Africa and South America. Panels are prepared using the eight-day composites of the Climate Modeling Grid (CMG) Fire Products of the MODIS Collection-5 Active Fire Product (Giglio et al., 2006). Red is scaled from 0 to 25 pixel fire counts, with corrections for cloud cover. Some pixels have more than 25 fire pixels (e.g., maximum value for scenes shown is 1000 pixel fire counts).
nighttime, katabatic (i.e., hill-valley) flows are important (Araujo et al., 2002). The nighttime measurements therefore had a microscale fetch, in contrast to the mesoscale reach of the daytime measurements. As a result, the nighttime mea-surements at TT34 were influenced by local activities, such as nighttime ecosystem emissions. Although there is consid-erable interest in the nighttime activities of tropical forests (Graham et al., 2003a; Guyon et al., 2003a; Gilbert, 2005), the focus of AMAZE-08 was on mesoscale processes.
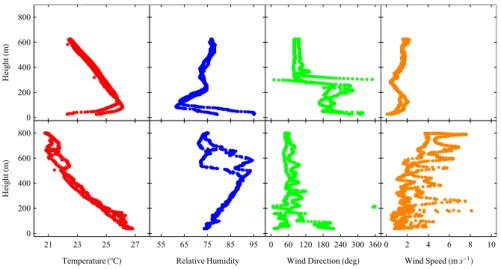
The development of the boundary-layer structure at night was driven by the formation of a nocturnal planetary bound-ary layer (PBL) that had a height comparable to the local topographical relief, which was 50 to 100 m around TT34. In this region of the Amazon Basin, the thickness of the con-vective PBL typically varies from 100–200 m at night to 1 to 2 km when fully developed in the mid afternoon (Martin et al., 1988; Garstang et al., 1990; Fisch et al., 2004). Several balloon soundings made during AMAZE-08 were consistent with these values (Figs. 9 and 10), with a PBL-top height near 700 to 800 m by local noon.
The development of the planetary boundary layer, which can be observed by LIDAR measurements, is shown in the left panel of Fig. 11 for 13 March 2008. The black line shows the PBL-top height that was derived by the method of Baars
et al. (2008). In the morning (12:00 UTC is 08:00 LT), the top height was 200 m. From 13:00 to 14:00, the PBL-top height increased from 400 to 800 m. By 14:30, cloud for-mation occurred. The figure also shows that residual layers present at 500 and 800 m in the morning became entrained by local noon in the PBL. Another layer of particles is apparent at approximately 2000 m, possibly the result of long-range transport or a cloud residual layer, among other possibilities. The height-resolved backscatter coefficients averaged across two different time periods are shown in the right panel of Fig. 11. In the first period (12:30–13:10 UTC), a shal-low convective boundary layer and an overlying residual layer from the day before are revealed in the profile of the backscatter coefficient. A sharp, steep gradient occurs at the top of the PBL. A lofted particle layer is located be-tween 1300 m and 2400 m at that time. An hour later (14:07– 14:20 UTC), the vertical structure of the backscatter coeffi-cient evolves significantly, showing the growth of the PBL up to 800 m and the mixing of the lofted residual layer into the PBL. The second lofted layer has descended, having its lower limit at about 1100 m.
25 Jan 2008 to 01 Feb 2008 18 Feb 2008 to 25 Feb 2008
02 Feb 2008 to 09 Feb 2008 26 Feb 2008 to 04 Mar 2008
10 Feb 2008 to 17 Feb 2008 05 Mar 2008 to 12 Mar 2008
0 0.2 0.4 0.6 >0.8
Figure 7
Fig. 7.Particle optical depth observed by the MODIS instrument on the AQUA satellite (Levy et al., 2007; Remer et al., 2008). Shown are the level-3 eight-day composites of Collection 5.
led at times to a circulation of generator exhaust to the research station, and these events (which were evident in the data sets of multiple instruments; Fig. S4) were tagged and logged into a community file accessed by AMAZE-08 researchers. Intersection of the generator plume with the research station was abrupt (i.e., total particle concentra-tions could increase above 1000 cm−3for 15 min, drop back to 300–400 cm−3 for 15 min, and then jump again above 1000 cm−3; Fig. S4). The abrupt behavior reflected the nar-row horizontal extent and the shifting nature of the gener-ator plume. The duration of one of these events was typi-cally several hours. Other local pollution (both at day and night) arrived at times from metropolitan Manaus. This pol-lution was apparent in multiple data sets (Fig. S4), was con-tinuous, lasted for time periods of up to a day or more (the longest period was 38 h), and corresponded to local winds from the direction of Manaus. The greater duration of the Manaus plume compared to that of the generator is explained
by their respective horizontal scales. Unless stated specifi-cally otherwise, the data associated with the periods of local pollution (constituting 24% of the measurement period) were excluded from AMAZE-08 analyses. Besides these tagged periods, the site was free of local anthropogenic influences.
3.1 Published results
Manaus
TT34
Manaus
TT34
02 Feb 2008 to 09 Feb 2008 26 Feb 2008 to 04 Mar 2008
Manaus
TT34
Manaus
TT34
10 Feb 2008 to 17 Feb 2008 05 Mar 2008 to 12 Mar 2008
Manaus
TT34
Manaus
TT34
Figure 8
Fig. 8. Gridded statistical summaries of fires in the central and northern Amazon Basin. Red is scaled from 0 to 25 pixel fire counts; the maximum value for the shown scenes is 200. Further information is provided in the caption to Fig. 6. The HYPSLIT backtrajectories at 200 m that terminate at TT34 during the eight-day period are shown beginning 7 February 2008 (i.e., corresponding to the start of AMAZE-08 measurements). Markers represent steps of 12 h. The trajectory that loops back around from Manaus is for 7 March 2008.
b, 2004). Consistent with these results, Chen et al. (2009) demonstrated that the organic material of submicron parti-cles in the Amazon Basin can be dominated by the in-Basin production of secondary organic aerosol. Chen et al. (2009) employed an HR-ToF-AMS, and the mass spectra showed that the non-refractory components of the submicron par-ticles consisted of 80 to 90% organic material. The bal-ance appeared as acidic sulfate, approximately NH4HSO4;
a caveat is that some fraction may also have been organosul-fate species, which have a similar fragmentation pattern in the AMS as inorganic sulfate and so the two species cannot be fully discriminated by this instrument (Farmer et al., 2010). Gunthe et al. (2009) conducted size-resolved measurements of the cloud-condensation-nuclei (CCN) ac-tivity of submicron particles and, using the size-resolved chemical measurements of Chen et al. (2009), obtained the
0 200 400 600 800
Height
m
21 23 25 27
0 200 400 600 800
TemperatureC
Height
m
55 65 75 85 95
Relative Humidity
0 60 120 180 240 300 360
Wind Directiondeg
0 2 4 6 8 10
Wind Speedms1
Figure 9 0 20 40 60 80 100
0 200 400 600 800
L
H
L
0 20 40 60 80 100 0
200 400 600 800
L
H
L
0 20 40 60 80 100 0
200 400 600 800
L
H
L
0 20 40 60 80 100 0
200 400 600 800
L
H
L
Figure 10
Fig. 9. Vertical profiles of temperature, relative humidity, wind direction, and wind speed from balloon soundings at site K23. Top row: night, 04:18 through 04:52 UTC of 14 March 2008. Bottom row: day, 16:29 through 16:59 UTC of 15 March 2008. Local time was−4 h with reference to coordinated universal time (UTC), and this region of the Amazon does not practice daylight savings time.
The aforementioned AMAZE-08 publications collectively had a focus on secondary organic material. Other recent AMAZE-08 publications have reported on other particle sources and properties. Ben-Ami et al. (2010) used satel-lite observations to directly track for the first time a single plume of African biomass burning and its mixing with Sa-haran dust from the Bod´el´e depression over eight days to its arrival into the Amazon Basin. Ansmann et al. (2009) used two LIDAR systems, one situated over Cape Verde and the other at the AMAZE-08 site, to investigate changes in mixing with transport. Dust and biomass-burning particles observed as distinct layers over Cape Verde evolved and mixed into a combined layer by the time of their arrival at the AMAZE-08 site. Prenni et al. (2009a) found that natural primary biological particles produced continually within the Ama-zon Basin were as important as episodic Saharan dust for explaining the time-series variance of the ice nuclei num-ber concentrations. Furthermore, for freezing temperatures warmer than−25◦C, the biological particles dominated the IN population.
In addition to these studies having a primary focus on AMAZE-08, the recent literature includes several studies that make secondary use of the data in. Andreae (2009) used AMAZE-08 data to investigate correlations between the con-centrations of cloud condensation nuclei and particle optical thickness in remote and polluted regions. Several examples of AMAZE-08 data are included in a review article by Martin et al. (2010) concerning the sources and properties of Ama-zonian aerosol particles. Prenni et al. (2009b) studied het-erogeneous ice nucleation by secondary organic materials in the laboratory and presented comparisons to data collected in AMAZE-08. Tuch et al. (2009) selected the AMAZE-08 data as the primary example in a publication describing the
design and performance of an automatic regenerating dryer. In a laboratory study of the cloud droplet activation of mixed organic-sulfate particles produced by the photooxidation of isoprene, designed to represent essential aspects of the wet-season Amazon, King et al. (2010) provided a comparison of laboratory results to the observations reported by Gunthe et al. (2009) for the Amazon. Heald et al. (2010) carried out a metastudy of three locations, including the Amazon Basin, as well as laboratory results, to provide a simplified descrip-tion of the elemental composidescrip-tion of organic particles and related implications for processes of atmospheric aging.
3.2 New results
In addition to the reports summarized above that have already appeared in the literature, further major findings concern-ing Amazonian aerosol particles are summarized herein for the first time. These findings include the number-diameter distribution from 10 nm to 10 µm (Sect. 3.2.1), mass spec-tral characterization to test for primary biological particles (Sect. 3.2.2), evidence of large-scale production of secondary organic material (Sect. 3.2.3), insights into the chemical and physical properties of the aerosol particles based on thermod-enuder analyses (Sect. 3.2.4), and the phase of hydrometeors in clouds (Sect. 3.2.5).
3.2.1 Number-diameter distribution
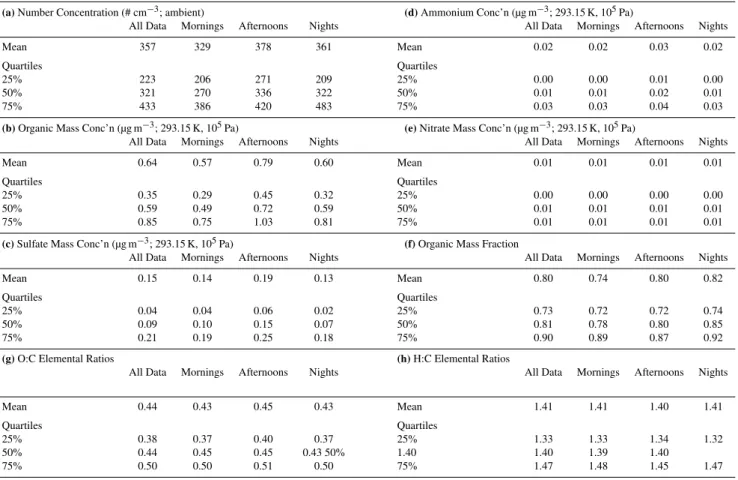
Table 2.Mean and quartiles of(a)CPC number concentration (±10%),(b)AMS-measured organic mass concentration (±30%),(c) AMS-measured sulfate mass concentration (±30%),(d)AMS-measured ammonium mass concentration (±30%),(e)AMS-measured nitrate mass concentration (±30%),(f)organic mass fraction calculated asbdivided by the sum ofbtoe,(g)AMS-measured oxygen-to-carbon (O:C) elemental ratios of the organic particle-phase material, and(h)AMS-measured hydrogen-to-carbon (O:C) elemental ratios of the organic particle-phase material. Data are screened to remove time periods affected by local pollution (“all data” column). Data are also shown segregated into morning, afternoon, and night.
(a)Number Concentration (# cm−3; ambient) (d)Ammonium Conc’n (µg m−3; 293.15 K, 105Pa)
All Data Mornings Afternoons Nights All Data Mornings Afternoons Nights
Mean 357 329 378 361 Mean 0.02 0.02 0.03 0.02
Quartiles Quartiles
25% 223 206 271 209 25% 0.00 0.00 0.01 0.00
50% 321 270 336 322 50% 0.01 0.01 0.02 0.01
75% 433 386 420 483 75% 0.03 0.03 0.04 0.03
(b)Organic Mass Conc’n (µg m−3; 293.15 K, 105Pa) (e)Nitrate Mass Conc’n (µg m−3; 293.15 K, 105Pa)
All Data Mornings Afternoons Nights All Data Mornings Afternoons Nights
Mean 0.64 0.57 0.79 0.60 Mean 0.01 0.01 0.01 0.01
Quartiles Quartiles
25% 0.35 0.29 0.45 0.32 25% 0.00 0.00 0.00 0.00
50% 0.59 0.49 0.72 0.59 50% 0.01 0.01 0.01 0.01
75% 0.85 0.75 1.03 0.81 75% 0.01 0.01 0.01 0.01
(c)Sulfate Mass Conc’n (µg m−3; 293.15 K, 105Pa) (f)Organic Mass Fraction
All Data Mornings Afternoons Nights All Data Mornings Afternoons Nights
Mean 0.15 0.14 0.19 0.13 Mean 0.80 0.74 0.80 0.82
Quartiles Quartiles
25% 0.04 0.04 0.06 0.02 25% 0.73 0.72 0.72 0.74
50% 0.09 0.10 0.15 0.07 50% 0.81 0.78 0.80 0.85
75% 0.21 0.19 0.25 0.18 75% 0.90 0.89 0.87 0.92
(g)O:C Elemental Ratios (h)H:C Elemental Ratios
All Data Mornings Afternoons Nights All Data Mornings Afternoons Nights
Mean 0.44 0.43 0.45 0.43 Mean 1.41 1.41 1.40 1.41
Quartiles Quartiles
25% 0.38 0.37 0.40 0.37 25% 1.33 1.33 1.34 1.32
50% 0.44 0.45 0.45 0.43 50% 1.40 1.40 1.39 1.40
75% 0.50 0.50 0.51 0.50 75% 1.47 1.48 1.45 1.47
concentration. The quartiles of total particle number concen-tration measured by the condensation particle counter were 223, 321, and 433 cm−3during AMAZE-08 (Table 2).
The number-diameter distribution shown in Fig. 12 was constructed by combining measurements from a scanning mobility particle sizer, an optical particle counter, and an ul-traviolet aerodynamic particle sizer. These methods rely on different physical measurement principles and therefore rep-resent different types of diameters (viz. mobility, optical, and aerodynamic diameters, respectively). These different diameters have not been adjusted. The abscissa is thus sim-ply termed “diameter” in Fig. 12. The figure shows that the agreement between the instruments for overlapping portions of the diameter domain is good, at least up to about 4 µm.
The distributions for these larger particles are based on the UV-APS and OPC measurements. The figure shows that the OPC observes the presence of particles with sizes larger than 4 µm that the UV-APS does not indicate. The
explana-tion may be that the aerodynamic cutoff of the inlet-sampling system was between 5 and 7 µm, consistent with the size dis-tributions observed by the UV-APS. The implication is that the particles detected up to 10 µm with respect to optical di-ameter (which represents the efficacy of light scattering com-pared to the calibration particles of polystyrene latex spheres) have smaller aerodynamic diameters. For instance, these re-sults can be explained by non-spherical particles having a dy-namic shape factor above unity, particles having a density less than that of water, or a refractive index greater than that of PSL material. For the typical particle types observed in the Amazon Basin, a dynamic shape factor larger than unity is perhaps the most plausible explanation (e.g., primary bio-logical particles such as fungal spores).
Figure 9
0 20 40 60 80 100 0200 400 600 800
L
Height
H
m
L
Sat 15 Mar 2008 02:43:07 UTC
0 20 40 60 80 100
0 200 400 600 800
L
Height
H
m
L
Sat 15 Mar 2008 07:10:37 UTC
0 20 40 60 80 100
0 200 400 600 800
L
Height
H
m
L
Sat 15 Mar 2008 12:07:21 UTC
0 20 40 60 80 100
0 200 400 600 800
Particle ConcentrationHðcm-3L
Height
H
m
L
Sat 15 Mar 2008 16:45:54 UTC
Figure 10
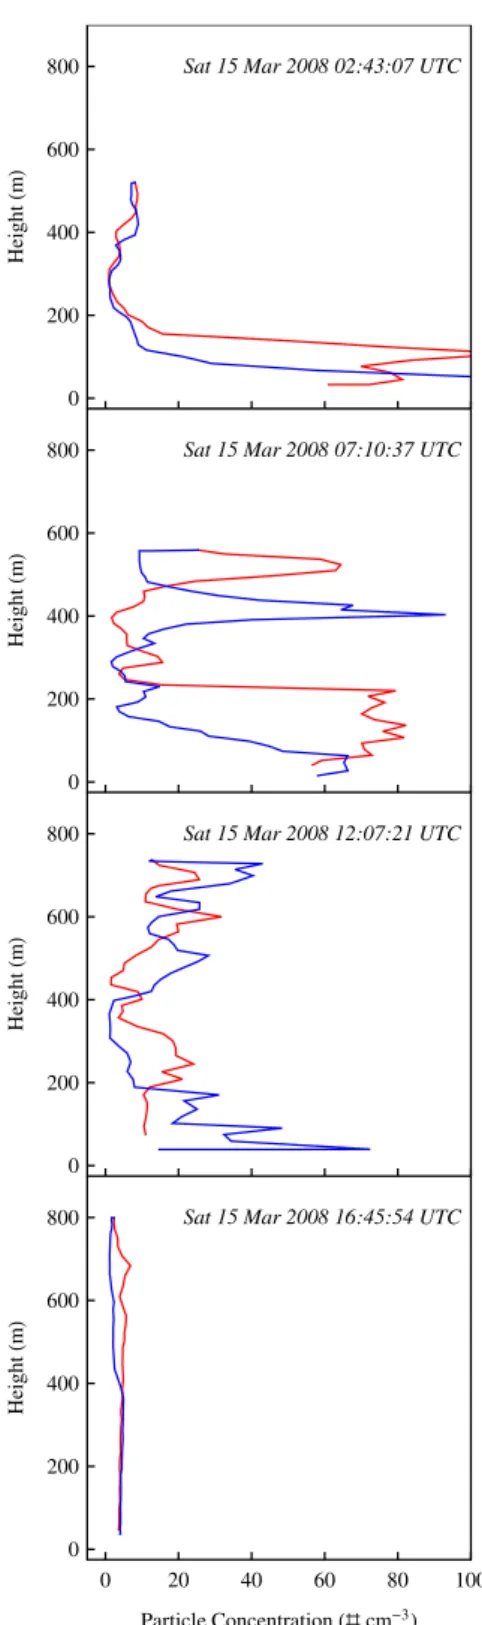
Fig. 10.Vertical profiles of total particle concentration from a four-channel optical particle counter (0.3 µm, 0.5 µm, 1 µm, and 5 µm) employed in balloon soundings at site K23 on 15 March 2008. Red and blue lines show ascending and descending portions of the soundings.
105Pa) were 0.58 and 0.05 µg m−3, respectively, during this
period, compared to 0.64 and 0.15 µg m−3 for AMAZE-08
as a whole; (2) the median total number concentration was 360 cm−3; and (3) integration of the vertical profile of the 532-nm LIDAR extinction coefficient (cf. the right panel of Fig. 11) for 13 March yielded a particle optical thickness of 0.03. The lower concentrations are believed to correspond to time periods having minimal out-of-Basin influences (Chen et al., 2009), and the plot in Fig. 12 is therefore believed to represent a steady-state dynamic balance characteristic of the Amazon Basin. As implied by the tight 90-percentile distri-bution bands and the robust mode positions in Fig. 12, the number-diameter distribution is resilient and steady. Strong rain events tested the resiliency of the distribution: it returned to its steady-state characteristics within 1 to 12 h after the rain. The rain events were typically localized, and the ex-planation for that resiliency may be that large-scale mixing homogenized the Basin and erased the effects of localized precipitation cells after a short time period.
The middle panels of Fig. 12 show the surface and vol-ume distributions calculated from the number distribution of the top panel. As typical for unpolluted locations world-wide, the larger part of the volume distribution occurs in the coarse mode. Atypically, however, the surface distribution has strong sub- and supermicron contributions in the Ama-zon Basin, indicating the importance of both modes to light scattering in the Basin (Guyon et al., 2003a, b, 2004). The shaded regions of Fig. 12 represent the 10- and 90-percentiles of the calculated distributions; they do not represent uncer-tainty. The uncertainty (not shown) increases considerably with diameter in the conversion from a number-diameter distribution to surface-diameter (as diameter-squared) and volume-diameter (as diameter-cubed).
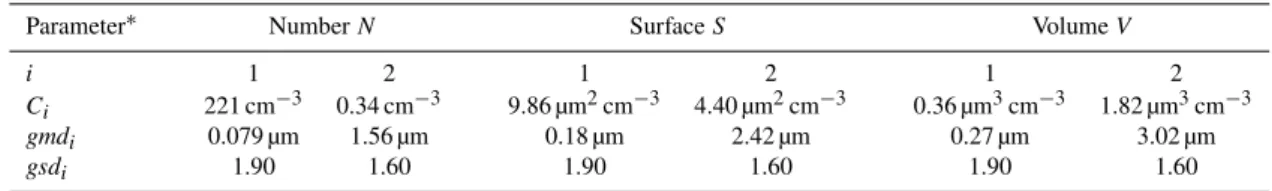
Parameters of a two-mode lognormal distribution fit to ap-proximately describe the data shown in Fig. 12 are given in Table 3. As a consistency check, the parameters for the surface and volume distributions satisfy the Hatch-Choate relationships to the number distribution (Hinds, 1999). The bottom panel of Fig. 12 shows the log10 residuals between
the measurements and the parameterization. Across the full size range of 20 nm to 3 µm, the median residual (i.e., the heavy line) of the parameterization is within 50% (i.e., 1log10<0.2) of the measured median. The shaded regions
Range-corrected signal, 1064 nm, PollyXT
high low
1 2 :0 0 1 3 :0 0 1 4 :0 0 1 5 :0 0
0 1 2 3 4
0 0 .1
( M m- 1 s r- 1)
0 1 2 3 4
12:30 - 13:10 UTC 14:07 - 14:20 UTC
Time (UTC)
Height (km) Height (km)
Backscatter coeff.
Figure 11
Fig. 11.Vertical profile measured by the PollyXT LIDAR at the Silvicultura site on 13 March 2008. (Left) False-color representation of the time series of the range-corrected signal at 1064 nm. Blue and black represent low backscattering that is characteristic of gases. Green and yellow indicate high backscattering that is characteristic of particles. White shows very high backscattering, which is often caused by clouds. The broken black line represents the top of the planetary boundary layer. (Right) Height-resolved backscatter coefficients averaged across two different time periods.
3.2.2 Primary biological aerosol particles investigated by mass spectrometry
A hypothesis often discussed in the literature is that PBAPs contribute significantly to the submicron mass concentra-tion of atmospheric particles, especially in the rain forest (Matthias-Maser and Jaenicke, 1995; Andreae and Crutzen, 1997; Jaenicke, 2005). In partial support of this hypoth-esis, during the LBA-CLAIRE-2001 campaign in the cen-tral Amazon Basin near the site of AMAZE-08, Graham et al. (2003b) detected by chromatography the presence of molecular PBAP tracers in the fine fraction (smaller than 2.5 µm). In an effort to obtain greater quantification of the possible importance of PBAPs in the submicron mode, as part of AMAZE-08 ambient particles were analyzed by on-line mass spectrometry using the MPI-PC high-resolution time-of-flight Aerodyne Aerosol Mass Spectrometer. The mass spectra collected in AMAZE-08 were compared to those of typical PBAP materials investigated in the labora-tory. The fragmentation patterns of amino acids and car-bohydrates investigated in the laboratory indicate that there are marker peaks for primary biological material: mass-to-charge 30.0344 (CH4N+), 42.0344 (C2H4N+), and 56.050
(C3H6N+) for amino acids and 60.0211 (C2H4O+2), 61.0290
(C2H5O+2), and 73.0290 (C3H5O+2) for carbohydrates
(Freu-tel, 2009). A caution is thatm/z 60 and 73 are also used as marker peaks of biomass-burning particles (see above) (Schneider et al., 2006; Alfarra et al., 2007), mainly because of the release of levoglucosan (i.e., an anhydride of the car-bohydrate glucose) as a pyrolysis product of cellulose (Si-moneit et al., 1999; Fraser and Lakshmanan, 2000).
Table 3.Parameters describing two-mode distributions of number, surface, and volume for the plots of Fig. 12.
Parameter∗ NumberN SurfaceS VolumeV
i 1 2 1 2 1 2
Ci 221 cm−3 0.34 cm−3 9.86 µm2cm−3 4.40 µm2cm−3 0.36 µm3cm−3 1.82 µm3cm−3
gmdi 0.079 µm 1.56 µm 0.18 µm 2.42 µm 0.27 µm 3.02 µm
gsdi 1.90 1.60 1.90 1.60 1.90 1.60
∗For the governing equations:dlogdNDp,dlogdSDp,dlogdVDp=P
i Ci
√
2πloggsdiexp −
logDp−loggmdi2
2 loggsdi2 !
3.2.3 Secondary organic material
There are six pieces of evidence collected in AMAZE-08 that demonstrate that submicron particles in the Amazon Basin are well described in their properties as secondary or-ganic material. (1) Imaging of collected particles by in-lens scanning electron microscopy reveals liquid organic particles unique to the Amazon Basin, i.e., as compared to continen-tal sites in the anthropogenically influenced Northern Hemi-sphere (Sinha et al., 2009; P¨oschl et al., 2010). (2) Peak po-sitions and intensities are similar between the particle mass spectra collected in AMAZE-08 and those in environmen-tal chambers for SOA particles (introduced in Chen et al., 2009, and further results to be published). (3) Gunthe et al. (2009) report that for AMAZE-08 the average effective hygroscopicity parameter characterizing the size-dependent CCN activity of pristine rainforest aerosol particles can be accurately predicted using values obtained in the laboratory for secondary organic material. (4) There is an upper limit of 5% in the fraction of the signal intensity in the particle mass spectrum that can be attributed to primary biological aerosol particles (cf. Sect. 3.2.2 as well as Chen et al., 2009). (5) The average elemental O:C ratio in the Amazon Basin of 0.44 is similar to that measured in environmental cham-bers for SOA particles and to that expected for two oxygen-atom addition to each C5H8-mer of a biogenic VOC (Chen
et al., 2009; Shilling et al., 2009). (6) Thermodenuder treat-ment at 90◦C reduces the particle volume concentration by 40% (i.e., as calculated from changes in the number-diameter distributions measured by an SMPS) and the organic mass concentration measured by the MPI-PC AMS by 55% (cf. Sect. 3.2.4). In laboratory experiments, a similar reduction in mass concentration occurs for secondary organic material that is comparably heated (Huffman et al., 2009a; Poulain et al., 2009; King et al., 2010).
The picture therefore emerges of the Amazon Basin as a large-scale region for the highly active production of sec-ondary organic aerosol, using the feedstock of plant emis-sions and high water vapor, combined with the energy from the sun, to sustain high OH radical concentrations that drive the photo-oxidation of biogenic VOCs. In the submicron mode, an individual particle ranges from nearly a pure liquid of secondary organic material as the most common type of
particle (by number) to particles having a solid core that are extensively coated by secondary organic material at volume fractions exceeding 0.5 (Sinha et al., 2009; P¨oschl et al., 2010). In the supermicron mode, mineral dust and primary biological aerosol particles having thick liquid coatings of secondary organic material are the norm.
This general view of the Amazon as a highly active re-gion of SOA production is further supported by space-borne sensor observations of the BVOC oxidation product glyoxal (Vrekoussis et al., 2009), by measurements of unexpectedly high OH concentrations (Lelieveld et al., 2008), and by ob-servations indicative of rapid isoprene oxidation (Kuhn et al., 2007; Karl et al., 2009). Work carried out in the Ama-zon demonstrated the presence of tetrols in collected par-ticles (Claeys et al., 2004), suggesting isoprene as an im-portant source of SOA (Henze and Seinfeld, 2006; Kroll et al., 2006). Chromatographic analysis of material collected on filters during the day compared to the night showed sig-nificant differences in molecular composition. Specifically, there were enhanced concentrations in the day of oxygenated organic acids that are indicative of fresh SOA production and/or SOA aging processes (Graham et al., 2003a, b).
These results for the Amazon tropical rain forest can be compared to other recent observations over tropical forested West Africa during the wet season (Capes et al., 2009) as well as measurements above a maritime tropical forest in Borneo, Malaysia (Robinson et al., 2010). Based on these three sets of measurements, the organic mass concentrations (ca. 1 (±30%)) are consistently lower for the tropical rainfor-est compared to temperate coniferous forrainfor-ests (Zhang et al., 2007). The three tropical locations also have in common that secondary organic material is identified as the major organic component in the submicron mode.
3.2.4 Thermodenuder analysis
0.01 0.1 1 10 100 1000
d
N
dlog
10
Dp
cm
3
Number
Measured
SMPS
OPC
APS
0.01 0.1 1 10 100
d
S
dlog
10
Dp
Μ
m
2cm
3 Surface Calculated
0.01 0.1 1 10 100
d
V
dlog
10
Dp
Μ
m
3cm
3 Volume Calculated
0.01 0.05 0.1 0.5 1 5 10
1.0 0.5
0.0 0.5 1.0
Mobility,Optical, Aerodynamic DiameterDpΜm
Difference
of
Log
10
Values
Number, Surface, Volume: Fit Residual
Figure 12
Fig. 12.The top panel shows the measured number-diameter distri-butiondN/dlogDpfrom 10 nm to 10 µm for 6 to 14 March 2008.
The distribution is a composite of measurements from a scanning mobility particle sizer (SMPS), an optical particle counter (OPC), and an ultraviolet aerodynamic particle sizer (UV-APS). The central lines show the median during the time period, and the shaded re-gions represent the 10- and 90-percentiles of the distribution of ob-servations. Shown in the middle panels are the surface-diameter and volume-diameter distributions calculated from the number-diameter distribution. The bottom panel shows the difference of log10values between measurement and calculation (i.e., the residual) for the log-normal parameters given in Table 3. The residuals of log10values are identical for number, surface, and volume distributions.
1.0
0.8
0.6
0.4
0.2
0.0
Relati
ve
I
nt
ens
it
y
(
m
/
z
4
3
)
0.8
0.6
0.4
0.2
0.0
Relat
ive Int
ensi
ty (
m
/
z
44)
200 150
100 50
Temperature (°C)
AMAZE-08 (0.6) MILAGRO (17) SOAR-1 (9)
Figure 13
Fig. 13. Thermograms showing the relative signal intensity atm/z
43 (C2H3O+) in the top panel andm/z44 (CO+2) in the bottom panel for the organic component of the particle mass spectra on 13 March 2008. Signal intensity is for unit mass resolution. The thermograms were corrected for diffusion losses inside the ther-modenuder using the approach described by Huffman et al. (2008). The ambient-temperature flow rate through the thermodenuder was 0.6 Lpm. Thermograms for aerosol sampled during the MILAGRO and SOAR campaigns (Huffman et al., 2009b), which represent two polluted megacities, are also included in the figure. The num-bers inside the parentheses in the figure legend indicate the organic mass loading (µg m−3) of each measurement prior to thermode-nuder treatment. The lines in the figure are to guide the eye and do not represent a model fit.
pristine locations such as the Amazon. Although the TD-SMPS data were collected after the conclusion of AMAZE-08, the pristine conditions of the wet season still prevailed during that time.
A TD-AMS thermogram was collected across 25 to 240◦C on 13 March 2008, corresponding to a time period of pristine conditions (Chen et al., 2009). Figure 13 shows the loss-corrected thermograms of the relative signal intensity atm/z 43 (mainly C2H3O+) in the top panel and m/z44 (mainly
CO+2) in the bottom panel for the organic component of the particle mass spectra. Relative signal is calculated as the signal intensity at the warmer temperature divided by that at ambient temperature. The thermograms of the pristine particles of the Amazon Basin differ substantially at both m/z43 and m/z44 from those of organic particles in pol-luted metropolitan of southern California (SOAR) and Mex-ico City (MILAGRO) (Huffman et al., 2009a,b). Specifically, for pristine compared to polluted conditions, the relative sig-nal intensity decreases much more with increasing tempera-ture. This comparison is consistent with the large-scale pro-duction of biogenic secondary organic material within the Basin. Urban primary and secondary organic material (i.e., having a high fraction of anthropogenic precursors) is less volatile than biogenic secondary organic material (Huffman et al., 2009a,b). The lower volatility of SOAR/MILAGRO compared to AMAZE-08 might also be explained in part by the presence of inorganic and black-carbon components that are commonly internally mixed with organic material in many urban areas, in contrast to the organic-dominated com-position of individual particles in the Amazon Basin.
Also apparent in Fig. 13 is that for temperatures warmer than 120 to 150◦C the AMAZE-08 signal intensities for bothm/z43 andm/z 44 no longer change within the mea-surement uncertainty. This behavior can be contrasted with the continuous decrease in the intensities of these ions for the polluted conditions of MILAGRO and SOAR campaigns. The difference might be an indication of the presence of re-fractory oligomers. Although this explanation concerning oligomers is speculative, it is consistent with the results of chamber experiments that were designed to represent the pro-duction of secondary organic material in the Amazon Basin (King et al., 2010).
Except for the thermogram collected on 13 March, the TD-AMS measurements were conducted at a fixed thermod-enuder temperature of 90◦C. The observations show that the organic mass concentration typically decreases by more than 55% following thermodenuder treatment. The sulfate mass concentration decreases by 10%, indicating the pref-erential volatility of the organic material. For times during which the organic mass concentrations are relatively high, an even larger fraction of up to 70% of the organic ma-terial is removed. For comparison to these observations in the Amazon, thermodenuder treatment at 90◦C leads to the removal of 65% of the secondary organic material pro-duced in environmental chambers by the oxidation of iso-prene andα-pinene (Huffman et al., 2009a; Poulain et al., 2009; King et al., 2010).
The TD-SMPS measurements show that the accumulation-mode particles (ca. 200 nm) are more volatile than their Aitken-mode counterparts (ca. 90 nm). The accumulation-mode is nearly absent after exposure to 300◦C, in contrast to the number concentration of the Aitken mode which de-creases by just 15 to 20% at that temperature. The implica-tion of the different volatilities is a substantial difference in chemical composition between the two particle modes, sug-gestive of different dominant sources for the particle com-ponents. In support of this conclusion, the organic mass spectra of the Harvard AMS show clear differences between the two particle modes. Based on the theory of the Hop-pel minimum (Martin et al., 2010), the secondary organic components of the Aitken mode are produced by gas-to-particle chemical pathways whereas the components in the accumulation mode are produced in large part by aqueous-phase pathways in cloud water. The idea of distinct sources for the two modes is also consistent with the observed ho-mogeneity within a mode, as demonstrated by a uniform shift in the mode diameter with heat treatment (i.e., as op-posed to splitting into separate modes or a broadening of the mode width). Across the measurement time period, the ra-tios of the particle volume concentration (as determined by the SMPS measurements) after thermodenuder treatment to that recorded for the ambient-temperature bypass varied by at most 10%, which suggests a stable steady state among the sources and sinks of secondary organic material within the Amazon Basin.
3.2.5 Hydrometeor phase in clouds
The presence of ice in clouds influences precipitation, cloud lifetime, and radiative forcing (Harrington and Olsson, 2001; Petersen and Rutledge, 2001; Zuidema et al., 2005); more-over, in the Amazon Basin, lightning frequency and instan-taneous rain rate are highly correlated with cloud ice water content (Petersen and Rutledge, 2001). Ice nuclei are those particles that initiate ice formation in clouds at tempera-tures warmer than−36◦C, and they significantly influence the formation of mixed-phase clouds and precipitation for ice crystal number concentrations that exceed about 10−3to
10−2crystals cm−3at cloud top (Fletcher, 1961).
Determin-ing the temperature at which ice nuclei concentrations ex-ceed 10−3cm−3 can therefore provide insight into regional
cloud processes. As part of AMAZE-08, Prenni et al. (2009a) made ground-based measurements and reported average ice-nuclei concentrations of 10−2cm−3 at−30◦C, decreasing to 10−3cm−3at−20◦C. Even lower numbers, nearly below the detection limit of the instrument, were found at warmer temperatures. Concentrations of 10−2 to 10−3cm−3 corre-sponded to 1 particle in 104to 105based on the AMAZE-08 median concentration of 320 particles cm−3
MODIS-retrieved hydrometeor phase of clouds in a radius of 500 km surrounding the AMAZE-08 measurement site (Plat-nick et al., 2003). In the analysis, phase refers to one of ice, mixed-phase, liquid, or undetermined. The MODIS cloud al-gorithm uses differences in water and ice optical properties at 8.5 and 11 µm to derive the hydrometeor phase (Platnick et al., 2003). Cloud-top pressure and temperature are derived using a CO2-slicing technique. The derivations of
hydrome-teor phase are conducted for each cloudy scene viewed in the infrared at a resolution of approximately 5×5 km2 at
satel-lite nadir. The results are stored in the MODIS level-2 5-min cloud products.
Consistent with the ground-based ice nuclei measurements of Prenni et al. (2009a), Fig. 14 shows that ice-free clouds were rarely observed for temperatures colder than−20◦C, with ice-only clouds becoming progressively more dominant at the colder temperatures. Extension of this result more broadly throughout the Amazon Basin suggests that precip-itation from cold-cloud processes can be expected with pro-gressive frequency for cloud-top temperatures of−20◦C and colder (i.e., as represented in Fig. 14). These results are similar to those reported by Hanna et al. (2008), who exam-ined the correlation between satellite-inferred cloud-top tem-peratures and snowfall patterns over the contiguous United States. Snow did not form for temperatures warmer than
−15◦C. To explain this observation, Hanna et al. suggested that there was an absence of sufficient IN. The good agree-ment between the ground-based measureagree-ments of ice nuclei at−20 to−30◦C during AMAZE-08 and the correspond-ing MODIS-based observations of significant ice in clouds at these temperatures suggests that the surface measurements provide useful information for describing ice formation at higher altitudes.
4 Conclusions
The scientific objective of AMAZE-08 was to understand the formation, transformations, and cloud-forming proper-ties of fine- and coarse-mode biogenic natural aerosol par-ticles, especially as related to their effects on cloud acti-vation and regional climate. AMAZE-08 investigated the relationship among plant emissions (Karl et al., 2009), at-mospheric particle mass concentrations (Chen et al., 2009), and concentrations of cloud condensation nuclei (Gunthe et al., 2009) and ice nuclei (Prenni et al., 2009a). AMAZE-08 deployed for the first time several advanced instruments to Amazonia, including an Aerodyne Aerosol Mass Spec-trometer for on-line chemical characterization of aerosol par-ticles (Chen et al., 2009), a DMA-CCNC setup for size-resolved CCN measurements (Gunthe et al., 2009), an ice nuclei counter (Prenni et al., 2009a), and a Raman LI-DAR for long-term vertical profiling (Ansmann et al., 2009). AMAZE-08 provided chemical measurements of particles
0.8
0.6
0.4
0.2
0.0
Fr
ac
ti
on
-40 -35 -30 -25 -20 -15 -10 -5 0
Cloud Top Temperature (°C) ice mixed phase liquid undetermined
Figure 14
Fig. 14.MODIS-indicated hydrometeor phase of clouds for the ge-ographic region and time period of AMAZE-08. Plotted against cloud-top temperature is the fraction of ice (blue), mixed phase (green), and liquid clouds (red). The fraction is made whole by a white region representing the fraction of time during which hy-drometeor phase could not be determined.
on 1 to 5 min timescales (Chen et al., 2009), allowing in-sight into processes and mechanisms, compared to earlier work that was limited to daytime and nighttime averages (Martin et al., 2010).
The results presented in this overview paper of AMAZE-08 concentrated on the objective of understanding the forma-tion, transformations, and cloud-forming properties of bio-genic natural aerosol particles. Parameters of a two-mode lognormal distribution to describe the number-diameter dis-tribution from 10 nm to 10 µm are presented in Table 3, serv-ing as a reference for the Amazon Basin in the wet sea-son and representing the natural aerosol system in the ab-sence of anthropogenic influence. The median number con-centration during AMAZE-08 was 321 cm−3, showing that typical continental rural locations in the Northern Hemi-sphere having concentrations more than ten times this value represent the influence of anthropogenic activities and show that aerosol cycles are highly disrupted by human activities. Cloud microphysics (including brightness, persistence, and precipitation) are sensitive to variable particle concentrations below 1000 cm−3so that the modern-day separation of
con-tinental and marine clouds appears as a result of human ac-tivities. The observations recorded in AMAZE-08 provide a baseline knowledge of biogenic particles and therefore as-sist in identifying separate (as well as synergistic) behavior between natural and anthropogenic particles.