www.atmos-chem-phys.net/10/12149/2010/ doi:10.5194/acp-10-12149-2010
© Author(s) 2010. CC Attribution 3.0 License.
Chemistry
and Physics
Measurement of the ambient organic aerosol volatility distribution:
application during the Finokalia Aerosol Measurement Experiment
(FAME-2008)
B. H. Lee1, E. Kostenidou2,3, L. Hildebrandt1, I. Riipinen1,4, G. J. Engelhart1, C. Mohr5, P. F. DeCarlo5, N. Mihalopoulos6, A. S. H. Prevot5, U. Baltensperger5, and S. N. Pandis1,2,3
1Department of Chemical Engineering, Carnegie Mellon University, Pittsburgh, PA, USA 2Department of Chemical Engineering, University of Patras, Patra, Greece
3Institute of Chemical Engineering and High Temperature Chemical Processes, ICE-HT, Patra, Greece 4Department of Physics, University of Helsinki, Helsinki, Finland
5Paul Scherrer Institute, Laboratory of Atmospheric Chemistry, 5232 Villigen, Switzerland 6University of Crete, Department of Chemistry, Heraklion, Greece
Received: 16 June 2010 – Published in Atmos. Chem. Phys. Discuss.: 20 July 2010
Revised: 10 November 2010 – Accepted: 2 December 2010 – Published: 21 December 2010
Abstract. A variable residence time thermodenuder (TD) was combined with an Aerodyne Aerosol Mass Spectrome-ter (AMS) and a Scanning Mobility Particle Sizer (SMPS) to measure the volatility distribution of aged organic aerosol in the Eastern Mediterranean during the Finokalia Aerosol Measurement Experiment in May of 2008 (FAME-2008). A new method for the quantification of the organic aerosol volatility distribution was developed combining measure-ments of all three instrumeasure-ments together with an aerosol dy-namics model.
Challenges in the interpretation of ambient thermodenuder-AMS measurements include the poten-tial resistances to mass transfer during particle evaporation, the effects of particle size on the evaporated mass fraction, the changes in the AMS collection efficiency and particle density as the particles evaporate partially in the TD, and finally potential losses inside the TD. Our proposed mea-surement and data analysis method accounts for all of these problems combining the AMS and SMPS measurements.
The AMS collection efficiency of the aerosol that passed through the TD was found to be approximately 10% lower than the collection efficiency of the aerosol that passed through the bypass. The organic aerosol measured at Fi-nokalia is approximately 2 or more orders of magnitude less volatile than fresh laboratory-generated monoterpene (α-pinene,β-pinene and limonene under low NOxconditions)
Correspondence to:S. N. Pandis
secondary organic aerosol. This low volatility is consistent with its highly oxygenated AMS mass spectrum. The results are found to be highly sensitive to the mass accommodation coefficient of the evaporating species. This analysis is based on the assumption that there were no significant reactions taking place inside the thermodenuder.
1 Introduction
Volatility measurements have been performed for over four decades. The general method for volatility measurements is to pass the aerosol through a heated tube in which the more volatile components evaporate leaving less volatile components behind in the particulate phase to be detected and analyzed by various instruments downstream of the heated flow tube. For example, Pinnick et al. (1987) used a light scattering aerosol counter downstream of a fused-quartz tube wrapped with a nichrome ribbon heating element to gain information about the composition of ambient aerosol at a rural site in southern New Mexico. Clarke (1991) used six heated tubes in front of a differential mobility analyzer (DMA) and a laser optical particle counter to obtain size dependent measurement of aerosol volatility. Burtscher et al. (2001) improved the simple heated tube method by developing a thermodenuder (TD) which is a heated flow tube followed by an adsorption/cooling section in which gases are removed by adsorption onto activated charcoal to avoid potential recondensation. Wehner et al. (2002) improved the design further by improving the homogeneity of the temperature profile and increasing the residence time in the heating section. Numerous TDs have been designed and built upon the ideas of Burtscher et al. (2001) and Wehner et al. (2002); however the operating characteristics of existing TD systems vary dramatically from instrument to instrument. For example, the reported average residence time in the heated zone of the thermodenuder is as small as 0.57 s in Jonsson et al. (2007) and as large as 53 s in Lee (2010). An et al. (2007) investigated effects of residence times on the aerosol volatility and suggested that TDs need to be operated at a range of residence times due to the potential resistances to mass transfer from the particulate to the gas phase.
Volatility measurements of organic aerosol have received considerable attention recently and have been carried out both in the field (Engler et al., 2007; Huffman et al., 2009) and in the laboratory (An et al., 2007; Jonsson et al., 2007; Faulhaber et al., 2009). Lee (2010) used an aerosol dynam-ics model based on the volatility basis set (VBS) approach (Donahue et al., 2006) and SOA yield parameters derived from smog chamber studies to show that, due to mass trans-fer resistances in the particulate phase or at the interface, an effective accommodation coefficient of 0.05 was needed for the description of at least the early stage of the evaporation. Using the model, he suggested that particles do not reach equilibrium with the surrounding gas phase even after 16 s. Riipinen et al. (2010) have estimated that ambient aerosol almost never reaches equilibrium inside TDs, and therefore TDs provide information on the evaporation rates of particles and not directly on their equilibrium states. Extracting the volatility of OA from the TD measurements requires use of mass transfer models that can account for the effects of par-ticle size, concentration and mass transfer resistances. All these studies assume that the OA does not react to a sig-nificant degree inside the TD. However, there is evidence
(Denkenberger et al., 2007; Wu et al., 2009) that this may not be always the case especially for the measurements at higher temperatures.
Recently, Aerosol Mass Spectrometers (AMSs) (Jayne et al., 2000; Jimenez et al., 2003; DeCarlo et al., 2006) have been combined with TD systems to obtain information about the relationships between the organic aerosol composition and its volatility (Faulhaber et al., 2009; Grieshop et al., 2009a; Huffman et al., 2009; Kostenidou et al., 2009; Cappa and Jimenez, 2010). The challenges in the interpretation of ambient TD-AMS measurements, which include the poten-tial resistances to mass transfer during particle evaporation, the role of particle size, the changes in the AMS collection efficiency and particle density as the particles evaporate par-tially during heating, and finally potential losses inside the thermodenuder, have not been fully addressed. Due to these challenges and the lack of the corresponding theoretical anal-ysis, comparisons of the findings of different studies are dif-ficult (Cappa and Jimenez, 2010).
In this study, a variable residence time thermodenuder, a Quadruple-AMS and a Scanning Mobility Particle Sizer (SMPS), were combined to investigate the volatility of or-ganic aerosol in the Eastern Mediterranean during the Fi-nokalia Aerosol Measurement Experiment–2008 (FAME-2008). A new data analysis method, which addresses the challenges of ambient TD-AMS measurements, is applied for the quantification of the organic aerosol volatility distri-bution.
2 Methods
2.1 Field operation of thermodenuder-AMS system
Aerosol volatility measurements were made using a thermodenuder-AMS system in the May 2008 EUCAARI (European Integrated Project on Aerosol Cloud Climate Air Quality Interactions) intensive campaign (Kulmala et al., 2009). The measurements took place during 8 May– 9 June 2008 at a remote sampling site close to Finokalia in Crete, Greece. There were no local sources close-by, allow-ing the study of aged organic aerosol from different source regions (Pikridas et al., 2010).
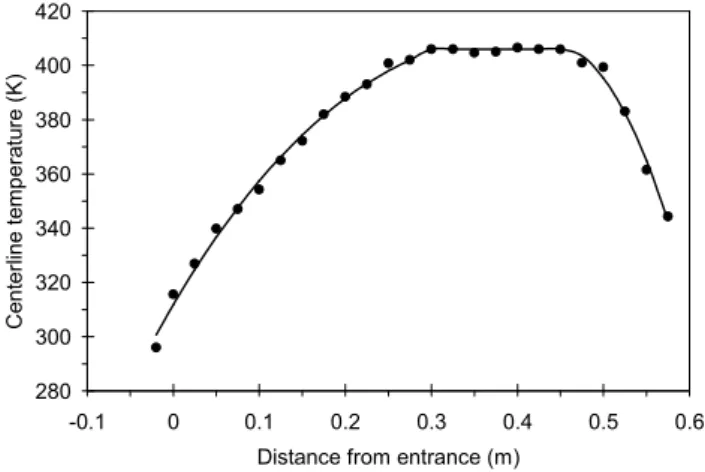
Fig. 1.Temperature profile along the axis of the heating section at a flow rate of 1.15 L min−1. Lines are fitted to describe the
temper-ature profile in the TD for the aerosol dynamics model.
1◦C for several hours at various flow rates and temperature up to 250◦C. The temperature profile was measured with a 60 cm long thermocouple (OMEGACLAD, KQXL-18E) positioned in the center of the heating tube in the direc-tion of the flow at flow rates of 1.15 and 0.15 L min−1,
which were used in FAME-2008 (Fig. 1). At flow rates of 1.15 L min−1and 0.15 L min−1, the corresponding centerline
residence times of the aerosol in the heating section are 14 s and 105 s, respectively. As shown on Fig. 1, the temperature increases relatively slowly at the entrance of the heating tube and reaches the maximum temperature at around 25 cm from the entrance staying within±3◦C of this value before falling near the exit, 50 cm from the entrance, of the heating tube. This maximum temperature will be referenced for each mea-surement and the measured temperature profile will be used for the analysis.
The adsorption/cooling section, 45 cm in length, has a tubular mesh (3.5 cm ID) inside the stainless steel tube (6.5 cm ID) to hold activated carbon (Fisher Scientific, 6– 14 Mesh). The connection, a 3.5 cm ID stainless steel tube, between the heating and adsorption/cooling section is insulated by fiberglass in order to prevent potential re-condensation due to cooling.
A Quadrupole Aerodyne Aerosol Mass Spectrometer and a Scanning Mobility Particle Sizer (SMPS, TSI 3034), placed downstream of the thermodenuder, were combined to in-vestigate the volatility of organic aerosol during FAME-2008. During ambient aerosol sampling, particles passed alternatively through the thermodenuder or the bypass line (0.25 inch, copper tube). The aerosol flow direction was con-trolled by three-way solenoid valves (Alcon, U33-42-21-12). The valves were automatically switched using Labview and FieldPoint units (National Instruments, FP-1000, FP-RLY-422, and FP-TC-120). Switching between the ambient and thermodenuded measurements occurred every 12 min.
Parti-cles exiting or bypassing the thermodenuder were split into two streams; one entering the SMPS, the other going to the AMS for real-time size and composition measurements at various temperatures. The comprehensive analysis of AMS spectra is presented by Hildebrandt et al. (2010). Three ther-mocouples (OMEGACLAD, KTSS-HH) were used to mea-sure centerline temperatures in the middle of the heating sec-tion (T1), at the exit of the heating section (T2), and at the
exit of the adsorption/cooling section (T3). Temperatures
re-ported in this paper are the centerline temperatures in the middle of heating section (T1)corresponding to the
maxi-mum temperature mentioned above.
2.2 Thermodenuder-AMS data analysis
The analysis of ambient thermodenuder-AMS measurements is complicated by potential changes in the AMS collection efficiency and organic aerosol density as particles partially evaporate upon heating in the TD, particle losses within the TD, and the potential resistances to mass transfer during par-ticle evaporation. Here we propose a data analysis method for ambient thermodenuder-AMS data accounting for all of these problems.
2.2.1 Collection efficiency and organic density
The AMS does not always measure the whole aerosol sam-ple due to the partial transmission of particles, bouncing of less “sticky” particles on the vaporizer, and to a lesser ex-tent shape-related collection losses at the vaporizer (Slowik et al., 2004; Huffman et al., 2005; Canagaratna et al., 2006; Matthew et al., 2008). Thus the overall collection effi-ciency (CE) depends on the aerosol composition, morphol-ogy, shape and size. The CE values may also change after partial evaporation of particles in the TD. This may be due to different behavior in the AMS vaporizer of particles with less-volatile compounds, or changes in particle shape, or a combination of these. Another parameter that may change upon heating, evaporation of the more volatile OA compo-nents, and subsequent cooling is the organic aerosol density. The AMS-SMPS measurement matching algorithm of Kostenidou et al. (2007) is used to calculate the CE of the AMS and the organic density for both the ambient and ther-modenuded aerosol as a function of time for the full study. The approach combines the mass distributions from the AMS and the volume distributions provided by the SMPS. The aerosol water content during the FAME-2008 measurements varied from 0–20% of the total mass (the particles were not dried before sampling) and was included in the algorithm. The total density for the algorithm is given by:
ρ=
x
a/s
ρa/s
+xorg
ρorg
+xw
ρw
−1
(1) where xa/sis the mass fraction of the ammonium sulfate,xorg
of the water, ρa/s is the density of the ammonium sulfate
(1.77 g cm−3),ρ
orgis the unknown organic density andρwis
the water density (1.0 g cm−3). The AMS nitrate
concentra-tion was only about 1% of the total aerosol mass measured by the AMS during FAME-2008 and is not included in the analysis. The contribution of sea-salt and dust in the size range used by the algorithm (less than 500 nm) was negligi-ble (Pikridas et al., 2010). The method takes into account that the particles have a size-dependent density but assumes that OA density is size independent. The matching algorithm matches the AMS mass distribution and the SMPS volume distribution using the OA density and collection efficiency as fitting parameters. The best fit is selected using the minimum error score (Kostenidou et al., 2007) resulting in estimates of these two parameters and their corresponding uncertainty range.
Using the optimization algorithm of Kostenidou et al. (2007) the collection efficiency of the AMS (Fig. 2) and the organic density for the ambient and thermodenuded sam-ples for the FAME-2008 periods were calculated. The calcu-lated average collection efficiency of AMS for the denuded and ambient samples are 0.76±0.09 and 0.85±0.08 respec-tively. The AMS collection efficiency is found to be approxi-mately 10% lower for the aerosol that passes through the TD. This may be due to the increase in the less sticky, less volatile compounds in the aerosol as more volatile compounds are vaporized in the TD. There are other potential explanations including the evaporation of water in the TD, changes in the morphology of the particles due to changes in the OA/sulfate ratio, etc. The relatively high values of the estimated am-bient PM CE compared to the 0.5, that is sometimes used as the default choice when no other information is available, may be due to the acidic nature of the particles that did not ef-floresce even at low RH. This may have reduced the bounce of particles in the AMS. There are other potential explana-tions including the specifics of the Q-AMS used in the study or the nature of the very aged organic OA. After application of this collection efficiency, the AMS sulfate concentration agreed well (R2=0.95 and slope equal to 1.09) with con-centrations measured independently by PM1.3filters
(Hilde-brandt et al., 2010) during the full duration of the study. The sulphate and OA concentrations in the 1–1.3 µm micrometers region is always less than 10% and usually less than 5% of the PM1.3sulphate and OA in Finokalia (Gerasopoulos et al.,
2007). This agreement increases our confidence in the esti-mated CE value for the ambient PM. There is no independent way to confirm the CE for the thermodenuded aerosol with the available measurements.
For FAME-2008, the average organic aerosol densities for the thermodenuded and ambient aerosol are 1.27±0.28 g cm−3 and 1.35±0.22 g cm−3 respectively. The
den-sity of the OA remaining after evaporation at 110◦C (1.26±0.24 g cm−3)was not statistically different from that
of the OA remaining at 140◦C (1.31±0.31 g cm−3). These
values are in agreement with the ambient OA density
deter-! " ! " !
# $
%& ' ' ' ( )
! " ! " !
# $
%& ' ' '
! " ! " !
# $
%& ' ' ' ( ) ( )
Fig. 2. Changes in the AMS collection efficiency for the ambi-ent (top) and thermodenuded (bottom) aerosol during month long FAME-2008 period. The shading represents the solutions within 10% of the minimum error score of the distribution matching algo-rithm and the horizontal lines represent the mean value.
mined by Cross et al. (2007). The variability of the estimated density is in general higher than that of the collection effi-ciency. Part of this variability is probably due to the higher uncertainty of the estimated density given the relatively low contribution of OA (a little less than 30% on average) to the submicrometer PM during FAME-2008. Part of it may also be due to changes in the morphology of the OA during the study including its partial dissolution in the aqueous phase and a corresponding change of its density.
To test the robustness of the calculated CE we repeated the optimization assuming a constant density of 1.3 g cm−3 for
the OA during the whole campaign. The average calculated CE for this case was within 1% of the values calculated based on the variable density.
2.2.2 Particle losses inside the thermodenuder
Particle losses inside the TD are caused by a combina-tion of sedimentacombina-tion, diffusion and thermophoresis. Losses due to sedimentation increase with increasing particle size, diffusive losses increase as particle size decreases, and losses due to thermophoresis are weakly size dependent (Burtscher et al., 2001). For FAME-2008, the total losses in the ther-modenuder are determined by comparing the SMPS number distributions of the ambient and heated samples. The size distribution during FAME-2008 was that of aged continen-tal aerosol with relatively few particles smaller than 50 nm (Pikridas et al., 2010). With the exception of six nucleation events that lasted only an hour to two each during the month of the measurements, the distribution was quite stable. This stability resulted in approximately constant number losses in the TD, around 15% of the total (Fig. 3). These losses are comparable with losses in other TDs reported by Wehner et al. (2002) and Huffman et al. (2008).
Since sedimentation, diffusional, and thermophoretic pro-cesses are size- and temperature-dependent, the total mass losses may be size and temperature dependent. We explored these dependencies by plotting the losses as a function of the particle fraction smaller than 0.1 µm and also as a function of temperature (not shown). The losses were not strongly size-dependent but more strongly temperature-size-dependent. Based on these results we assumed that the losses are size inde-pendent but are different for each sample and temperature (we did not assume a constant 15% loss). Therefore, we use a size-independent correction factor that is determined for each sample (every 24 min). For the higher temperatures the losses were higher than average and around 20%.
A potential complication in our approach is that the shape of the particles may change during their evaporation in the TD. If a particle of a given mass is not spherical then not only its volume changes but also its aerodynamic diameter. This results in the shifting of the size distribution both hori-zontally and vertically during the matching and our algorithm is quite sensitive to these changes. This issue has been dis-cussed by Kostenidou et al. (2007) in their analysis of the sensitivity of the algorithm to shape changes. We repeated the analysis for different values of the shape factor,χ. The error score of the algorithm increases significantly if a non-unity value of the shape factor is used. The minimum error corresponds toχ=1 and the error atχ=1.03 is double that of theχ=1 case. Even more importantly, when a value of 1.03 was used the same collection efficiency was calculated for the thermodenuded particles. The estimated density on the other hand increases significantly forχexceeding unity. These results support the robustness of the calculated collec-tion efficiency.
Our methodology implicitly assumes that the particles are internally mixed. This assumption is supported by the lack of local sources affecting the site during FAME-2008 (Hilde-brandt et al., 2010; Pikridas et al., 2010), the lack of particles
* +
, * !
( ) - )
-)
%
Fig. 3.Number concentrations in the thermodenuder (TD) vs. am-bient aerosol number concentrations for FAME-2008. The line is a linear fit ofy=0.85x. Each data point is the average of 24 min.
smaller than approximately 50 nm during the periods with-out nucleation (Pikridas et al., 2010), and the significant res-idence time of particles in the atmosphere (more than a day during most of the study) before reaching the site. All of these suggest that the particles in this site (as in most remote sites) were quite close to the internally mixed state.
The error introduced by the simplification of a size-independent loss correction and the assumption of internally mixed particles are examined in the next section.
2.2.3 Algorithm consistency check
Since the aerosol volatility measurement combines the AMS, which provides a mass distribution as a function of aerody-namic diameter, and the SMPS, which measures a number distribution as a function of a mobility diameter, a consis-tency check between the AMS and SMPS can be made ac-counting for estimated losses inside the thermodenuder and the calculated changes in organic aerosol density and the AMS collection efficiency. The check is made by calculating the evaporated SMPS number and volume distributions from the corresponding ambient measurements and then compar-ing them with the SMPS measurements after the thermode-nuder. This procedure uses the measured OA mass distribu-tion from the AMS, the aerosol composidistribu-tion measured also by the AMS, and the estimated number losses, OA density, and collection efficiency.
The aerosol volume fraction remaining (VFR) after heat-ing, correcting for the TD losses, varying CE and density, is estimated based on the AMS measurements as:
VFR=
[OA]TD
ρorg TD+[Sulfates]TD
ρa/s+[Water]TD
ρw
[OA]ambρ
org amb+[Sulfates]amb
ρa/s+[Water]amb
ρw
(2)
·CEamb
CETD
· 1
where subscript TD represents a sample that passes through the TD, subscript amb represents a sample that bypasses the TD (i.e. ambient sample), [OA] is the mass concentration of organic aerosol, [Sulfates] is the mass concentration of am-monium sulfate or bisulfate, [Water] is the mass concentra-tions of water,ρa/s is the density of the ammonium sulfate,
ρw is the water density, ρorg is the OA density estimated
by the optimization algorithm of Kostenidou et al. (2007) (Fig. 3), CEamb is the collection efficiency of the AMS for
the ambient sample, CETDis the CE for the thermodenuded
sample, andfN is the fraction of particle number losses in the TD, calculated based on the SMPS number distributions of the ambient and heated samples. The concentrations of other PM1 components (nitrates, chloride, EC) were very
small during FAME-2008 (Pikridas et al., 2010) and are not included in this ratio. The diameter of an evaporated particle, Dp,TDis given by:
Dp,TD=Dp,amb(VFR)1/3 (3)
where Dp,amb is the diameter of the ambient (bypassed)
aerosol. Then the estimated evaporated number distribution after the TD,nn(Dp,TD), is given by:
nn(Dp,TD)=nn(Dp,amb)·(dDp,ambdDp,TD)·(1−fN) (4)
wherenn(Dp,amb)is the ambient number distribution from
the SMPS. Likewise the estimated evaporated volume distri-bution,nv(Dp,TD), can be represented as:
nv(Dp,TD)=nv(Dp,amb)·(dDp,ambdDp,TD)·(1−fN) (5)
wherenv(Dp,amb)is the ambient volume distribution from
the SMPS.
The estimated evaporated number and volume distribu-tions (Eqs . 4 and 5) were compared with the actual thermod-enuded number and volume distributions, respectively, for consistency in our analysis algorithm and the corresponding AMS and SMPS measurements. Typical results are shown in Figs. 4 and 5. The predicted evaporated distributions are in agreement with the actual thermodenuded distributions for all particle diameters. This confirms that (1) the losses were not strongly size-dependent for this dataset, (2) the method for the post-correction for the losses inside the TD and the changes in the AMS CE and organic aerosol density during heating is reasonable, (3) the measurements from the AMS and SMPS are consistent with each other and organic in-formation from the AMS can be used to estimate the actual evaporated fraction of organic aerosol as a function time and temperature for the FAME-2008 period. This test also shows that there was not complete evaporation of a significant frac-tion of particles (the number distribufrac-tions would not match in that case) and supports our assumptions that the particles were internally mixed, of a size independent CE and a prac-tically spherical shape of the thermodenuded particles (both the number and volume distributions would not match if any of these were not true).
2.2.4 Multi-component organic aerosol evaporation model
In the last step of the analysis, a mass transfer model (Lee, 2010; Riipinen et al., 2010) is used to simulate the time-dependent evaporation of the aerosol in the thermodenuder. The model is based on the volatility basis set approach, where effective saturation concentrations are predetermined using a lognormally spaced fixed basis set (Donahue et al., 2006), and it assumes that organic vapors are in equilibrium with the aerosol phase at the entrance of the TD. The tem-perature profile in the heating section is simulated based on piecewise polynomial fits to the measured temperature pro-file in the heating section for the flow rates used in the study (Fig. 1).
Besides the volatility distribution, also other properties – particularly the vaporization enthalpies and mass accommo-dation coefficients – of the aerosol constituents affect their evaporation in the TD. An effective vaporization enthalpy of 80 kJ mol−1 is used for the aerosol as a base case. The
effective mass accommodation coefficient is chosen to be 0.05, consistent with the TD results by Lee (2010) for bio-genic SOA evaporation. There is no quantitative informa-tion about the accommodainforma-tion coefficients of organic aerosol constituents available in the current literature (Kulmala and Wanger, 2001; Kolb et al., 2010) however low accommo-dation coefficients of organic aerosol have been reported (Grieshop et al., 2007, 2009b; Saleh et al., 2009; Lee, 2010). The corresponding average volatility distribution of the am-bient organic aerosol is then estimated by letting the volatility distribution vary and minimizing the sum of the squared dif-ferences between the MFR model predictions and the ther-modenuder measurements. The aerosol was approximated with a monodisperse aerosol with a diameter of 300 nm, the median diameter of the average volume distribution during FAME-2008 (Pikridas et al., 2010). Use of the full distri-bution resulted in differences in evaporated mass fraction of only a few percent but increased the optimization time con-siderably.
3 Results and discussion
3.1 Volatility of organic aerosol
'
-.
'
/
( )
%& ' ' '
0 ' '
'
1
.
'
/
2
.
( )
%& ' ' '
0 ' '
Fig. 4. Number and volume distributions of ambient aerosol and thermodenuded aerosol while TD was operated at 106◦C during 01:00–02:00 a.m. on 2 June. Also plotted is the predicted aerosol distribution accounting for both the changes in the AMS CE and density and the losses in the TD system. The fraction of number losses (fN) was 0.140, and the collection efficiencies for the TD
and ambient samples were 0.85 and 0.90, respectively.
temperature (around 30% differences in MFR) since the par-ticle losses inside the TD are greater at higher temperature.
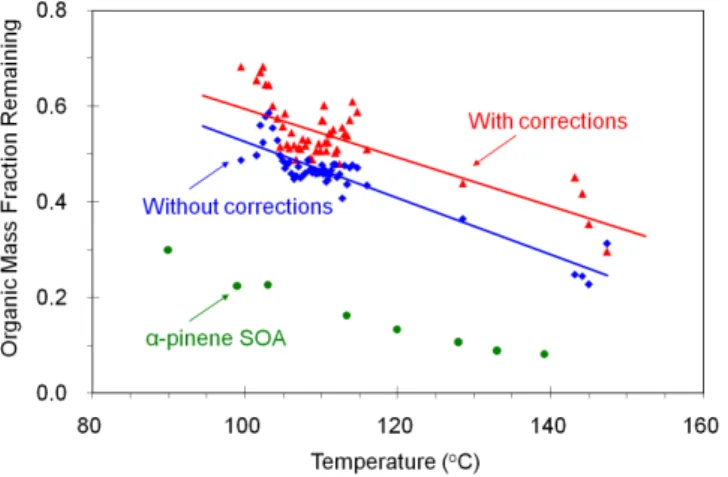
The ambient aerosol during FAME-2008 was much less volatile than fresh laboratory-generatedα-pinene SOA (gen-erated in the same manner as Lee, 2010) of the same average size (Fig. 6). This is due to the fact that the ambient aerosol during FAME-2008 was highly oxidized as suggested by its organic mass spectrum (Hildebrandt et al., 2010) due to the strong oxidizing conditions and remote sampling site without local sources (Pikridas et al., 2010). More detailed analyses of the AMS spectra from the ambient measurements are pre-sented elsewhere (Hildebrandt et al., 2010). Approximately 70% of the OA evaporated at 150◦C for a residence time of 14 s. The evaporated fraction increased to 80% at this temperature after 105 s in the heating zone. This suggests that most of the OA even after significant aging in the at-mosphere appears to be semivolatile in the TD operating at 150◦C. The mass spectra of the ambient OA and the OA left after passing through the TD were surprisingly similar (Hildebrandt et al., 2010).
'
-.
'
/
( )
%& ' ' '
0 ' '
'
1
.
'
/
2
.
( )
%& ' ' '
0 ' '
Fig. 5. Number and volume distributions of ambient aerosol and thermodenuded aerosol while TD was operated at 108◦C during 05:00–06:00 p.m. on 3 June. Also plotted is the predicted aerosol distribution accounting for both the changes in the AMS CE and density and the losses in the TD system. The fraction of number losses (fN) was 0.153, and the collection efficiencies for the TD
and ambient samples were 0.80 and 0.95, respectively.
3.2 OA volatility distribution
Three different sets of four logarithmically-spaced volatility bins were used in the simulations: one ranging from effec-tive saturation concentration at 298 K of 0.001 to 1 µg m−3,
one from 0.01 to 10 µg m−3, and one from 0.1 to 100 µg m−3.
Fig. 6. Mass fraction remaining after heating in the TD (for 14 s) as a function of temperature for uncorrected TD-AMS data, cor-rected (for the losses in TD and the changes in AMS collection efficiency and density) data during FAME-2008. Each data point is the average of 30 MFR data sets (each MFR data set is 24 min averaged). Also plotted is the thermogram of fresh lab-generatedα -pinene SOA with mass concentration of approximately 10 µg m−3 and size of approximately 250 nm. Lines are linear fits to guide the eye.
duplicating the data points in the 105 s data set to yield the same number of data points as in the 14 s data set.
The aerosol mass fractions corresponding to the best fit in the base case runs are given in Table 1. These results suggest that 70% of the OA had effective saturation con-centrations of 1 µg m−3 or less at 298 K. The observations
can be explained with all the OA being semivolatile (C∗≥ 10−2µg m−3). However, the lack of measurements at much
higher temperatures leaves open the possibility of existence of a non-volatile fraction (less than 20%) of the OA. The measurement data for the two residence times and the mod-eled MFR are illustrated in Fig. 7.
The measurements were designed to explore the link be-tween OA composition (as measured by the AMS) and its volatility with most of the measurements performed at 110◦C corresponding to the evaporation of approximately half of the FAME-2008 OA. The surprising result of the study was that the AMS OA spectrum showed little variabil-ity during the whole month of the FAME-2008 study (Hilde-brandt et al., 2010). While this could be seen as an advantage because it allows us to analyze our measurements together, it resulted in a sub-optimal distribution of measurements (too many of them at the same residence time and temperature and fewer in the rest of the space). Despite this, given the little variability of the investigated OA and its volatility and the fact that each data point in Fig. 7 represents an average of approximately 30 h of measurements our results at different residence times and temperatures are relatively robust. This also allows us, at least as a first approximation, to analyze all the measurements together.
Fig. 7. The modeled mass fractions remaining (lines, see Table 1 for details) corresponding to different input data to the TD model, along with the fitting data set (markers with error bars of one stan-dard deviation). Each data point is the average of 30 MFR data sets (each MFR data set is 24 min averaged). The base case runs (lines) and the runs corresponding to maximum (lighter shaded areas) and minimum (darker shaded areas) variation in MFR upon anX±0.1 shift in the volatility distribution.
The sensitivity of the results was tested by letting the mass fraction vary by ±0.1 in one volatility bin at a time from the best fit value reported in Table 1. Since the mass frac-tions need to sum to unity, the variation in one bin was com-pensated in a corresponding opposite variation in one of the other bins, thus resulting in 12 separate sensitivity runs for the 4-bin basis set. The dark shaded areas in Fig. 7 represent the minimum variation as compared to the optimum solu-tion and correspond to the cases where the 0.1 variasolu-tion was exchanged between the two least volatile bins, keeping the higher volatility bins unchanged. The maximum sensitivity was expectedly observed for the cases where the variation was introduced in the least and most volatile bins. The sen-sitivity studies suggest that it is difficult to separate the exact distribution in the two least volatile of the bins. However, it can be concluded that the ratio between the contribution of the two least volatile bins (0.1 µg m−3 or less) and the two
most volatile bins (1–10 µg m−3) is close to 2/3, at least if
the vaporization enthalpy can be approximated with a con-stant value of 80 kJ mol−1.
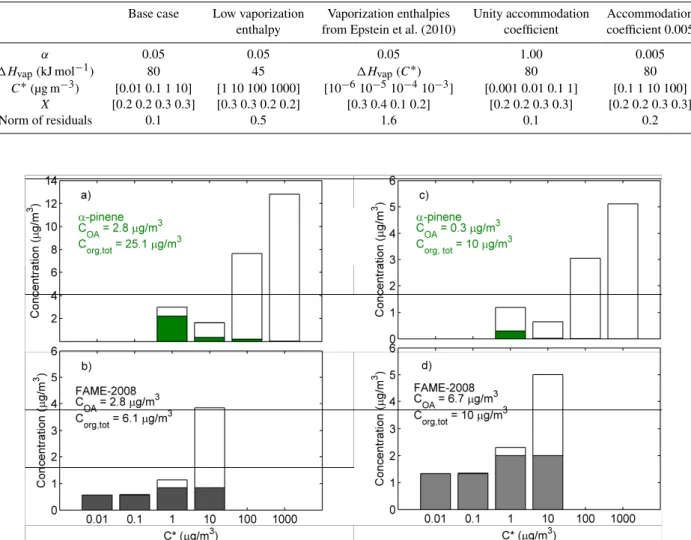
In Fig. 8, the obtained volatility distributions for to-tal organic concentration of 10 µg m−3 and total organic
aerosol concentration of 2.8 µg m−3 (the average OA
con-centration during FAME-2008) are compared to the corre-sponding distributions for fresh α-pinene SOA (produced in dark, low NOx, and low RH conditions) reported by
Table 1. The input parameters (αis the effective mass accommodation coefficient,1Hvapthe vaporization enthalpy) in the model
calcu-lations, and the corresponding mass fractions on each volatility in the aerosol phase, as determined from least squares fits of modeled to measured VFR data. The norm of residuals describes the goodness of the fit.
Base case Low vaporization Vaporization enthalpies Unity accommodation Accommodation enthalpy from Epstein et al. (2010) coefficient coefficient 0.005
α 0.05 0.05 0.05 1.00 0.005
1Hvap(kJ mol−1) 80 45 1Hvap(C∗) 80 80
C∗(µg m−3) [0.01 0.1 1 10] [1 10 100 1000] [10−610−510−410−3] [0.001 0.01 0.1 1] [0.1 1 10 100]
X [0.2 0.2 0.3 0.3] [0.3 0.3 0.2 0.2] [0.3 0.4 0.1 0.2] [0.2 0.2 0.3 0.3] [0.2 0.2 0.3 0.3]
Norm of residuals 0.1 0.5 1.6 0.1 0.2
Fig. 8. The volatility distributions of aged ambient organic aerosol during FAME-2008 (bottom) for(b) total organic concentration of 10 µg m−3 and(d)total organic aerosol concentration of 2.8 µg m−3 are compared to the corresponding distributions for(a, c)freshα
-pinene SOA (produced in dark, low NOx, and low RH conditions) reported by Pathak et al. (2007).
laboratory-generated SOA fromα-pinene ozonolysis under low NOxconditions. The volatilities ofβ-pinene SOA and
limonene SOA under the same low NOx conditions were
similar to that ofα-pinene (Lee, 2010).
As mentioned earlier, the model results are obtained as-suming a monodisperse aerosol of 300 nm. To test the sen-sitivity of the results to this assumption, we compared the simulated results of the MFRs (using the optimum volatil-ity distribution given for the baseline case in Table 1) for a monodispersed aerosol size distribution and a full size distri-bution corresponding to the mean mass size distridistri-bution dur-ing the FAME-2008 campaign. The difference in the MFR simulations using the full distribution and the monodisperse distribution was less than 2% in all the studied temperatures. The corresponding uncertainty in the fitted volatility
distri-bution is thus much less than the uncertainty related to con-straining the data in the fitting procedure.
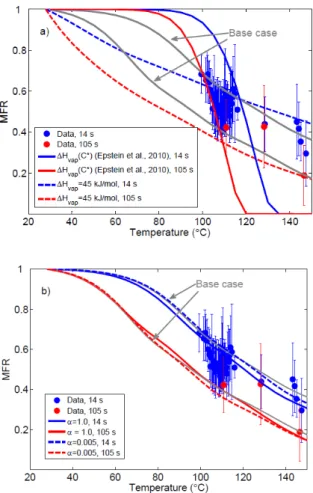
Since the predicted MFRs are likely to depend strongly on the values used for the vaporization enthalpies and mass ac-commodation coefficients of the aerosol, we tested the sensi-tivity of the obtained volatility distribution to these variables. Assuming an effective vaporization enthalpy of 45 kJ mol−1
Fig. 9.The modeled mass fractions remaining (lines, see Table 1 for details) corresponding to different input data to the TD model, along with the fitting data set (markers). Each data point is the average of 30 MFR data sets (each MFR data set is 24 min averaged). The sensitivity runs with(a)low vaporization enthalpy and vaporization enthalpy of Epstein et al. (2010),(b) unity mass accommodation coefficient and mass accommodation coefficient of 0.005. The blue color corresponds to residence time of 14 s, and the red to 105 s.
from 10−6 to 10−3µg m−3, and the predicted
temperature-dependence was considerably steeper than observed (Table 1 and Fig. 9a). Cappa and Jimenez (2010) have reached simi-lar conclusions about the importance of the vaporization en-thalpies in the interpretation of TD results. Corresponding comparisons to the case where the mass accommodation co-efficient was assumed to be unity – thus corresponding to the case of maximum evaporation – or 0.005 are also presented in Fig. 9b and Table 1. These results highlight the fact that roughly an order of magnitude change in the mass accommo-dation coefficient is “equivalent” to a corresponding change in the volatility distribution. This uncertainty could poten-tially be overcome by varying residence times in the heated section of the thermodenuder to the extent where no varia-tion with time would be seen in the MFRs – thus ensuring the uncoupling of kinetic and thermodynamic effects in the evaporation inside TDs. The volatility distributions obtained
from the fits are presented in Table 1, and the corresponding modeled MFRs in Fig. 9. The unity effective accommodation coefficient is also compatible with our measurements result-ing in an estimated volatility distribution that is roughly an order of magnitude less than theα=0.05 case.
To investigate the sensitivity of the results to the weighting of the high and low residence time data points we have fitted only the 14 s residence times neglecting the longer residence times. The best fit for the data once more corresponded to the volatility basis set [0.01, 0.1, 1, 10] but with mass fraction values [0.3, 0.2, 0.1, 0.4] instead of the basecase values [0.2, 0.2, 0.3, 0.3]. So use of the short residence time measure-ments results in an increase of the predicted material with relatively low volatility (less or equal than 0.1 micrograms per cubic meter) from 40 percent to 50 percent of the total. We also repeated the fitting exercise including the higher res-idence time results but without increasing their weight. Once more the best fit corresponded to the to the volatility basis set [0.01, 0.1, 1, 10] but with mass fraction values [0.2, 0.2, 0.2, 0.4]. These results suggest that our conclusions about the volatility distribution are relatively robust with respect to the treatment of the short and long residence time points in the optimization. While this treatment does introduce some uncertainty in the calculated volatility distributions, it does not affect our conclusion about the relatively low volatility of the organic PM during FAME-2008.
We have also tried a number of different choices of bin numbers, locations, etc. and the best fit with up to five free parameters that we were able to obtain is the one discussed above. While it is always possible that using a large number of parameters one could fit the data even better, we do find such an exercise problematic. The data that we are trying to fit correspond to two monotonically decreasing S-like curves. One can imagine a model with three maybe four free param-eters fitted to these measurements. Anything more complex than that constitutes over-fitting and the results are probably questionable.
4 Conclusions
aerosol measured during FAME-2008 is approximately two or more orders of magnitude less volatile than laboratory-generated monoterpene (α-pinene, β-pinene and limonene under low NOxconditions) SOA. Our analysis is based on
the assumption that the effect of reactions inside the TD was small or negligible. While this assumption has been used in all TD field studies, it clearly requires further investigation.
Use of two residence times allows for a more constrained determination of the aerosol volatility by – at least partly – uncoupling the kinetic and thermodynamic influences on the TD output. However, even with the two residence times used a rather wide range of effective accommodation coefficients (from 0.05 to 1) were consistent with the data resulting in significant uncertainty (almost an order of magnitude) in the estimated volatility distribution. Our analysis suggests that measurements at even higher residence times (several 100 s) may be needed to further constrain the volatility distribution of OA at these low concentration levels. This will be a major experimental challenge and will require very careful treat-ment of the particle losses inside the TD. Also better tem-poral distribution of the measurements with more measure-ments performed to investigate the effect of residence time on the measured MFR is recommended for future studies.
Acknowledgements. This research was supported by the US National Science Foundation (ATM-0732598) and the EUCAARI European Union FP6 Project.
Edited by: M. Kulmala
References
An, W. J., Pathak, R. K., Lee, B. H., and Pandis, S. N.: Aerosol volatility measurement using an improved thermodenuder: Ap-plication to secondary organic aerosol, J. Aerosol Sci., 38, 305– 314, 2007.
Bilde, M. and Pandis, S. N.: Evaporation rates and vapor pressures of individual aerosol species formed in the atmospheric oxida-tion of alpha- and beta-pinene, Environ. Sci. Technol., 35, 3344– 3349, 2001.
Burtscher, H., Baltensperger, U., Bukowiecki, N., Cohn, P., Huglin, C., Mohr, M., Matter, U., Nyeki S., Schmatloch V., Streit, N., and Weingartner, E.: Separation of volatile and non-volatile aerosol fractions by thermodesorption: Instrumental development and applications, J. Aerosol Sci., 32, 427–442, 2001.
Canagaratna, M. R., Jayne, J. T., Jimenez, J. L., Allan, J. D., Al-farra, M. R., Zhang, Q., Onasch, T. B., Drewnick, F., Coe, H., Middlebrook, A., Delia, A., Williams, L. R., Trimborn, A. M., Northway, M. J., DeCarlo, P. F., Kolb, C. E., Davidovits, P., and Worsnop, D. R.: Chemical and microphysical characterization of ambient aerosols with the Aerodyne Aerosol Mass Spectrometry, Mass Spectrom. Rev., 26, 185–222, 2006.
Cappa, C. D. and Jimenez, J. L.: Quantitative estimates of the volatility of ambient organic aerosol, Atmos. Chem. Phys., 10, 5409–5424, doi:10.5194/acp-10-5409-2010, 2010.
Clarke, A. D.: A thermo-optic technique for in-situ analysis of size-resolved aerosol physicochemistry, Atmos. Environ., 25, 635– 644, 1991.
Cross, E. S., Slowik, J. G., Davidovits, P., Allan, J. D., Worsnop, D. R., Jayne, J. T., Lewis, D. K., Canagaratna, M., and Onasch, T. B.: Laboratory and ambient particle density determinations using light scattering in conjunction with aerosol mass spectrometry, Aerosol Sci. Technol., 41, 343–359, 2007.
DeCarlo, P. F., Kimmel, J. R., Trimborn, A. M., Northway, M. J., Jayne, J. T., Aiken, A. C., Gonin, M., Fuhrer, K., Hor-vath, T., Docherty, K. S., Worsnop, D. R., and Jimenez, J. L.: Field-Deployable, High-Resolution, Time-of-Flight Aerosol Mass Spectrometer, Anal. Chem., 78, 8281–8289, 2006. Denkenberger, K. A., Moffet, R. C., Holecek, J. C., Rebotier, T. P.,
and Prather, K. A.: Real-time, single-particle measurements of oligomers in aged ambient aerosol particles, Environ. Sci. Tech-nol., 41, 5439–5446, 2007.
Donahue, N. M., Robinson, A. L., Stanier, C. O., and Pandis, S. N.: Coupled partitioning, dilution, and chemical aging of semivolatile organics, Environ. Sci. Technol., 40, 2635–2643, 2006.
Engler, C., Rose, D., Wehner, B., Wiedensohler, A., Brggemann, E., Gnauk, T., Spindler, G., Tuch, T., and Birmili, W.: Size distribu-tions of non-volatile particle residuals (Dp<800 nm) at a rural site in Germany and relation to air mass origin, Atmos. Chem. Phys., 7, 5785–5802, doi:10.5194/acp-7-5785-2007, 2007. Engelhart, G. J., Hildebrandt, L., Kostenidou, E., Mihalopoulos,
N., Donahue, N. M., and Pandis, S. N.: Water content of aged aerosol, Atmos. Chem. Phys. Discuss., 10, 21653–21681, doi:10.5194/acpd-10-21653-2010, 2010.
Epstein, S. A., Riipinen, I., and Donahue, N. M.: A semi-empirical correlation between enthalpy of vaporization and saturation con-centration, Environ. Sci. Technol., 44, 743–748, 2010.
Faulhaber, A. E., Thomas, B. M., Jimenez, J. L., Jayne, J. T., Worsnop, D. R., and Ziemann, P. J.: Characterization of a thermodenuder-particle beam mass spectrometer system for the study of organic aerosol volatility and composition, Atmos. Meas. Tech., 2, 15–31, doi:10.5194/amt-2-15-2009, 2009. Gerasopoulos, E., Koulouri, E., Kalivitis, N., Kouvarakis, G.,
Saarikoski, S., M¨akel¨a, T., Hillamo, R., and Mihalopoulos, N.: Size-segregated mass distributions of aerosols over East-ern Mediterranean: seasonal variability and comparison with AERONET columnar size-distributions, Atmos. Chem. Phys., 7, 2551–2561, doi:10.5194/acp-7-2551-2007, 2007.
Grieshop, A. P., Donahue, N. M., and Robinson, A. L.: Is the gas-particle partitioning in alpha-pinene secondary or-ganic aerosol reversible?, Geophys. Res. Lett., 34, L14810, doi:10.1029/2007GL029987, 2007.
Grieshop, A. P., Logue, J. M., Donahue, N. M., and Robinson, A. L.: Laboratory investigation of photochemical oxidation of or-ganic aerosol from wood fires 1: measurement and simulation of organic aerosol evolution, Atmos. Chem. Phys., 9, 1263–1277, doi:10.5194/acp-9-1263-2009, 2009a.
Grieshop, A. P., Miracolo, M. A., Donahue, N. M., and Robinson, A. L.: Constraining the volatility distribution of gas-particle par-titioning of combustion aerosols using isothermal dilution and thermodenuder measurements, Environ. Sci. Technol., 43, 4750– 4756, 2009b.
V. A., Bougiatioti, A., DeCarlo, P. F., Prevot, A. S. H., Bal-tensperger, U., Mihalopoulos, N., Donahue, N. M., and Pandis, S. N.: Aged organic aerosol in the Eastern Mediterranean: the Fi-nokalia Aerosol Measurement Experiment - 2008, Atmos. Chem. Phys., 10, 4167–4186, doi:10.5194/acp-10-4167-2010, 2010. Huffman, J. A., Jayne, J. T., Drewnick, F., Aiken, A. C., Onasch,
T., Worsnop, D. R., and Jimenez J. L.: Design, modeling, opti-mization, and experimental tests of a particle beam width probe for the Aerodyne Aerosol Mass Spectrometer, Aerosol Sci. Tech-nol., 39, 1143–1163, 2005.
Huffman, J. A., Ziemann, P. J., Jayne J. T., Worsnop, D. R., and Jimenez, J. L.: Development and characterization of a fast-stepping/scanning thermodenuder for chemically-resolved aerosol volatility measurement, Aerosol Sci. Technol. 42, 395– 407, 2008.
Huffman, J. A., Docherty, K. S., Mohr, C., Cubison, M. J., Ul-brich, I. M., Ziemann, P. J., Onasch, T. B., and Jimenez, J. L.: Chemically-resolved volatility measurements of organic aerosol from different source, Environ. Sci. Technol., 43, 5351-5-357, 2009.
Jayne, J. T., Leard, D. C., Zhang, X., Davidovits, P., Smith, K. A., Kolb, C. E., and Worsnop D. R.: Development of an aerosol mass spectrometer for size and composition analysis of submicron par-ticles, Aerosol Sci. Technol., 33, 49–70, 2000.
Jimenez, J. L., Jayne, J. T., Shi, Q., Kolb C. E., Worsnop D. R., Yourshaw, I., Seinfeld, J. H., Flagan, R. C., Zhang, X., Smith K. A., Morris, J. W., and Davidotis, P.: Ambient aerosol sampling with an aerosol mass spectrometer, J. Geophys. Res., 108(D7), 8425, doi:10.1029/2001JD001213, 2003.
Jonsson, A. M., Hallquist, M., and Saathoff, H.: Volatility of sec-ondary organic aerosols from the ozone initiated oxidation ofα -pinene and limonene, J. Aerosol Sci., 38, 843–852, 2007. Kanakidou, M., Seinfeld, J. H., Pandis, S. N., Barnes, I., Dentener,
F. J., Facchini, M. C., Van Dingenen, R., Ervens, B., Nenes, A., Nielsen, C. J., Swietlicki, E., Putaud, J. P., Balkanski, Y., Fuzzi, S., Horth, J., Moortgat, G. K., Winterhalter, R., Myhre, C. E. L., Tsigaridis, K., Vignati, E., Stephanou, E. G., and Wilson, J.: Organic aerosol and global climate modelling: a review, At-mos. Chem. Phys., 5, 1053–1123, doi:10.5194/acp-5-1053-2005, 2005.
Kolb, C. E., Cox, R. A., Abbatt, J. P. D., Ammann, M., Davis, E. J., Donaldson, D. J., Garrett, B. C., George, C., Griffiths, P. T., Hanson, D. R., Kulmala, M., McFiggans, G., P¨oschl, U., Riipinen, I., Rossi, M. J., Rudich, Y., Wagner, P. E., Winkler, P. M., Worsnop, D. R., and O’ Dowd, C. D.: An overview of current issues in the uptake of atmospheric trace gases by aerosols and clouds, Atmos. Chem. Phys., 10, 10561–10605, doi:10.5194/acp-10-10561-2010, 2010.
Kostenidou, E., Pathank, R. K., and Pandis, S. N.: An algorithm for the calculation of secondary organic aerosol density combining AMS and SMPS data, Aerosol Sci. Technol., 41, 1002–1010, 2007.
Kostenidou, E., Lee, B. H., Engelhart, G. J., Pierce, J. R., and Pandis, S. N.: Mass spectra deconvolution of low, medium and high volatility biogenic secondary organic aerosol, Environ. Sci. Technol., 43, 4884–4889, 2009.
Kulmala, M. and Wagner, P. E.: Mass accommodation and uptake coefficients-a quantitative comparison, J. Aerosol Sci., 32, 833– 841, 2001.
Kulmala, M., Asmi, A., Lappalainen, H. K., Carslaw, K. S., P¨oschl, U., Baltensperger, U., Hov, Ø., Brenquier, J.-L., Pandis, S. N., Facchini, M. C., Hansson, H.-C., Wiedensohler, A., and O’Dowd, C. D.: Introduction: European Integrated Project on Aerosol Cloud Climate and Air Quality interactions (EUCAARI) - integrating aerosol research from nano to global scales, At-mos. Chem. Phys., 9, 2825–2841, doi:10.5194/acp-9-2825-2009, 2009.
Lee, B. H.: Volatility of Atmospheric Organic Aerosol, Ph.D. thesis, Carnegie Mellon University, Department of Chemical Engineer-ing, Pittsburgh, Pennsylvania, 2010.
Matthew, B. M., Middlebrook, A. M., and Onasch, T. B.: Collection efficiencies in an Aerodyne aerosol mass spectrometer as a func-tion of particle phase for laboratory generated aerosols, Aerosol Sci. Technol., 42, 884–898, 10.1080/02786820802356797, 2008.
Pathak, R. K., Presto, A. A., Lane, T. E., Stanier, C. O., Donahue, N. M., and Pandis, S. N.: Ozonolysis ofα-pinene: parameterization of secondary organic aerosol mass fraction, Atmos. Chem. Phys., 7, 3811–3821, doi:10.5194/acp-7-3811-2007, 2007.
Pikridas, M., Bougiatioti, A., Hildebrandt, L., Engelhart, G. J., Kostenidou, E., Mohr, C., Pr´evˆot, A. S. H., Kouvarakis, G., Zarmpas, P., Burkhart, J. F., Lee, B.-H., Psichoudaki, M., Mi-halopoulos, N., Pilinis, C., Stohl, A., Baltensperger, U., Kulmala, M., and Pandis, S. N.: The Finokalia Aerosol Measurement Ex-periment - 2008 (FAME-08): an overview, Atmos. Chem. Phys., 10, 6793–6806, doi:10.5194/acp-10-6793-2010, 2010.
Pinnick, R. G., Jennings, S. G., and Fernandez, G.: Volatility of aerosols in the arid southwestern united states, J. Atmos. Sci., 44, 562–576, 1987.
Riipinen I., Pierce, J. R., Donahue, N. M., and Pandis, S. N.: Equi-libration time scales of organic aerosol inside thermodenuders: Kinetics versus equilibrium thermodynamics, Atmos. Environ., 44, 597–607, 2010.
Saleh, R., Shihadeh, A., and Khlystov, A.: Determination of evapo-ration coefficients of semivolatile organic aerosols using an inte-grated volume-tandem differential mobility analysis (IV-TDMA) method, J. Aerosol Sci., 40, 1019–1029, 2009.
Slowik, J. G., Stainken, K., Davidovits, P., Williams, L. R., Jayne, J. T., Kolb, C. E., Worsnop, D. R., Rudich, Y., DeCarlo P. F., and Jimenez, J. L.: Particle morphology and density characteriza-tion by combined mobility and aerodynamic diameter measure-ments. Part 2: Application to combustion-generated soot aerosols as a function of fuel equivalence ratio, Aerosol Sci. Technol., 38, 1206–1222, 2004.
Wehner, B., Philippin, S., and Wiedensohler, A.: Design and cal-ibration of a thermodenuder with an improved heating unit to measure the size-dependent volatile fraction of aerosol particles, J. Aerosol Sci., 33, 1087–1093, 2002.
Wu, Z. J., Poulain, L., Wehner, B., Wiedensohler, A., and Her-rmann, H.: Characterization of the volatile fraction of laboratory-generated aerosol particles by thermodenuder-aerosol mass spec-trometer coupling experiments, J. Aerosol Sci., 40, 603–612, 2009.