ACPD
10, 17435–17466, 2010Measurement of the ambient organic aerosol volatility
distribution
B. H. Lee et al.
Title Page
Abstract Introduction
Conclusions References
Tables Figures
◭ ◮
◭ ◮
Back Close
Full Screen / Esc
Printer-friendly Version Interactive Discussion
Discussion
P
a
per
|
Dis
cussion
P
a
per
|
Discussion
P
a
per
|
Discussio
n
P
a
per
|
Atmos. Chem. Phys. Discuss., 10, 17435–17466, 2010 www.atmos-chem-phys-discuss.net/10/17435/2010/ doi:10.5194/acpd-10-17435-2010
© Author(s) 2010. CC Attribution 3.0 License.
Atmospheric Chemistry and Physics Discussions
This discussion paper is/has been under review for the journal Atmospheric Chemistry and Physics (ACP). Please refer to the corresponding final paper in ACP if available.
Measurement of the ambient organic
aerosol volatility distribution: application
during the Finokalia Aerosol
Measurement Experiment (FAME-2008)
B. H. Lee1, E. Kostenidou2,3, L. Hildebrandt1, I. Riipinen1,4, G. J. Engelhart1, C. Mohr5, P. F. DeCarlo5, N. Mihalopoulos6, A. S. H. Prevot5, U. Baltensperger5, and S. N. Pandis1,2,3
1
Department of Chemical Engineering, Carnegie Mellon University, Pittsburgh, PA, USA
2
Department of Chemical Engineering, University of Patras, Patra, Greece
3
Inst. of Chemical Eng. and High Temperature Chemical Processes, ICE-HT, Patra, Greece
4
Department of Physics, University of Helsinki, Helsinki, Finland
5
Paul Scherrer Institute, Laboratory of Atmospheric Chemistry, 5232 Villigen, Switzerland
6
University of Crete, Department of Chemistry, Heraklion, Greece
Received: 16 June 2010 – Accepted: 5 July 2010 – Published: 20 July 2010 Correspondence to: S. N. Pandis ([email protected])
ACPD
10, 17435–17466, 2010Measurement of the ambient organic aerosol volatility
distribution
B. H. Lee et al.
Title Page
Abstract Introduction
Conclusions References
Tables Figures
◭ ◮
◭ ◮
Back Close
Full Screen / Esc
Printer-friendly Version Interactive Discussion
Discussion
P
a
per
|
Dis
cussion
P
a
per
|
Discussion
P
a
per
|
Discussio
n
P
a
per
|
Abstract
A variable residence time thermodenuder (TD) was combined with an Aerodyne Aerosol Mass Spectrometer (AMS) and a Scanning Mobility Particle Sizer (SMPS) to measure the volatility distribution of aged organic aerosol in the Eastern Mediterranean during the Finokalia Aerosol Measurement Experiment in May of 2008 (FAME-2008).
5
A new method for the quantification of the organic aerosol volatility distribution was developed combining measurements of all three instruments together with an aerosol dynamics model.
Challenges in the interpretation of ambient thermodenuder-AMS measurements in-clude the potential resistances to mass transfer during particle evaporation, the effects
10
of particle size on the evaporated mass fraction, the changes in the AMS collection efficiency and particle density as the particles evaporate partially in the TD, and finally potential losses inside the TD. Our proposed measurement and data analysis method accounts for all of these problems combining the AMS and SMPS measurements.
The AMS collection efficiency of the aerosol that passed through the TD was found
15
to be approximately 10% lower than the collection efficiency of the aerosol that passed through the bypass. The organic aerosol measured at Finokalia is approximately 2 orders of magnitude less volatile than fresh laboratory-generated biogenic secondary organic aerosol. This low volatility is consistent with its highly oxygenated AMS mass spectrum. The results are found to be highly sensitive to the mass accommodation
20
coefficient of the evaporating species.
1 Introduction
Atmospheric particulate matter contains a variety of both inorganic and organic com-pounds. Organic compounds often are the major fraction of fine particulate matter, contributing 20–90% to its mass depending on the location and season (Kanakidou et
25
ACPD
10, 17435–17466, 2010Measurement of the ambient organic aerosol volatility
distribution
B. H. Lee et al.
Title Page
Abstract Introduction
Conclusions References
Tables Figures
◭ ◮
◭ ◮
Back Close
Full Screen / Esc
Printer-friendly Version Interactive Discussion
Discussion
P
a
per
|
Dis
cussion
P
a
per
|
Discussion
P
a
per
|
Discussio
n
P
a
per
|
or formed in the atmosphere by condensation of low vapor pressure products of the oxidation of volatile organic compounds (VOCs) (secondary organic aerosol, SOA). Since the oxidation pathways for VOCs are complex and the reactions lead to several sets of oxygenated products, our understanding of organic aerosol formation mech-anisms and their chemical and physical properties is still incomplete. The volatility
5
of atmospheric organic aerosol (OA) is one of its most important physical properties determining its ambient concentration. The OA volatility distribution provides indirect information about its chemical composition and can reflect its origin and history in the atmosphere (Jonsson et al., 2007).
Volatility measurements have been performed for over four decades. The general
10
method for volatility measurement is to pass the aerosol through a heated tube in which the more volatile components evaporate leaving less volatile components behind in the particulate phase to be detected and analyzed by various instruments downstream of the heated flow tube. For example, Pinnick et al. (1987) used a light scattering aerosol counter downstream of a fused-quartz tube wrapped with a nichrome ribbon heating
15
element to gain information about the composition of ambient aerosol at a rural site in southern New Mexico. Clarke (1991) used six heated tubes in front of differential mobility analyzer (DMA) and a laser optical particle counter to obtain size dependent measurement of aerosol volatility. Burtscher et al. (2001) improved the simple heated tube method by developing a thermodenuder (TD) which is a heated flow tube followed
20
by an adsorption/cooling section in which gases are removed by adsorption onto acti-vated charcoal to avoid potential recondensation. Wehner et al. (2002) improved the design further by improving the homogeneity of the temperature profile and increasing the residence time in the heating section. Numerous TDs have been designed and built upon the ideas of Burtscher et al. (2001) and Wehner et al. (2002); however the
25
ACPD
10, 17435–17466, 2010Measurement of the ambient organic aerosol volatility
distribution
B. H. Lee et al.
Title Page
Abstract Introduction
Conclusions References
Tables Figures
◭ ◮
◭ ◮
Back Close
Full Screen / Esc
Printer-friendly Version Interactive Discussion
Discussion
P
a
per
|
Dis
cussion
P
a
per
|
Discussion
P
a
per
|
Discussio
n
P
a
per
|
aerosol volatility and suggested that TDs need to be operated at a range of residence times due to the potential resistances to mass transfer from the particulate to the gas phase.
Volatility measurements of organic aerosol have received considerable attention re-cently and have been carried out both in the field (Engler et al., 2007; Huffman et al.,
5
2009) and in the laboratory (An et al., 2007; Jonsson et al., 2007; Faulhaber et al., 2009). Lee et al. (2010) used an aerosol dynamics model based on the volatility basis set (VBS) approach (Donahue et al., 2006) and SOA yield parameters derived from smog chamber studies to show that, due to mass transfer resistances in the particulate phase or at the interface, an effective accommodation coefficient of 0.05 was needed
10
for the description of at least the early stage of the evaporation. Using the model, they suggested that particles do not reach equilibrium with the surrounding gas phase even after 16 s. Riipinen et al. (2010) have estimated that ambient aerosol almost never reaches equilibrium inside TDs, and therefore TDs provide information on the evapora-tion rates of particles and not directly on their equilibrium states. Extracting the volatility
15
of OA from the TD measurements requires use of mass transfer models that can ac-count for the effects of particle size, concentration and mass transfer resistances.
Recently, TD systems have been combined with Aerosol Mass Spectrometers (AMSs) (Jayne et al., 2000; Jimenez et al., 2003; DeCarlo et al., 2006) to obtain in-formation about the relationships between the aerosol composition and its volatility
20
(Faulhaber et al., 2009; Grieshop et al., 2009; Huffman et al., 2009; Kostenidou et al., 2009). The challenges in the interpretation of ambient TD-AMS measurements, which include the potential resistances to mass transfer during particle evaporation, the role of particle size, the changes in the AMS collection efficiency and particle density as the particles evaporate partially during heating, and finally potential losses inside the
ther-25
ACPD
10, 17435–17466, 2010Measurement of the ambient organic aerosol volatility
distribution
B. H. Lee et al.
Title Page
Abstract Introduction
Conclusions References
Tables Figures
◭ ◮
◭ ◮
Back Close
Full Screen / Esc
Printer-friendly Version Interactive Discussion
Discussion
P
a
per
|
Dis
cussion
P
a
per
|
Discussion
P
a
per
|
Discussio
n
P
a
per
|
In this study, a variable residence time thermodenuder, a Quadruple-AMS and a Scanning Mobility Particle Sizer (SMPS), were combined to investigate the volatility of organic aerosol in the Eastern Mediterranean during the Finokalia Aerosol Measure-ment ExperiMeasure-ment – 2008 (FAME-2008). A new data analysis method, which addresses the challenges of ambient TD-AMS measurements, is applied for the quantification of
5
the organic aerosol volatility distribution.
2 Methods
2.1 Field operation of thermodenuder-AMS system
Aerosol volatility measurements were made using a thermodenuder-AMS system in the May 2008 EUCAARI (European Integrated Project on Aerosol Cloud Climate Air
10
Quality Interactions) intensive campaign (Kulmala et al., 2009). The measurements took place during 8 May–9 June 2008 at a remote sampling site close to Finokalia in Crete, Greece. There were no local sources close-by, allowing the study of aged organic aerosol from different source regions (Pikridas et al., 2010).
The thermodenuder (TD) used is based on the design of Wehner et al. (2002) and
15
An et al. (2007). It consists of two parts; a heating section followed by organic va-por adsorption and cooling section. The heating section consists of two concentric stainless steel tubes, 55 cm in length, wrapped in a heating tape (OMEGALUX, HTWC 102-010). The aerosol flows through the inner tube (3.5 cm ID), and fine sand occupied the space between the outer (6 cm ID) and the inner tube to retain a uniform internal
20
temperature profile. The outer tube is wrapped in the heating tape with a percent-age controller which semi-automatically controls temperature in the heating tube. The TD temperature remains stable within 1◦C for several hours at various flow rates and temperature up to 250◦C. The temperature profile was measured with a 60 cm long thermocouple (OMEGACLAD, KQXL-18E) positioned in the center of the heating tube
25
ACPD
10, 17435–17466, 2010Measurement of the ambient organic aerosol volatility
distribution
B. H. Lee et al.
Title Page
Abstract Introduction
Conclusions References
Tables Figures
◭ ◮
◭ ◮
Back Close
Full Screen / Esc
Printer-friendly Version Interactive Discussion
Discussion
P
a
per
|
Dis
cussion
P
a
per
|
Discussion
P
a
per
|
Discussio
n
P
a
per
|
centerline residence times of the aerosol in the heating section are 14 s and 105 s, respectively. As shown on Fig. 1, the temperature increases relatively slowly at the entrance of the heating tube and reaches the maximum temperature at around 25 cm from the entrance staying within±3◦C of this value before falling near the exit, 50 cm
from the entrance, of the heating tube. This maximum temperature will be referenced
5
for each measurement and the measured temperature profile will be used for the anal-ysis.
The adsorption/cooling section, 45 cm in length, has a tubular mesh (3.5 cm ID) in-side the stainless steel tube (6.5 cm ID) to hold activated carbon (Fisher Scientific, 6–14 Mesh). The connection, a 3.5 cm ID stainless steel tube, between the heating
10
and adsorption/cooling section is insulated by fiberglass in order to prevent potential re-condensation due to cooling.
A Quadrupole Aerodyne Aerosol Mass Spectrometer and a Scanning Mobility Par-ticle Sizer (SMPS, TSI 3936), placed downstream of the thermodenuder, were com-bined to investigate the volatility of organic aerosol during FAME-2008. During
ambi-15
ent aerosol sampling, particles passed alternatively through the thermodenuder or the bypass line (0.25 inch, copper tube). The aerosol flow direction was controlled by three-way solenoid valves (Alcon, U33-42-21-12). The valves were automatically switched using Labview and FieldPoint units (National Instruments, FP-1000, FP-RLY-422, and FP-TC-120). Switching between the ambient and thermodenuded measurements
oc-20
curred every 12 min. Particles exiting or bypassing the thermodenuder were split into two streams; one entering the SMPS, the other going to the AMS for real-time size and composition measurements at various temperatures. The comprehensive analysis of AMS spectra is presented by Hildebrandt et al. (2010). Three thermocouples (OMEGA-CLAD, KTSS-HH) were used to measure centerline temperatures in the middle of
heat-25
ACPD
10, 17435–17466, 2010Measurement of the ambient organic aerosol volatility
distribution
B. H. Lee et al.
Title Page
Abstract Introduction
Conclusions References
Tables Figures
◭ ◮
◭ ◮
Back Close
Full Screen / Esc
Printer-friendly Version Interactive Discussion
Discussion
P
a
per
|
Dis
cussion
P
a
per
|
Discussion
P
a
per
|
Discussio
n
P
a
per
|
2.2 Thermodenuder-AMS data analysis
The analysis of ambient thermodenuder-AMS measurements is complicated by poten-tial changes in the AMS collection efficiency and organic aerosol density as particles partially evaporate upon heating in the TD, particle losses within the TD, and the po-tential resistances to mass transfer during particle evaporation. Here we propose a
5
data analysis method for ambient thermodenuder-AMS data accounting for all of these problems.
2.2.1 Collection efficiency and organic density
The AMS does not always measure the whole aerosol sample due to the partial trans-mission of particles, bouncing of less “sticky” particles on the vaporizer, and to a lesser
10
extent shape-related collection losses at the vaporizer (Slowik et al., 2004; Huffman et al., 2005; Canagaratna et al., 2006; Matthew et al., 2008). Thus, the overall collec-tion efficiency (CE) depends on the aerosol composition, morphology, shape and size. The CE values may also change after partial evaporation of particles in the TD. This may be due to different behavior in the AMS vaporizer of particles with less-volatile
15
compounds, or changes in particle shape, or combination of these. Another parameter that may change upon heating, evaporation of the more volatile OA components, and subsequent cooling is the organic aerosol density.
The AMS-SMPS measurement matching algorithm of Kostenidou et al. (2007) is used to calculate the CE of the AMS and the organic density for both the ambient
20
and thermodenuded aerosol as a function of time for the full study. The approach combines the mass distributions from the AMS and the volume distributions provided by the SMPS. The aerosol water content during the FAME-2008 measurements varied from 0–20% of the total mass (the particles were not dried before sampling) and was included in the algorithm. The total density for the algorithm is given by:
25
ACPD
10, 17435–17466, 2010Measurement of the ambient organic aerosol volatility
distribution
B. H. Lee et al.
Title Page
Abstract Introduction
Conclusions References
Tables Figures
◭ ◮
◭ ◮
Back Close
Full Screen / Esc
Printer-friendly Version Interactive Discussion
Discussion
P
a
per
|
Dis
cussion
P
a
per
|
Discussion
P
a
per
|
Discussio
n
P
a
per
|
wherexa/s is the mass fraction of the ammonium sulfate, xorg is the mass fraction of the organics,xwis the mass fraction of the water,ρa/sis the density of the ammonium sulfate (1.77 g cm−3),ρorg is the unknown organic density andρw is the water density (1.0 g cm−3). The AMS nitrate concentration was only about 1% of the total aerosol mass measured by the AMS during FAME-2008 and is not included in the analysis.
5
The contribution of sea-salt and dust in the size range used by the algorithm (less than 500 nm) was negligible (Pikridas et al., 2010). The method takes into account that the particles have a size-dependent density but assumes that OA density is size inde-pendent. The matching algorithm matches the AMS mass distribution and the SMPS volume distribution using the OA density and collection efficiency as fitting parameters.
10
The best fit is selected using the minimum error score (Kostenidou et al., 2007) result-ing in estimates of these two parameters and their correspondresult-ing uncertainty range.
Using the optimization algorithm of Kostenidou et al. (2007) the collection efficiency of the AMS (Fig. 2) and the organic density for the ambient and thermodenuded sam-ples for the FAME-2008 periods were calculated. The calculated average collection
ef-15
ficiency of AMS for the denuded and ambient samples are 0.76±0.09 and 0.85±0.08
respectively. The AMS collection efficiency is found to be approximately 10% lower for the aerosol that passes through the TD. This may be due to the increase in the less sticky, less volatile compounds in the aerosol as more volatile compounds are vapor-ized in the TD. After application of this collection efficiency, the AMS sulfate
concen-20
tration agreed well (R2=0.95) with concentrations measured independently by PM1.3 filters (Hildebrandt et al., 2010) during the full duration of the study. This agreement increases our confidence in the estimated CE values.
For FAME-2008, the average organic aerosol densities for the thermodenuded and ambient aerosol are 1.27±0.28 g cm−3and 1.35±0.22 g cm−3respectively. This value
25
ACPD
10, 17435–17466, 2010Measurement of the ambient organic aerosol volatility
distribution
B. H. Lee et al.
Title Page
Abstract Introduction
Conclusions References
Tables Figures
◭ ◮
◭ ◮
Back Close
Full Screen / Esc
Printer-friendly Version Interactive Discussion
Discussion
P
a
per
|
Dis
cussion
P
a
per
|
Discussion
P
a
per
|
Discussio
n
P
a
per
|
the submicrometer PM during FAME-08. Part of it may also be due to changes in the morphology of the OA during the study including its partial dissolution in the aqueous phase and a corresponding change of its density. To test the robustness of the cal-culated CE we repeated the optimization assuming a constant density of 1.3 g cm−3 for the OA during the whole campaign. The average calculated CE for this case was
5
within 1% of the values calculated based on the variable density. The calculated col-lection efficiency was also not sensitive to potential differences in the water content of the aerosol measured by the AMS and the SMPS. As a sensitivity test we assumed that half of the aerosol water evaporated inside the AMS inlet system (Zelenyuk et al., 2006). Repeating the optimization with this assumption resulted in changes of the CE
10
by less than 5% suggesting once more that the estimated CE values are quite robust.
2.2.2 Particle losses inside the thermodenuder
Particle losses inside the TD are caused by a combination of sedimentation, diffusion and thermophoresis. Losses due to sedimentation increase with increasing particle size, diffusive losses increase as particle size decreases, and losses due to
ther-15
mophoresis are weakly size dependent (Burtscher et al., 2001). For FAME-2008, the total losses in the thermodenuder are determined by comparing the SMPS number dis-tributions of the ambient and heated samples. The size distribution during FAME-2008 was that of aged continental aerosol with relatively few particles smaller than 50 nm (Pikridas et al., 2010). With the exception of six nucleation events that lasted only an
20
hour to two each during the month of the measurements, the distribution was quite stable. This stability resulted in constant number losses in the TD, approximately 15% of the total (Fig. 3). These losses are comparable with losses in other TDs reported by Wehner et al. (2002) and Huffman et al. (2008).
Since sedimentation, diffusional, and thermophoretic processes are size- and
25
ACPD
10, 17435–17466, 2010Measurement of the ambient organic aerosol volatility
distribution
B. H. Lee et al.
Title Page
Abstract Introduction
Conclusions References
Tables Figures
◭ ◮
◭ ◮
Back Close
Full Screen / Esc
Printer-friendly Version Interactive Discussion
Discussion
P
a
per
|
Dis
cussion
P
a
per
|
Discussion
P
a
per
|
Discussio
n
P
a
per
|
losses were not strongly size-dependent but more strongly temperature-dependent. Based on these results we assumed that the losses are size independent but are diff er-ent for each sample and temperature. Therefore, we assume that a size-independer-ent correction factor that is determined for each sample (every 24 min) is sufficient for this dataset. The error introduced by this simplification is examined in the next section.
5
2.2.3 Algorithm consistency check
Since the aerosol volatility measurement combines the AMS, which provides a mass distribution as a function of aerodynamic diameter, and the SMPS, which measures a number distribution as a function of a mobility diameter, a consistency check between the AMS and SMPS can be made accounting for estimated losses inside the
thermod-10
enuder and the calculated changes in organic aerosol density and the AMS collection efficiency. The check is made by calculating the evaporated SMPS number and vol-ume distributions from the corresponding ambient measurements and then comparing them with the SMPS measurements after the thermodenuder. This procedure uses the measured OA mass distribution by the AMS, the aerosol composition measured also
15
by the AMS, and the estimated number losses, OA density, and collection efficiency. The aerosol volume fraction remaining (VFR) after heating, correcting for the TD losses, varying CE and density, is estimated based on the AMS measurements as:
VFR=
[OA]TD
ρorg TD+
[Sulfates]TD
ρa/s+
[Water]TD
ρw [OA]amb
ρorg amb+
[Sulfates]amb
ρa/s+
[Water]amb
ρw
·
CEamb CETD ·
1
1−fN (2)
where subscript TD represents a sample that passes through the TD, subscript amb
20
ACPD
10, 17435–17466, 2010Measurement of the ambient organic aerosol volatility
distribution
B. H. Lee et al.
Title Page
Abstract Introduction
Conclusions References
Tables Figures
◭ ◮
◭ ◮
Back Close
Full Screen / Esc
Printer-friendly Version Interactive Discussion
Discussion
P
a
per
|
Dis
cussion
P
a
per
|
Discussion
P
a
per
|
Discussio
n
P
a
per
|
the optimization algorithm of Kostenidou et al. (2007) (Fig. 3), CEamb is the collection efficiency of AMS for the ambient sample, CETDis the CE for the thermodenuded sam-ple, andfN is the fraction of particle number losses in the TD, calculated based on the SMPS number distributions of the ambient and heated samples. The concentrations of other PM1components (nitrates, chloride, EC) were very small during FAME-2008
5
(Pikridas et al., 2010) and are not included in this ratio. From Eq. (2), the diameter of an evaporated particle,Dp,TDis given by:
Dp,TD=Dp,amb(VFR)
1
3 (3)
whereDp,amb is the diameter of the ambient (bypassed) aerosol. Then the estimated evaporated number distribution after the TD,nn(Dp,TD), is given by:
10
nn(Dp,TD)=nn(Dp,amb)·(d Dp,amb
d Dp,TD)·(1−fN) (4)
wherenn(Dp,amb) is the ambient number distribution from the SMPS. Likewise the esti-mated evaporated volume distribution,nv(Dp,TD), can be represented as:
nv(Dp,TD)=nv(Dp,amb)·(d Dp,ambd D
p,TD)·(1−fN) (5)
wherenv(Dp,amb) is the ambient volume distribution from the SMPS.
15
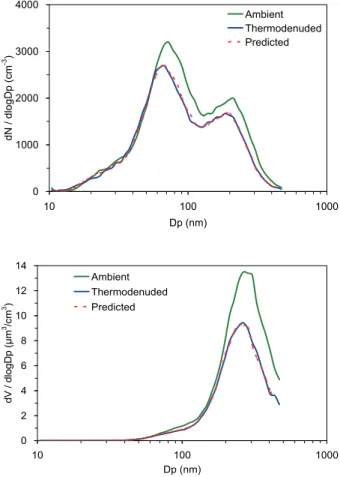
The estimated evaporated number and volume distributions (Eqs. 4 and 5) were compared with the actual thermodenuded number and volume distributions, respec-tively, for consistency in our analysis algorithm and the corresponding AMS and SMPS measurements. Typical results are shown in Figs. 4 and 5. The predicted evaporated distributions are in agreement with the actual thermodenuded distributions for all
par-20
ticle diameters. This confirms that (1) the losses were not strongly size-dependent for this dataset, (2) the method for the post-correction for the losses inside the TD and the changes in the AMS CE and organic aerosol density during heating is reasonable, (3) the measurements from the AMS and SMPS are consistent with each other and or-ganic information from the AMS can be used to estimate the actual evaporated fraction
25
ACPD
10, 17435–17466, 2010Measurement of the ambient organic aerosol volatility
distribution
B. H. Lee et al.
Title Page
Abstract Introduction
Conclusions References
Tables Figures
◭ ◮
◭ ◮
Back Close
Full Screen / Esc
Printer-friendly Version Interactive Discussion
Discussion
P
a
per
|
Dis
cussion
P
a
per
|
Discussion
P
a
per
|
Discussio
n
P
a
per
|
2.2.4 Multi-component organic aerosol evaporation model
In the last step of the analysis, a mass transfer model (Lee et al., 2010; Riipinen et al., 2010) is used to simulate the time-dependent evaporation of the aerosol in the thermodenuder. The model is based on the volatility basis set approach, where ef-fective saturation concentrations are predetermined using a lognormally spaced fixed
5
basis set (Donahue et al., 2006), and it assumes that organic vapors in are in equi-librium with the aerosol phase at the entrance of the TD. The temperature profile in the heating section is simulated based on piecewise polynomial fits to the measured temperature profile in the heating section for the flow rates used in the study (Fig. 1).
Besides the volatility distribution, also other properties – particularly the vaporization
10
enthalpies and mass accommodation coefficients – of the aerosol constituents affect their evaporation in the TD. An effective vaporization enthalpy of 80 kJ mol−1is used for the aerosol as a base case, which is not far from the Saathoffet al. (2009) estimate for the less volatileα-pinene SOA components. The effective mass accommodation coef-ficient is chosen to be 0.05, consistent with the TD results by Lee et al. (2010) for
bio-15
genic SOA evaporation. There is no quantitative information about the accommodation coefficients of organic aerosol constituents available in the current literature (Kulmala and Wanger, 2001; Kolb et al., 2010) however the possibility of low accommodation coefficients of organic aerosol have been found (Grieshop et al., 2007; Lee et al., 2010). The corresponding average volatility distribution of the ambient organic aerosol
20
is then estimated by letting the volatility distribution vary and minimizing the sum of the squared differences between the MFR model predictions and the thermodenuder measurements. The aerosol was approximated with a monodisperse aerosol with a diameter of 300 nm, the median diameter of the average volume distribution during FAME-2008 (Pikridas et al., 2010). Use of the full distribution resulted in differences
25
ACPD
10, 17435–17466, 2010Measurement of the ambient organic aerosol volatility
distribution
B. H. Lee et al.
Title Page
Abstract Introduction
Conclusions References
Tables Figures
◭ ◮
◭ ◮
Back Close
Full Screen / Esc
Printer-friendly Version Interactive Discussion
Discussion
P
a
per
|
Dis
cussion
P
a
per
|
Discussion
P
a
per
|
Discussio
n
P
a
per
|
3 Results and discussion
3.1 Volatility of organic aerosol
For FAME-2008 data, 24 min averaged values of CE and particle losses inside the TD are used for the post-correction. Figure 6 shows the effect of making these corrections on the estimated organic mass fraction of organic aerosol remaining after the TD. The
5
thermogram, a plot of the organic mass fraction remaining (MFR) after heating as a function of TD temperature, shows that the particle losses inside the TD and the changes in the AMS CE during heating result in approximately 20% underestimation of the MFR. The differences between the corrected and uncorrected data are greater at higher temperature (around 30% differences in MFR) since the particle losses inside
10
the TD are greater at higher temperature.
The ambient aerosol during FAME-2008 was much less volatile than fresh laboratory-generated α-pinene SOA (generated in the same manner as Lee et al., 2010) of the same average size (Fig. 6). This is due to the fact that the ambient aerosol during FAME-2008 was highly oxidized as suggested by its organic mass spectrum
15
(Hildebrandt et al., 2010) due to the strong oxidizing conditions and remote sampling site without local sources (Pikridas et al., 2010). More detailed analyses of the AMS spectra from the ambient measurements are presented elsewhere (Hildebrandt et al., 2010). Approximately 70% of the OA evaporated at 150◦C for a residence time of 14 s. The evaporated fraction increased to 80% at this temperature after 105 s in the
20
ACPD
10, 17435–17466, 2010Measurement of the ambient organic aerosol volatility
distribution
B. H. Lee et al.
Title Page
Abstract Introduction
Conclusions References
Tables Figures
◭ ◮
◭ ◮
Back Close
Full Screen / Esc
Printer-friendly Version Interactive Discussion
Discussion
P
a
per
|
Dis
cussion
P
a
per
|
Discussion
P
a
per
|
Discussio
n
P
a
per
|
3.2 OA volatility distribution
Three different sets of four logarithmically-based volatility bins were used in the simula-tions: one ranging from effective saturation concentration at 298 K of 0.001 to 1 µg m−3, one from 0.01 to 10 µg m−3, and one from 0.1 to 100 µg m−3. The MATLAB least-squares fitting algorithmlsqcurvefit was used to obtain the best possible fit between
5
the measured and modeled MFRs. To obtain the best fit, first the appropriate volatility basis set bins were chosen based on two-parameter fits to the measured MFR vs. tem-perature data, where lower and upper limits of the volatilities were defined. Then the initial aerosol mass fractions of each of the bins in the chosen volatility basis set were varied. The MFR data set was averaged over each 2◦C range to reduce the
computa-10
tional burden of the fitting procedure. The measurement points corresponding to both residence times (14 and 105 s) were given the same statistical weight in the fits. This was achieved by duplicating the data points in the 105 s data set to yield the same number of data points as in the 14 s data set.
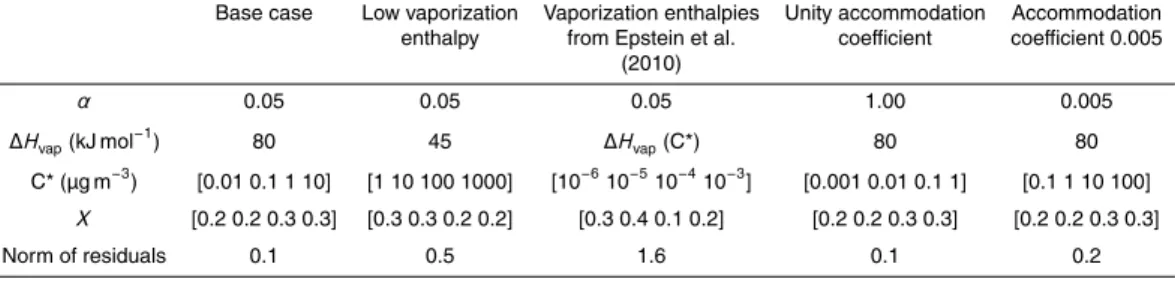
The aerosol mass fractions corresponding to the best fit in the base case runs are
15
given in Table 1. These results suggest that 70% of the OA had effective saturation concentrations of 1 µg m−3 or less at 298 K. The observations can be explained with all the OA being semivolatile (C*≥10−2µg m−3). The measurement data for the two
residence times and the modeled MFR are illustrated in Fig. 7.
The sensitivity of the results was tested by letting the mass fraction vary by ±0.1
20
in one volatility bin at a time from the best fit value reported in Table 1. Since the mass fractions need to sum to unity, the variation in one bin was compensated in a corresponding opposite variation in one of the other bins, thus resulting in 12 separate sensitivity runs for the 4-bin basis set. The dark shaded areas in Fig. 7 represent the minimum variation as compared to the optimum solution and correspond to the cases
25
ACPD
10, 17435–17466, 2010Measurement of the ambient organic aerosol volatility
distribution
B. H. Lee et al.
Title Page
Abstract Introduction
Conclusions References
Tables Figures
◭ ◮
◭ ◮
Back Close
Full Screen / Esc
Printer-friendly Version Interactive Discussion
Discussion
P
a
per
|
Dis
cussion
P
a
per
|
Discussion
P
a
per
|
Discussio
n
P
a
per
|
sensitivity studies suggest that it is difficult to separate the exact distribution in the two least volatile of the bins. However, it can be concluded that the ratio between the contribution of the two least volatile bins (0.1 µg m−3 or less) and the two most volatile bins (1–10 µg m−3) is close to 2/3, at least if the vaporization enthalpy can be approximated with a constant value of 80 kJ mol−1.
5
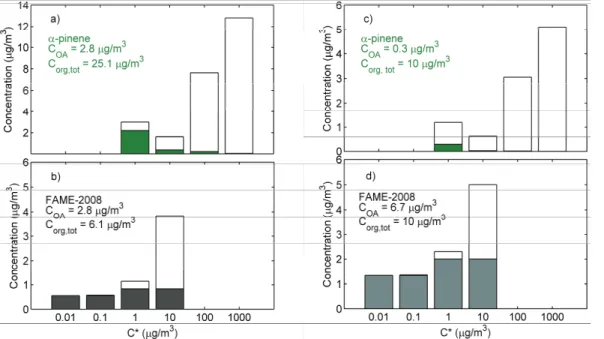
In Fig. 8, the obtained volatility distributions for total organic concentration of 10 µg/m3and total organic aerosol concentration of 2.8 µg/m3(the average OA concen-tration during FAME-2008) are compared to the corresponding distributions for freshα -pinene SOA (produced in dark, low NOx, and low RH conditions) reported by Pathak et al. (2007). These results suggest that the aged aerosol measured during FAME-2008
10
is approximately 2 orders of magnitude less volatile than the fresh laboratory-generated SOA fromα-pinene ozonolysis.
As mentioned earlier, the model results are obtained assuming a monodisperse aerosol of 300 nm. To test the sensitivity of the results to this assumption, we com-pared the simulated results of the MFRs (using the optimum volatility distribution given
15
for the baseline case in Table 1) for a monodispersed aerosol size distribution and a full size distribution corresponding to the mean mass size distribution during the FAME-2008 campaign. The difference in the MFR simulations using the full distribution and the monodisperse distribution was less than 2% in all the studied temperatures. The corresponding uncertainty in the fitted volatility distribution is thus much less than the
20
uncertainty related to constraining the data in the fitting procedure.
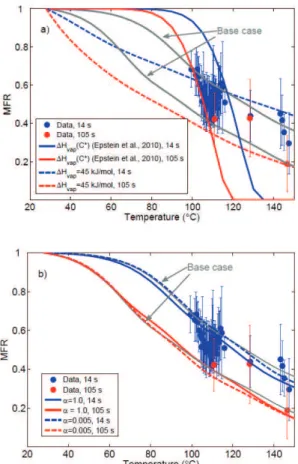
Since the predicted MFRs are likely to depend strongly on the values used for the va-porization enthalpies and mass accommodation coefficients of the aerosol, we tested the sensitivity of the obtained volatility distribution to these variables. Assuming an ef-fective vaporization enthalpy of 45 kJ mol−1 (consistent with Lee et al., 2010 for fresh
25
ACPD
10, 17435–17466, 2010Measurement of the ambient organic aerosol volatility
distribution
B. H. Lee et al.
Title Page
Abstract Introduction
Conclusions References
Tables Figures
◭ ◮
◭ ◮
Back Close
Full Screen / Esc
Printer-friendly Version Interactive Discussion
Discussion
P
a
per
|
Dis
cussion
P
a
per
|
Discussion
P
a
per
|
Discussio
n
P
a
per
|
observations with this set of parameters: the volatilities corresponding for the best fit were extremely low, ranging from 10−6to 10−3µg m−3, and the predicted temperature-dependence was considerably steeper than observed (Table 1 and Fig. 9a). Corre-sponding comparisons to the case where the mass accommodation coefficient was assumed to be unity – thus corresponding to the case of maximum evaporation –
5
or 0.005 are also presented in Fig. 9b and Table 1. These results highlight the fact that roughly an order of magnitude change in the mass accommodation coefficient is “equivalent” to a corresponding change in the volatility distribution. This uncertainty could potentially be overcome by varying residence times in the heated section of the thermodenuder to the extent where no variation with time would be seen in the MFRs
10
– thus ensuring the uncoupling of kinetic and thermodynamic effects in the evaporation inside TDs. The volatility distributions obtained from the fits are presented in Table 1, and the corresponding modeled MFRs in Fig. 9. The unity effective accommodation coefficient is also compatible with our measurements resulting in an estimated volatility distribution that is roughly an order of magnitude less than theα=0.05 case (Fig. 10).
15
4 Conclusions
A data analysis method for ambient TD-AMS measurements is developed and applied to the data taken during FAME-2008. The method takes account of the challenges that arise in the interpretation of ambient TD-AMS measurements. The ambient data are post corrected for the changes in the AMS collection efficiency as the particles
evap-20
orate partially during heating, and particle losses inside the thermodenuder. Particle losses in the thermodenuder are approximately 15% and the AMS CE of the ther-modenuded samples was around 10% lower than that of the ambient/bypass samples. Overall these corrections increased the MFR by approximately 20%, for FAME-2008. An organic aerosol evaporation model is used to simulate the time-dependent behavior
25
ACPD
10, 17435–17466, 2010Measurement of the ambient organic aerosol volatility
distribution
B. H. Lee et al.
Title Page
Abstract Introduction
Conclusions References
Tables Figures
◭ ◮
◭ ◮
Back Close
Full Screen / Esc
Printer-friendly Version Interactive Discussion
Discussion
P
a
per
|
Dis
cussion
P
a
per
|
Discussion
P
a
per
|
Discussio
n
P
a
per
|
is approximately two orders of magnitude less volatile than laboratory-generated α -pinene SOA.
Use of two residence times allows for a more constrained determination of the aerosol volatility by – at least partly – uncoupling the kinetic and thermodynamic in-fluences on the TD output. However, even with the two residence times used a rather
5
wide range of effective accommodation coefficients (from 0.05 to 1) were consistent with the data resulting in significant uncertainty (almost an order of magnitude) in the estimated volatility distribution. Our analysis suggests that measurements at even higher residence times (several 100 s) may be needed to further constrain the volatility distribution of OA at these low concentration levels.
10
Acknowledgements. This research was supported by the US National Science Foundation (ATM-0336296) and the EUCAARI European Union FP6 Project.
References
An, W. J., Pathak, R. K., Lee, B. H., and Pandis, S. N.: Aerosol volatility measurement using an improved thermodenuder: Application to secondary organic aerosol, J. Aerosol. Sci., 38,
15
305–314, 2007.
Bilde, M. and Pandis, S. N.: Evaporation Rates and Vapor Pressures of Individual Aerosol Species Formed in the Atmospheric Oxidation of Alpha- and Beta-Pinene, Environ. Sci. Technol., 35, 3344–3349, 2001.
Burtscher, H., Baltensperger, U., Bukowiecki, N., Cohn, P., Huglin, C., Mohr, M., Matter, U.,
20
Nyeki S., Schmatloch V., Streit, N., and Weingartner, E.: Separation of volatile and non-volatile aerosol fractions by thermodesorption: Instrumental development and applications, J. Aerosol. Sci., 32, 427–442, 2001.
Canagaratna, M. R., Jayne, J. T., Jimenez, J. L., Allan, J. D., Alfarra, M. R., Zhang, Q., Onasch, T. B., Drewnick, F., Coe, H., Middlebrook, A., Delia, A., Williams,L. R., Trimborn, A. M.,
25
ACPD
10, 17435–17466, 2010Measurement of the ambient organic aerosol volatility
distribution
B. H. Lee et al.
Title Page
Abstract Introduction
Conclusions References
Tables Figures
◭ ◮
◭ ◮
Back Close
Full Screen / Esc
Printer-friendly Version Interactive Discussion
Discussion
P
a
per
|
Dis
cussion
P
a
per
|
Discussion
P
a
per
|
Discussio
n
P
a
per
|
Clarke, A. D.: A thermo-optic technique for in-situ analysis of size-resolved aerosol physico-chemistry, Atmos. Environ., 25, 635–644, 1991.
Cross, E. S., Slowik, J. G., Davidovits, P., Allan, J. D., Worsnop, D. R., Jayne, J. T., Lewis, D. K., Canagaratna, M., and Onasch, T. B.: Laboratory and ambient particle density determinations using light scattering in conjunction with aerosol mass spectrometry, Aerosol Sci. Tech., 41,
5
343–359, 2007.
DeCarlo, P. F., Kimmel, J. R., Trimborn, A. M., Northway, M. J., Jayne, J. T., Aiken, A. C., Gonin, M., Fuhrer, K., Horvath, T., Docherty, K. S., Worsnop, D. R., and Jimenez, J. L.: Field-Deployable, High-Resolution, Time-of-Flight Aerosol Mass Spectrometer, Anal. Chem., 78, 8281–8289, 2006.
10
Donahue, N. M., Robinson, A. L., Stanier, C. O., and Pandis, S. N.: Coupled partitioning, dilution, and chemical aging of semivolatile organics, Environ. Sci. Technol., 40, 2635–2643, 2006.
Engler, C., Rose, D., Wehner, B., Wiedensohler, A., Bru ¨ggemann, E., Gnauk, T., Spindler, G., Tuch, T., and Birmili, W.: Size distributions of non-volatile particle residuals (Dp<800 nm) at
15
a rural site in Germany and relation to air mass origin, Atmos. Chem. Phys., 7, 5785–5802, doi:10.5194/acp-7-5785-2007, 2007.
Faulhaber, A. E., Thomas, B. M., Jimenez, J. L., Jayne, J. T., Worsnop, D. R., and Zie-mann, P. J.: Characterization of a thermodenuder-particle beam mass spectrometer system for the study of organic aerosol volatility and composition, Atmos. Meas. Tech., 2, 15–31,
20
doi:10.5194/amt-2-15-2009, 2009.
Grieshop, A. P., Donahue, N. M., and Robinson, A. L.: Is the gas-particle partitioning in alpha-pinene secondary organic aerosol reversible?, Geophys. Res. Lett., 34, L14810, doi:10.1029/2007GL029987, 2007.
Grieshop, A. P., Logue, J. M., Donahue, N. M., and Robinson, A. L.: Laboratory investigation of
25
photochemical oxidation of organic aerosol from wood fires 1: measurement and simulation of organic aerosol evolution, Atmos. Chem. Phys., 9, 1263–1277, doi:10.5194/acp-9-1263-2009, 2009.
Hildebrandt, L., Engelhart, G. J., Mohr, C., Kostenidou, E., Lanz, V. A., Bougiatioti, A., DeCarlo, P. F., Prevot, A. S. H., Baltensperger, U., Mihalopoulos, N., Donahue, N. M., and Pandis, S.
30
ACPD
10, 17435–17466, 2010Measurement of the ambient organic aerosol volatility
distribution
B. H. Lee et al.
Title Page
Abstract Introduction
Conclusions References
Tables Figures
◭ ◮
◭ ◮
Back Close
Full Screen / Esc
Printer-friendly Version Interactive Discussion
Discussion
P
a
per
|
Dis
cussion
P
a
per
|
Discussion
P
a
per
|
Discussio
n
P
a
per
|
Huffman, J. A., Jayne, J. T., Drewnick, F., Aiken, A. C., Onasch, T., Worsnop, D. R., and Jimenez J. L.: Design, Modeling, Optimization, and Experimental Tests of a Particle Beam Width Probe for the Aerodyne Aerosol Mass Spectrometer, Aerosol Sci. Tech., 39, 1143–1163, 2005.
Huffman, J. A., Docherty, K. S., Mohr, C., Cubison, M. J., Ulbrich, I. M., Ziemann, P. J., Onasch,
5
T. B., and Jimenez, J. L.: Chemically-resolved volatility measurements of organic aerosol from different source, Environ. Sci. Technol., 43, 5351–5357, 2009.
Huffman, J. A., Ziemann, P. J., Jayne J. T., Worsnop, D. R., and Jimenez, J. L.: Development and characterization of a fast-stepping/scanning thermodenuder for chemically-resolved aerosol volatility measurement, Aerosol Sci. Tech., 42, 395–407, 2008.
10
Jayne, J. T., Leard, D. C., Zhang, X., Davidovits, P., Smith, K. A., Kolb, C. E., and Worsnop D. R.: Development of an aerosol mass spectrometer for size and composition analysis of submicron particles, Aerosol Sci. Technol., 33, 49–70, 2000.
Jimenez, J. L., Jayne, J. T., Shi, Q., Kolb C. E., Worsnop D. R., Yourshaw, I., Seinfeld, J. H., Flagan, R. C., Zhang, X., Smith K. A., Morris, J. W., and Davidotis, P.: Ambient
15
aerosol sampling with an aerosol mass spectrometer, J. Geophys. Res., 108(D7), 8425, doi:10.1029/2001JD001213, 2003.
Jonsson, A. M., Hallquist, M., and Saathoff, H.: Volatility of secondary organic aerosols from the ozone initiated oxidation ofα-pinene and limonene, J. Aerosol Sci., 38, 843–852, 2007. Kanakidou, M., Seinfeld, J. H., Pandis, S. N., Barnes, I., Dentener, F. J., Facchini, M. C., Van
20
Dingenen, R., Ervens, B., Nenes, A., Nielsen, C. J., Swietlicki, E., Putaud, J. P., Balkanski, Y., Fuzzi, S., Horth, J., Moortgat, G. K., Winterhalter, R., Myhre, C. E. L., Tsigaridis, K., Vignati, E., Stephanou, E. G., and Wilson, J.: Organic aerosol and global climate modelling: a review, Atmos. Chem. Phys., 5, 1053–1123, doi:10.5194/acp-5-1053-2005, 2005.
Kolb, C. E., Cox, R. A., Abbatt, J. P. D., Ammann, M., Davis, E. J., Donaldson, D. J., Garrett,
25
B. C., George, C., Griffiths, P. T., Hanson, D. R., Kulmala, M., McFiggans, G., P ¨oschl, U., Riipinen, I., Rossi, M. J., Rudich, Y., Wagner, P. E., Winkler, P. M., Worsnop, D. R., and O’ Dowd, C. D.: An overview of current issues in the uptake of atmospheric trace gases by aerosols and clouds, Atmos. Chem. Phys. Discuss., 10, 11139–11250, doi:10.5194/acpd-10-11139-2010, 2010.
30
ACPD
10, 17435–17466, 2010Measurement of the ambient organic aerosol volatility
distribution
B. H. Lee et al.
Title Page
Abstract Introduction
Conclusions References
Tables Figures
◭ ◮
◭ ◮
Back Close
Full Screen / Esc
Printer-friendly Version Interactive Discussion
Discussion
P
a
per
|
Dis
cussion
P
a
per
|
Discussion
P
a
per
|
Discussio
n
P
a
per
|
Kostenidou, E., Pathank, R. K., and Pandis, S. N.: An algorithm for the calculation of secondary organic aerosol density combining AMS and SMPS data, Aerosol Sci. Tech., 41, 1002–1010, 2007.
Kulmala, M. and Wagner, P. E.: Mass accommodation and uptake coefficients-a quantitative comparison, J. Aerosol Sci., 32, 833–841, 2001.
5
Kulmala, M., Asmi, A., Lappalainen, H. K., Carslaw, K. S., Po¨schl, U., Baltensperger, U., Hov, Ø., Brenquier, J.-L., Pandis, S. N., Facchini, M. C., Hansson, H.-C., Wiedensohler, A., and O’Dowd, C. D.: Introduction: European Integrated Project on Aerosol Cloud Climate and Air Quality interactions (EUCAARI) - integrating aerosol research from nano to global scales, Atmos. Chem. Phys., 9, 2825–2841, doi:10.5194/acp-9-2825-2009, 2009.
10
Lee, B. H., Pierce, J. R., Engelhart, G. J., and Pandis, S. N.: Volatility of secondary organic aerosol from the ozonolysis of monoterpenes, Atmos. Environ., in review, 2010.
Matthew, B. M., Middlebrook, A. M., and Onasch, T. B.: Collection efficiencies in an Aerodyne aerosol mass spectrometer as a function of particle phase for laboratory generated aerosols, Aerosol Sci. Tech., 42, 884–898, doi:10.1080/02786820802356797, 2008.
15
Pathak, R. K., Presto, A. A., Lane, T. E., Stanier, C. O., Donahue, N. M., and Pandis, S. N.: Ozonolysis ofα-pinene: parameterization of secondary organic aerosol mass fraction, Atmos. Chem. Phys., 7, 3811–3821, doi:10.5194/acp-7-3811-2007, 2007.
Pikridas, M., Bougiatioti, A., Hildebrandt, L., Engelhart, G. J., Kostenidou, E., Mohr, C., Prevot, A. S. H., Kouvarakis, G., Zarmpas, P., Burkhart, J. F., Lee, B.-H., Psichoudaki, M.,
Mihalopou-20
los, N., Pilinis, C., Stohl, A., Baltensperger, U., Kulmala, M., and Pandis, S. N.: The Finokalia Aerosol Measurement Experiment – 2008 (FAME-08): an overview, Atmos. Chem. Phys. Discuss., 10, 6641–6679, doi:10.5194/acpd-10-6641-2010, 2010.
Pinnick, R. G., Jennings, S. G., and Fernandez, G.: Volatility of aerosols in the arid southwest-ern united states, J. Atmos. Sci., 44, 562–576, 1987.
25
Riipinen I., Pierce, J. R., Donahue N. M., and. Pandis S. N.: Equilibration time scales of or-ganic aerosol inside thermodenuders: Kinetics versus equilibrium thermodynamics, Atmos. Environ., 44, 597–607, 2010.
Saathoff, H., Naumann, K.-H., M ¨ohler, O., Jonsson, ˚A. M., Hallquist, M., Kiendler-Scharr, A., Mentel, Th. F., Tillmann, R., and Schurath, U.: Temperature dependence of yields of
sec-30
ACPD
10, 17435–17466, 2010Measurement of the ambient organic aerosol volatility
distribution
B. H. Lee et al.
Title Page
Abstract Introduction
Conclusions References
Tables Figures
◭ ◮
◭ ◮
Back Close
Full Screen / Esc
Printer-friendly Version Interactive Discussion
Discussion
P
a
per
|
Dis
cussion
P
a
per
|
Discussion
P
a
per
|
Discussio
n
P
a
per
|
Slowik, J. G., Stainken, K., Davidovits, P., Williams, L. R., Jayne, J. T., Kolb, C. E., Worsnop, D. R., Rudich, Y., DeCarlo, P. F., and Jimenez, J. L.: Particle morphology and density character-ization by combined mobility and aerodynamic diameter measurements, Part 2: Application to combustion-generated soot aerosols as a function of fuel equivalence ratio, Aerosol Sci. Tech., 38, 1206–1222, 2004.
5
Wehner, B., Philippin, S., and Wiedensohler, A.: Design and calibration of a thermodenuder with an improved heating unit to measure the size-dependent volatile fraction of aerosol particles, J. Aerosol Sci., 33, 1087–1093, 2002.
Zelenyuk, A., Imre, D., and Cuadra-Rodriguez, L. A.: Evaporation of water from particles in the aerodynamic lens inlet: An experimental study, Anal. Chem., 78, 6942–6947, 2006.
ACPD
10, 17435–17466, 2010Measurement of the ambient organic aerosol volatility
distribution
B. H. Lee et al.
Title Page
Abstract Introduction
Conclusions References
Tables Figures
◭ ◮
◭ ◮
Back Close
Full Screen / Esc
Printer-friendly Version Interactive Discussion
Discussion
P
a
per
|
Dis
cussion
P
a
per
|
Discussion
P
a
per
|
Discussio
n
P
a
per
|
Table 1. The input parameters (αis the effective mass accommodation coefficient,∆Hvap the
vaporization enthalpy) in the model calculations, and the corresponding mass fractions on each volatility in the aerosol phase, as determined from least squares fits of modeled to measured VFR data. The norm of residuals describes the goodness of the fit.
Base case Low vaporization Vaporization enthalpies Unity accommodation Accommodation enthalpy from Epstein et al. coefficient coefficient 0.005
(2010)
α 0.05 0.05 0.05 1.00 0.005
∆Hvap(kJ mol−1) 80 45 ∆Hvap(C*) 80 80
C* (µg m−3) [0.01 0.1 1 10] [1 10 100 1000] [10−610−510−410−3] [0.001 0.01 0.1 1] [0.1 1 10 100]
X [0.2 0.2 0.3 0.3] [0.3 0.3 0.2 0.2] [0.3 0.4 0.1 0.2] [0.2 0.2 0.3 0.3] [0.2 0.2 0.3 0.3]
ACPD
10, 17435–17466, 2010Measurement of the ambient organic aerosol volatility
distribution
B. H. Lee et al.
Title Page
Abstract Introduction
Conclusions References
Tables Figures
◭ ◮
◭ ◮
Back Close
Full Screen / Esc
Printer-friendly Version Interactive Discussion
Discussion
P
a
per
|
Dis
cussion
P
a
per
|
Discussion
P
a
per
|
Discussio
n
P
a
per
|
280 300 320 340 360 380 400 420
-0.1 0 0.1 0.2 0.3 0.4 0.5 0.6
Distance from entrance (m)
Center
line temper
atur
e (
K
)
Fig. 1.Temperature profile along the axis of the heating section at a flow rate of 1.15 L min−1
ACPD
10, 17435–17466, 2010Measurement of the ambient organic aerosol volatility
distribution
B. H. Lee et al.
Title Page Abstract Introduction Conclusions References Tables Figures ◭ ◮ ◭ ◮ Back Close
Full Screen / Esc
Printer-friendly Version Interactive Discussion Discussion P a per | Dis cussion P a per | Discussion P a per | Discussio n P a per | 1.0 0.8 0.6 0.4 0.2 0.0 C o lle ct io n E ff ici e n cy
9 10 11 12 13 14 15 16 17 18 19 20 21 22 23 24 25 26 27 28 29 30 31 1 2 3 4 5 Date
May 2008 June 2008
Thermodenuded CE 1.0 0.8 0.6 0.4 0.2 0.0 C o lle ct io n E ff ici e n cy Ambient CE 1.0 0.8 0.6 0.4 0.2 0.0 C o lle ct io n E ff ici e n cy
9 10 11 12 13 14 15 16 17 18 19 20 21 22 23 24 25 26 27 28 29 30 31 1 2 3 4 5 Date
May 2008 June 2008
Thermodenuded CE 1.0 0.8 0.6 0.4 0.2 0.0 C o lle ct io n E ff ici e n cy
9 10 11 12 13 14 15 16 17 18 19 20 21 22 23 24 25 26 27 28 29 30 31 1 2 3 4 5 Date
May 2008 June 2008
Thermodenuded CE 1.0 0.8 0.6 0.4 0.2 0.0 C o lle ct io n E ff ici e n cy Ambient CE 1.0 0.8 0.6 0.4 0.2 0.0 C o lle ct io n E ff ici e n cy Ambient CE
Fig. 2.Changes in the AMS collection efficiency for the ambient (top) and thermodenuded
ACPD
10, 17435–17466, 2010Measurement of the ambient organic aerosol volatility
distribution
B. H. Lee et al.
Title Page
Abstract Introduction
Conclusions References
Tables Figures
◭ ◮
◭ ◮
Back Close
Full Screen / Esc
Printer-friendly Version Interactive Discussion
Discussion
P
a
per
|
Dis
cussion
P
a
per
|
Discussion
P
a
per
|
Discussio
n
P
a
per
|
y = 0.85x R2 = 0.95
0 1000 2000 3000 4000 5000 6000
0 1000 2000 3000 4000 5000 6000
Ambient Number Conc. (cm-3)
Number Conc. in TD (
c
m
-3 )
Fig. 3. Number concentrations in the thermodenuder (TD) versus ambient aerosol number
ACPD
10, 17435–17466, 2010Measurement of the ambient organic aerosol volatility
distribution
B. H. Lee et al.
Title Page
Abstract Introduction
Conclusions References
Tables Figures
◭ ◮
◭ ◮
Back Close
Full Screen / Esc
Printer-friendly Version Interactive Discussion
Discussion
P
a
per
|
Dis
cussion
P
a
per
|
Discussion
P
a
per
|
Discussio
n
P
a
per
|
0 2000 4000 6000 8000
10 100 1000
Dp (nm)
dN
/ dlogDp (cm
-3 )
Ambient Thermodenuded Predicted
0 10 20 30 40
10 100 1000
Dp (nm)
dV / dl
ogDp
(
μ
m
3/cm 3)
Ambient Thermodenuded Predicted
Fig. 4.Number and volume distributions of ambient aerosol and thermodenuded aerosol while
TD was operated at 106◦
ACPD
10, 17435–17466, 2010Measurement of the ambient organic aerosol volatility
distribution
B. H. Lee et al.
Title Page
Abstract Introduction
Conclusions References
Tables Figures
◭ ◮
◭ ◮
Back Close
Full Screen / Esc
Printer-friendly Version Interactive Discussion
Discussion
P
a
per
|
Dis
cussion
P
a
per
|
Discussion
P
a
per
|
Discussio
n
P
a
per
|
0 1000 2000 3000 4000
10 100 1000
Dp (nm)
dN
/ dlogDp (cm
-3)
Ambient Thermodenuded Predicted
0 2 4 6 8 10 12 14
10 100 1000
Dp (nm)
dV
/ dl
og
D
p
(
μ
m
3/cm 3)
Ambient Thermodenuded Predicted
Fig. 5.Number and volume distributions of ambient aerosol and thermodenuded aerosol while
TD was operated at 108◦
ACPD
10, 17435–17466, 2010Measurement of the ambient organic aerosol volatility
distribution
B. H. Lee et al.
Title Page
Abstract Introduction
Conclusions References
Tables Figures
◭ ◮
◭ ◮
Back Close
Full Screen / Esc
Printer-friendly Version Interactive Discussion
Discussion
P
a
per
|
Dis
cussion
P
a
per
|
Discussion
P
a
per
|
Discussio
n
P
a
per
|
0.0 0.2 0.4 0.6 0.8
80 100 120 140 160
Temperature (oC)
O
rganic
Mas
s
Frac
ti
on Remaining
With corrections
Without corrections
α-pinene SOA
Fig. 6.Mass fraction remaining after heating in the TD (for 14 s) as a function of temperature for
ACPD
10, 17435–17466, 2010Measurement of the ambient organic aerosol volatility
distribution
B. H. Lee et al.
Title Page
Abstract Introduction
Conclusions References
Tables Figures
◭ ◮
◭ ◮
Back Close
Full Screen / Esc
Printer-friendly Version Interactive Discussion
Discussion
P
a
per
|
Dis
cussion
P
a
per
|
Discussion
P
a
per
|
Discussio
n
P
a
per
|
Fig. 7.The modeled mass fractions remaining (lines, see Table 1 for details) corresponding to
ACPD
10, 17435–17466, 2010Measurement of the ambient organic aerosol volatility
distribution
B. H. Lee et al.
Title Page
Abstract Introduction
Conclusions References
Tables Figures
◭ ◮
◭ ◮
Back Close
Full Screen / Esc
Printer-friendly Version Interactive Discussion
Discussion
P
a
per
|
Dis
cussion
P
a
per
|
Discussion
P
a
per
|
Discussio
n
P
a
per
|
Fig. 8. The volatility distributions of aged ambient organic aerosol during FAME-2008
(bot-tom) for(b)total organic concentration of 10 µg m−3and(d)total organic aerosol concentration of 2.8 µg m−3
ACPD
10, 17435–17466, 2010Measurement of the ambient organic aerosol volatility
distribution
B. H. Lee et al.
Title Page
Abstract Introduction
Conclusions References
Tables Figures
◭ ◮
◭ ◮
Back Close
Full Screen / Esc
Printer-friendly Version Interactive Discussion
Discussion
P
a
per
|
Dis
cussion
P
a
per
|
Discussion
P
a
per
|
Discussio
n
P
a
per
|
Fig. 9. The modeled mass fractions remaining (lines, see Table 1 for details) corresponding
to different input data to the TD model, along with the fitting data set (markers). The sensitiv-ity runs with(a) low vaporization enthalpy and vaporization enthalpy of Epstein et al. (2010),
ACPD
10, 17435–17466, 2010Measurement of the ambient organic aerosol volatility
distribution
B. H. Lee et al.
Title Page
Abstract Introduction
Conclusions References
Tables Figures
◭ ◮
◭ ◮
Back Close
Full Screen / Esc
Printer-friendly Version Interactive Discussion
Discussion
P
a
per
|
Dis
cussion
P
a
per
|
Discussion
P
a
per
|
Discussio
n
P
a
per
|
Fig. 10.The effect of mass accommodation coefficient on the predicted volatility distributions of