Inflammatory/Pro-Resolving Polyunsaturated Fatty
Acids-Derived Lipid Mediators in Leprosy Disease
Julio J. Amaral1,2, Luis Caetano M. Antunes3,4, Cristiana S. de Macedo1,5, Katherine A. Mattos1, Jun Han6, Jingxi Pan6, Andre´ L. P. Cande´a7, Maria das Grac¸as M. O. Henriques7, Marcelo Ribeiro-Alves8,
Christoph H. Borchers6, Euzenir N. Sarno9, Patrı´cia T. Bozza10, B. Brett Finlay3, Maria Cristina V. Pessolani1*
1Laborato´rio de Microbiologia Celular, Instituto Oswaldo Cruz, Fundac¸a˜o Oswaldo Cruz, Rio de Janeiro, Brazil,2Laborato´rio de Biologia, Instituto Nacional de Metrologia, Qualidade e Tecnologia, Rio de Janeiro, Brazil,3Michael Smith Laboratories, The University of British Columbia, Vancouver, British Columbia, Canada,4Escola Nacional de Sau´de Pu´blica Sergio Arouca, Fundac¸a˜o Oswaldo Cruz, Rio de Janeiro, Brazil,5Centro de Desenvolvimento Tecnolo´gico em Sau´de, Fundac¸a˜o Oswaldo Cruz, Rio de Janeiro, Brazil,6University of Victoria – Genome BC Proteomics Centre, University of Victoria, Victoria, British Columbia, Canada,7Laborato´rio de Farmacologia Aplicada, Farmanguinhos, Fundac¸a˜o Oswaldo Cruz, Rio de Janeiro, Brazil,8Laborato´rio de Pesquisa em Farmacogene´tica, Instituto de Pesquisa Clı´nica Evandro Chagas, Fundac¸a˜o Oswaldo Cruz, Rio de Janeiro, Brazil, 9Laborato´rio de Hansenı´ase, Instituto Oswaldo Cruz, Fundac¸a˜o Oswaldo Cruz, Rio de Janeiro, Brazil,10Laborato´rio de Imunofarmacologia, Instituto Oswaldo Cruz, Fundac¸a˜o Oswaldo Cruz, Rio de Janeiro, Brazil
Abstract
Despite considerable efforts over the last decades, our understanding of leprosy pathogenesis remains limited. The complex interplay between pathogens and hosts has profound effects on host metabolism. To explore the metabolic perturbations associated with leprosy, we analyzed the serum metabolome of leprosy patients. Samples collected from lepromatous and tuberculoid patients before and immediately after the conclusion of multidrug therapy (MDT) were subjected to high-throughput metabolic profiling. Our results show marked metabolic alterations during leprosy that subside at the conclusion of MDT. Pathways showing the highest modulation were related to polyunsaturated fatty acid (PUFA) metabolism, with emphasis on anti-inflammatory, pro-resolving omega-3 fatty acids. These results were confirmed by eicosanoid measurements through enzyme-linked immunoassays. Corroborating the repertoire of metabolites altered in sera, metabonomic analysis of skin specimens revealed alterations in the levels of lipids derived from lipase activity, including PUFAs, suggesting a high lipid turnover in highly-infected lesions. Our data suggest that omega-6 and omega-3, PUFA-derived, pro-resolving lipid mediators contribute to reduced tissue damage irrespectively of pathogen burden during leprosy disease. Our results demonstrate the utility of a comprehensive metabonomic approach for identifying potential contributors to disease pathology that may facilitate the development of more targeted treatments for leprosy and other inflammatory diseases.
Citation:Amaral JJ, Antunes LCM, de Macedo CS, Mattos KA, Han J, et al. (2013) Metabonomics Reveals Drastic Changes in Anti-Inflammatory/Pro-Resolving Polyunsaturated Fatty Acids-Derived Lipid Mediators in Leprosy Disease. PLoS Negl Trop Dis 7(8): e2381. doi:10.1371/journal.pntd.0002381
Editor:Mathieu Picardeau, Institut Pasteur, France
ReceivedFebruary 18, 2013;AcceptedJuly 7, 2013;PublishedAugust 15, 2013
Copyright:ß2013 Amaral et al. This is an open-access article distributed under the terms of the Creative Commons Attribution License, which permits unrestricted use, distribution, and reproduction in any medium, provided the original author and source are credited.
Funding:This work was funded by grants from the Conselho Nacional de Desenvolvimento Cientı´fico e Tecnolo´gico (CNPq), the Canadian Institutes of Health Research, Genome British Columbia and Genome Canada. JJA was supported by a doctoral fellowship from the Coordenac¸a˜o de Aperfeic¸oamento de Pessoal de Nı´vel Superior (CAPES). LCMA was supported by a postdoctoral fellowship from the Canadian Institutes of Health Research and an Atrac¸a˜o de Jovens Talentos fellowship from the Cieˆncia sem Fronteiras program of CNPq. CSdM received a fellowship from the Foundation for Scientific and Technological Development in Health, Fiocruz. The funders had no role in study design, data collection and analysis, decision to publish, or preparation of the manuscript.
Competing Interests:The authors have declared that no competing interests exist. * E-mail: cpessola@ioc.fiocruz.br
Introduction
Leprosy, a chronic infectious disease caused by the obligate intracellular bacteriumMycobacterium leprae, remains a major source of morbidity in developing countries [1]. The disease affects mainly the skin and the peripheral nervous system, in which the leprosy bacillus is preferentially found inside macrophages and Schwann cells (reviewed in [2]). Multidrug therapy (MDT), a combination of antibiotics that are very effective in eliminatingM. leprae, was introduced by WHO in the early eighties. However, despite efforts to treat registered leprosy patients, the number of new cases reported globally remains stable and high (about
200,000/year). The disease is still considered a public health problem in several countries. In Brazil, the detection rate remains high and stable at approximately 40,000 new cases annually [1]. Moreover, nerve damage may progress during MDT itself and even subsequent to patient release, due mainly to the occurrence of acute immune-inflammatory episodes known as leprosy reactions. Therefore, new strategies and approaches need to be developed in order to decrease disease morbidity and fully eradicate leprosy as a public health problem.
infection. At one extreme of the spectrum, individuals with polar tuberculoid (TT) leprosy have few lesions and manifest a contained, self-limited infection in which scarce bacilli are detected due to the generation of a strong cellular immune response against M. leprae. At the other end, lepromatous leprosy (LL) is a progressively disseminating disease characterized by extensive bacterial multiplication within host cells and low cell-mediated immunity to the pathogen. Between these two poles are the borderline forms (characterized by their intermediate clinical and immunological patterns), commonly referred to as borderline tuberculoid (BT), borderline borderline (BB), and borderline lepromatous (BL) in accordance with their proximity to either one of the spectral extremes (reviewed in [2]).
Leprosy is a complex disease, and is essentially restricted to human beings. Despite considerable research efforts over the last decades, our understanding of the mechanisms that govern leprosy pathogenesis remains limited. The unique features of the leprosy bacillus have contributed to the slow progress in our knowledge of leprosy. One peculiar characteristic of M. leprae is its extremely long generation time, estimated to be nearly 2 weeks. This slow growth rate results in long incubation periods (2–10 years) and very slow development of pathology and clinical evolution (reviewed in [2]). In the absence of an animal experimental model that mimics the disease in humans, progress in our knowledge of leprosy pathogenesis relies on observations obtained from infected populations and on analyses of clinical samples collected directly from leprosy patients. However, continuing improvements in analytical technologies and recent developments of sensitive high-throughput techniques are now opening a new opportunity to study this ancient disease in order to suggest new strategies for leprosy prevention and treatment. Of note, techniques that identify and quantify multiple small metabolites (,1,500 Da) in complex biological samples have been recently developed, giving rise to the field of metabolomics (or metabonomics). Metabo-nomics has been successfully applied to different biofluids and tissue types, revealing their biochemical composition in different pathological conditions [3,4,5].
The complex interplay between pathogens and their hosts has profound effects on host metabolism during infection. Since the tuberculoid and lepromatous forms of leprosy constitute different
responses of the host toM. leprae infection, we hypothesized that host metabolism in response to infection would be distinct in these different clinical forms of the disease. Even thoughM. lepraeis an obligate intracellular parasite, patient plasma/serum offers an important window for detecting metabolic modulation since blood contains many molecules that are released by different tissues in response to infection. A recent metabolomic study of human serum has identified and quantified more than 4,000 metabolites generating the Human Serum Database [6].
To explore the perturbations in the human metabolome associated withM. lepraeinfection, we analyzed the repertoire of metabolites present in serum samples of leprosy patients. We used direct-infusion ultrahigh resolution Fourier transform ion cyclo-tron resonance mass spectrometry (DI-FT-ICR-MS), a powerful technique that allows the presumptive identification and relative quantification of thousands of metabolites with high mass accuracy and without the need for extensive sample preparation [7]. Our results indicate a marked modulation of omega-6 and omega-3 polyunsaturated fatty acids (PUFA) metabolism duringM. leprae infection, which disappears after MDT. Effects of M. leprae infection on PUFA metabolism were confirmed by measurements through enzyme-linked immunoassays using serum, which showed significantly higher levels of prostaglandin (PG) D2and E2(PGD2 and PGE2), lipoxin A4 (LXA4) and resolving D2 (RvD2) in untreated leprosy patients. Moreover, high-throughput metabolic profiling of skin specimens revealed an abundance of lipase products in LL patients, such as polyunsaturated fatty acids and lysolecithin, corroborating the serum metabolome data. This study demonstrates the power of metabonomics to unravel metabolic modulation during infection and provides the opportunity to identify novel therapeutic targets and biomarkers for leprosy.
Materials and Methods
Ethics statement
The Ethics Committee of the Oswaldo Cruz Foundation approved all procedures described in this study. All subjects, none of which were minors, provided informed written consent.
Patients and specimens
Leprosy patients (29 LL and 29 BT) were recruited on a volunteer basis from the Leprosy Outpatient Unit (Oswaldo Cruz Foundation, Rio de Janeiro, RJ, Brazil). Patients were classified with leprosy according to the criteria of Ridley and Jopling [8], and serum samples were taken before and right after MDT conclusion (without fasting). Skin biopsy specimens (6-mm punch) were also collected from LL and BT patients before treatment and were used for metabolite extraction. The baseline characteristics of each group of individuals included in the study are shown in Table 1. None of the patients were under anti-inflammatory therapy at the time of serum and biopsy specimen collection.
Metabolite extraction
Serum samples were thawed and 200mL of serum were
extracted overnight at 220uC in 2-mL tubes with 750mL of methanol/chloroform (2:1, v/v) followed by vortexing and centrifugation at 1,5006g for 5 minutes at 4uC. It is important to note that serum samples were never thawed before the metabonomics analysis described below was performed. The supernatants were carefully transferred to new tubes and the samples were extracted once again with 500mL of methanol/
chloroform/water (2:1:0.8, v/v/v), vortexed, and centrifuged as described before [7]. The extracts were pooled, concentrated in a speedvac evaporator and dried under a nitrogen stream. For
Author Summary
metabolite extraction of frozen biopsies, specimens were thawed on ice, mechanically disrupted, and extracted with chloroform/ methanol/water (1:2:0.8, v/v/v) [9]. Samples were then parti-tioned with chloroform and methanol (2:1, v/v), according to the standard procedure of Folch et al. (1957) [10]. Pellets were extracted again with acetonitrile (10mL of acetonitrile for each mg of initial tissue) by vortexing for 10 minutes. Samples were clarified by centrifugation at 16,0006g for 5 minutes, all phases
were combined and extracts were dried and saved for further analysis.
Direct Infusion Fourier Transform Ion Cyclotron Resonance Mass Spectrometry (DI-FT-ICR-MS)
For metabolic profiling of sera, dried extracts were suspended in 70% methanol (100mL for each mL of sample), vortexed, and
cleared by centrifugation. Supernatants were collected and used as described below. Extracts were diluted 1:3 with 70% methanol containing either 0.2% formic acid (for positive ionization mode) or 0.2% ammonium hydroxide (for negative ionization mode) and spiked with predefined amounts of an ES tuning mix solution as the internal standard for mass calibration. For metabolic profiling of skin biopsies, dried extracts were resuspended in 60% acetonitrile (100mL per 10 mg of sample), vortexed, sonicated and cleared by centrifugation. Extracts were diluted 1:3 in ESI standard solutions containing either 0.2% formic acid (positive ion mode) or 0.5% ammonium hydroxide (negative ion mode). Solutions were then infused, using a syringe pump (KDS Scientific, Holliston, MA), at a flow rate of 2.5mL per minute, into a 12-T
Apex-Qe hybrid quadrupole-FT-ICR mass spectrometer (Bruker Daltonics, Billerica, MA) equipped with an Apollo II electrospray ionization source, a quadrupole mass filter, and a hexapole collision cell. Data were recorded in positive and negative ion modes with broadband detection and an FT acquisition size of 1,024 kilobytes per second within anm/zrange of 150 to 1,100. Other experimental parameters were: capillary electrospray voltage of 3,600 to 3,750 V, spray shield voltage of 3,300 to 3,450 V, source ion accumulation time of 0.1 second, and collision cell ion accumulation time of 0.2 second. To increase detection sensitivity, survey scan mass spectra in positive- and negative-ion modes were acquired from the accumulation of 200 (sera) or 400 (skin) scans per spectrum.
DI-FT-ICR-MS data processing
Raw mass spectrometry data were processed using a custom-developed software package, as described elsewhere [7]. Then, data analysis proceeded as previously described [3,11]. Principal Component Analysis (PCA) was performed using the freely available software Multibase (http://www.numericaldynamics. com/). To identify differences in metabolite composition between BT and LL sera and skin samples, and sera from both groups before and after MDT, we manually selected two groups of metabolites. The first group comprised metabolites that were present in one set of samples but not the other. The second group comprised metabolites present in the two sets of samples being compared, but at different levels. To identify the metabolites in the second group, we averaged the mass intensities of metabolites in each set of samples (BT or LL, before or after MDT) and calculated the ratios between averaged intensities of metabolites from those samples. To assign possible metabolite identities to m/z values present in one group of samples but not the others as well as those m/zshowing at least a 2-fold change in intensity between sets of samples,m/zof interest were queried against MassTRIX (version 2, http://metabolomics.helmholtz-muenchen.de/masstrix2/), a free-access software designed to incorporate masses into metabolic pathways using the Kyoto Encyclopedia of Genes and Genomes (KEGG) database (http://www.genome.jp/kegg/).
Lipoxin A4, prostaglandin D2, prostaglandin E2, leukotriene B4and resolvin D1 measurements
Lipoxin A4(LXA4), prostaglandin D2(PGD2), prostaglandin E2 (PGE2), leukotriene B4(LTB4) and resolvin D1 (RvD1) levels were measured in serum samples taken from BT (n = 20) and LL (n = 19) patients prior to and after MDT. In addition, measurements of these eicosanoids in serum samples from 10 healthy controls were taken for comparison. We used serum samples that had never been thawed and had been stored at 220uC. Measurements were performed using commercially-available kits according to the manufacturer’s instructions. PGD2, PGE2, LTB4 and RvD1 enzyme-linked immunoassay (EIA) kits were purchased from Cayman Chemical (Ann Arbor, USA). The LXA4 EIA kit was from Neogen (Lexington, USA). LXA4and RvD1 were extracted from serum samples using C18Sep-Pak columns (Waters; Elstree, UK) before analysis, following the manufacturer’s protocol.
Table 1.Baseline characteristics of leprosy patients and healthy controls.
Clinical sample Sera Skin biopsies
Group Control BT LL BT LL
Methoda EIA FTICRMS EIA FTICRMS EIA FTICRMS FTICRMS
Individuals (n) 10 4 25c 4 25d 4 4e
Male 6 3 9 3 18 2 2
Female 4 1 16 1 7 2 2
Age (median) 34.2 50.5 48 61.5 50 44 75
Age (min-max) 18–52 32–56 11–66 50–87 22–87 31–63 56–88
BI (median)b - 0 0 3.91 4.33 0 4.25
Groups included in this study: controls; BT, borderline tuberculoid patients; LL, lepromatous patients.
aEIA, enzyme-linked immunoassay; FTICRMS, Fourier transform ion cyclotron resonance mass spectrometry. bBI, baciloscopic index.
cFour of these patients underwent Type I reaction during treatment. dNine patients developed Type II reaction and two developed Type I reaction. eOne patient underwent Type II reaction.
Statistical analysis
Data were analyzed by two-tailed unpaired or pairedttests with 95% confidence intervals or Kruskall–Wallis non-parametric analysis of variance (ANOVA) and Dunn’s multiple-range post hoc test, as indicated. Outliers were detected using the Grubbs’ test and removed from data sets when indicated.
Results
BT and LL leprosy patients exhibit distinct serum metabolite profiles
Serum samples were obtained from 4 BT and 4 LL patients to analyze metabolic alterations during the course of leprosy, and DI-FT-ICR-MS was used to detect and relatively quantify small metabolites in these samples. Such high-throughput analysis yielded a total of 2,565 different m/z (metabolite features) from both BT and LL groups, which were detected from combined positive and negative ion modes (Table S1). A Principal Component Analysis plot (Figure 1A) illustrates the extensive differences in metabolic composition between sera from BT and LL patients. Due to the sample size no analysis could be done on gender and age. Nevertheless, a more refined analysis was then carried out to determine the extent of the metabolic differences between BT and LL leprosy patients. To investigate which of the metabolites detected in both BT and LL samples were present at different levels in these groups, the average intensities of all metabolites were calculated and results from each of the sample groups (BT and LL) were compared. Metabolites that showed changes of 2-fold or more were used for further analyses. Based on this analysis criterion, we found that 684 of the total 2,565 metabolites were present at different levels when comparing samples from BT and LL patients (Table S1). This represents 26.7% of all detectedm/z, supporting the notion that an extensive metabolic shift occurs during disease. Metabolite levels were affected to various degrees, with changes ranging from 2-fold to over 30-fold. The complete serum DI-FT-ICR-MS raw data set is shown in Tables S2 and S3.
Polyunsaturated fatty acid metabolites are increased in sera from LL patients when compared to BT patients
In order to identify the metabolic pathways most significantly disturbed during leprosy, we selected metabolites detected in both BT and LL patients showing at least a 2-fold difference between them and queried the MassTRIX database (version 2, http:// metabolomics.helmholtz-muenchen.de/masstrix2/) to determine putative metabolite identities. Figure 1B shows the categories of metabolites that differ between the two groups. Although many metabolic pathways were affected, our data suggest that the metabolism of omega-6 (linoleic and arachidonic acids) and omega-3 PUFAs (a-linolenic acid, EPA and DHA) are markedly modulated duringM. lepraeinfection, with higher levels of a diverse class of bioactive lipid mediators in LL sera when compared to BT sera. The effects ofM. lepraeinfection on specific classes of PUFAs are described in more detail below.
Arachidonic acid metabolism. The arachidonic acid (AA) pathway was the metabolic route with the highest number of metabolites having increased levels in sera of LL patients (58 potential metabolites) when compared to BT patients. On the other hand, only one putative metabolite in this pathway showed increased levels in BT patients when compared to LL patients. Figure S1 shows the human metabolic pathway of AA as it appears in KEGG, indicating the potential metabolites affected in LL serum. Besides AA itself (m/z303.23292), severalm/z correspond-ing to an array of potential AA derivatives were detected in higher
levels (two fold or higher) in LL sera. Thesem/z, together with their corresponding potential identities and relative levels detected in LL versus BT patients are shown in Table 2. Although statistical analysis did not yield significant p-values (p.0.05), this is not surprising due to the limited number of samples used and the inherent variability amongst human samples. Nevertheless, the high number of metabolites in this pathway that were identified by our exploratory method suggests that this is indeed an important component of the host’s response toM. lepraeinfection.
Through the action of cyclooxygenases (COX), AA is transformed to PGG2 and then to PGH2, which may be metabolized to other PGs (PGD2, PGE2, PGI2and PGF2a) and
thromboxanes (TXA2and TXB2). Several of these compounds, as well as their downstream products, were found in higher levels in LL sera, suggesting high activity of cyclooxygenases during M. lepraeinfection. PGF2ais an important AA metabolite involved in
chronic and acute inflammation. It has a local action and is quickly degraded to 15-keto-PGF2a upon reaching the
blood-stream. Levels of this metabolite are used as a parameter to measure the in vivo biosynthesis of PGF2a, as well as its release
(reviewed in [12]). An increase in the relative levels of a compound of m/z [M-H]2 351.21782, which may correspond to
15-keto-PGF2a (among others), was observed in LL patients (Table 2).
TXA2and PGI2are substances with opposite effects: while TXA2 is produced by platelets, has vasoconstrictive properties, and stimulates platelet aggregation, PGI2is a vasodilator synthesized by macrovascular endothelial cells that inhibits platelet activation, modulating platelet-vascular interactions [13]. TXA2 and PGI2 have the same molecular mass (m/z[M-H]2351.21782), and the same is true for their respective degradation products, TXB2 /6-keto-PGF1a(m/z [M-H]2 369.22832) and 11-dehydro-TXB2 /6-keto-PGE1 (m/z [M-H]2 367.21282). All of these m/z were present in higher levels in LL sera (Table 2).
Another fate of AA is its metabolism by lipoxygenases (5-, 12- or 15-LOX), leading to the formation of LTs, LXs and hepoxilins (HX). Hydroperoxyeicosatetraenoic acids (5-, 12-, or 15-HPETEs), hydroxyeicosatetraenoic acids (5-, 12- or 15-HETEs) and oxo-ETEs are bioactive products of these pathways (reviewed in [14]). Several of these compounds and their degradation products such as DHETs were found in higher levels in LL sera, suggesting a high activity of LOXs during M. leprae infection (Table 2). Peroxidation of AA occurs in the presence of free radicals, leading to the non-enzymatic formation of 8-isoprostane (8-iso-PGF2a), which possesses vasoconstrictive activities and
induces the COX-mediated formation of PGF2a. 8-isoprostane
has a short half-life, being metabolized to 2,3-dinor-8-iso-PGF2a
and 2,3-dinor-5,6-dihydro-8-iso-PGF2a, among others (reviewed
in [12]). In sera from LL patients, higher levels of 2,3-dinor-8-iso-PGF2a, but not of 8-isoprostane, were observed (Table 2), which
could be linked to the higher oxidative stress and lower antioxidant capacity observed in leprosy, more specifically in patients with the lepromatous form [15,16].
epoxide hydrolase [18]. On the other hand, one m/z that may correspond to a lecithin was found in higher levels in BT sera (m/z 704.52438, data not shown).
Linoleic acid can also be hydroxylated by both CYP and LOX to form HODEs, which can subsequently be oxidized to form oxoocta-decadienoic acids (oxoODEs). Compounds with m/z 293.21222 and m/z 295.22782, corresponding to potential oxoODEs and HODE, respectively, were detected in higher levels in sera from LL patients (Table 3). These metabolites have been shown to be potent activators of peroxisome proliferator-activated receptor gamma, PPAR-c [19]. As with metabolites in the arachidonic acid pathway, statistical analysis of the results obtained with metabolites of linoleic acid metabolism did not yield significant p-values (p.0.05) due to the limited number of samples used and the inherent variability amongst human samples. Nevertheless, the overrepresentation of this pathway in our metabonomics analysis suggests that it is also an important player in the pathophysiology of leprosy.
Omega-3 polyunsaturated fatty acid metabolism. Finally, higher relative amounts of potential metabolites derived from the omega-3 polyunsaturated fatty acids were observed in sera from LL patients when compared to sera from BT patients, as seen in Table 4. Again, statistical analysis did not yield significantp-values (p.0.05) due to the reasons mentioned previously but many metabolites of this pathway showed relative changes in the different patient groups, suggesting that this may be another important player during leprosy that should be investigated further. The a-linolenic acid metabolism in humans and the potential metabolites derived from omega-3 fatty acids with increased levels in LL in comparison to BT are indicated in Figure S3. Recently, the metabolism of omega-3 fatty acids, more specifically eicosapentae-noic acid (EPA) and docosahexaeeicosapentae-noic acid (DHA), has received considerable attention due to their anti-inflammatory, pro-resolving activities. EPA and DHA can be obtained directly from the diet or from enzymatic conversions of linolenic acid. Metabolites with masses corresponding to EPA (m/z 301.21732) and DHA (m/z 327.23302) were found in BT and LL sera, with higher levels being found in sera of LL patients. Both EPA and DHA are metabolized to 3-series PGs and TXs, 5-series LTs, E- and D-series resolvins (RvE and RvD), aspirin D-series resolvins, (neuro)protectin D1 (PD1) and maresins (MaR), respectively, which exert anti-inflam-matory and pro-resolution effects (reviewed in [20]). Interestingly, particularly higher levels ofm/z333.20712 and 375.21792, which may correspond to RvE2 and RvD1-RvD4, respectively, were detected in sera from LL patients (Table 4). Of note, higher levels of m/z359.22292, which may correspond to 6 different metabolites [RvD5, RvD6, (N)PD1, MaR1, 17-HpDHA (a marker of the D-series Rvs and (N)PD1 biosynthetic pathway) and 14-HpDHA (an intermediate in the synthesis of MaR1)] were also found in sera from LL patients. These data suggest that the metabolism of PUFAs is severely disturbed during leprosy; our data suggest that the production of anti-inflammatory, pro-resolving Rvs, PD1 and MaR derived from omega-3 fatty acid metabolism is highly exacerbated during leprosy, especially in its lepromatous form.
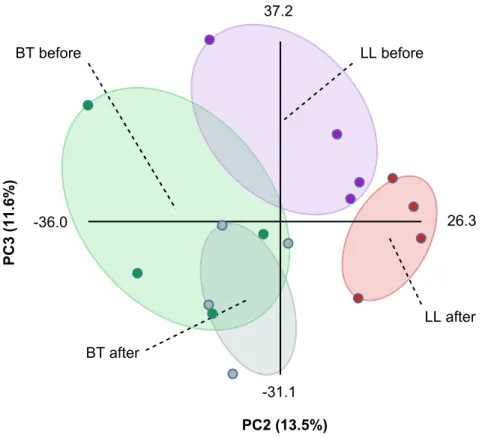
Multidrug therapy converts both BT and LL groups to a common polyunsaturated fatty acid metabolic
phenotype
In order to gain further insights into the metabolic changes elicited during leprosy, sera samples from the same patients were collected before and immediately after the conclusion of MDT (six and twelve months for BT and LL patients, respectively). Total metabolites were extracted and analyzed by DI-FT-ICR-MS as described above. As an attempt to compare the metabolic profiles of the four groups of samples, we performed Principal Component Analysis (PCA) on this dataset using Multibase (http://www. numericaldynamics.com/). As can be seen from Figure 2, such analysis showed a clear separation between the BT and LL groups. Also, the PCA showed a clear separation of the LL samples before and after MDT, although the separation of BT samples before and after treatment was modest. This is in line with more extensive effects of lepromatous leprosy on host metabolism due to the high bacillary burden. Nevertheless, due to the extensive effects of lepromatous leprosy on polyunsaturated fatty acid metabolism, we focused our analysis on the effect of MDT on this metabolic pathway in both BT and LL patients. MDT caused a decrease in the levels of most potential metabolites from the arachidonic acid pathway, both in the BT and LL groups (Table 2 and Figure S4). This suggests that, although higher levels of these metabolites were generally observed in LL samples when compared to BT, these molecules were present at increased levels in leprosy patients in general, both LL and BT. In contrast, potential metabolites derived from linoleic anda-linolenic acids were mostly affected by MDT only in LL patients, returning to levels similar to those originally found in BT patients (Tables 3 and 4). The more extensive effect of MDT on the metabolic profiles of LL patients supports our initial findings that samples from LL patients show higher levels of eicosanoids and other polyunsaturated fatty acid metabolites than samples from BT patients, and this correlates well with the bacillary burden observed in these clinical forms of leprosy. As shown in Tables 2–4, with the exception of a fewm/z, relative levels of most metabolites were indistinguishable when comparing BT and LL samples after MDT. In other words, MDT converted BT and LL patients to a common phenotype regarding the metabolic profiles of PUFAs.
Circulating levels of eicosanoids are altered in leprosy patients
Eicosanoids are lipid mediators that play a critical role as regulators of inflammation and the immune response generated during infection, including those caused by mycobacteria [21,22,23,24,25,26]. Among the potential eicosanoids altered during leprosy, several of them possess the same molecular mass. In order to confirm the modulation of some of these compounds duringM. lepraeinfection, levels of PGE2, PGD2, LXA4(m/z [M-H]2351.21782) as well as LTB
4(m/z[M-H]2335.22282) were screened by EIAs. Circulating levels of these mediators were determined in leprosy patients (BT, n = 25; LL, n = 25) and Figure 1. Metabonomics analysis of sera from leprosy patients.(a) Principal component analysis of metabolic alterations on sera from borderline tuberculoid (BT) and polar lepromatous leprosy (LL) patients. Raw DI-FT-ICR-MS data in both negative and positive ionization modes were combined and PCA was performed using Multibase (http://www.numericaldynamics.com/). Sample groups are indicated by the dashed lines. (b) Metabolic pathways altered in the polar forms of leprosy.m/zof interest detected in both negative and positive ionization modes were searched against the KEGG database (http://www.genome.jp/kegg/) using the MassTRIX software (version 2, http://metabolomics.helmholtz-muenchen.de/ masstrix2/). Bars indicate the number of metabolic features from each KEGG pathway that was affected by infection. Gray bars represent the number of metabolic features that were found in higher levels in BT patients (.2 fold), whereas white bars represent the metabolic features found in higher levels in LL patients.
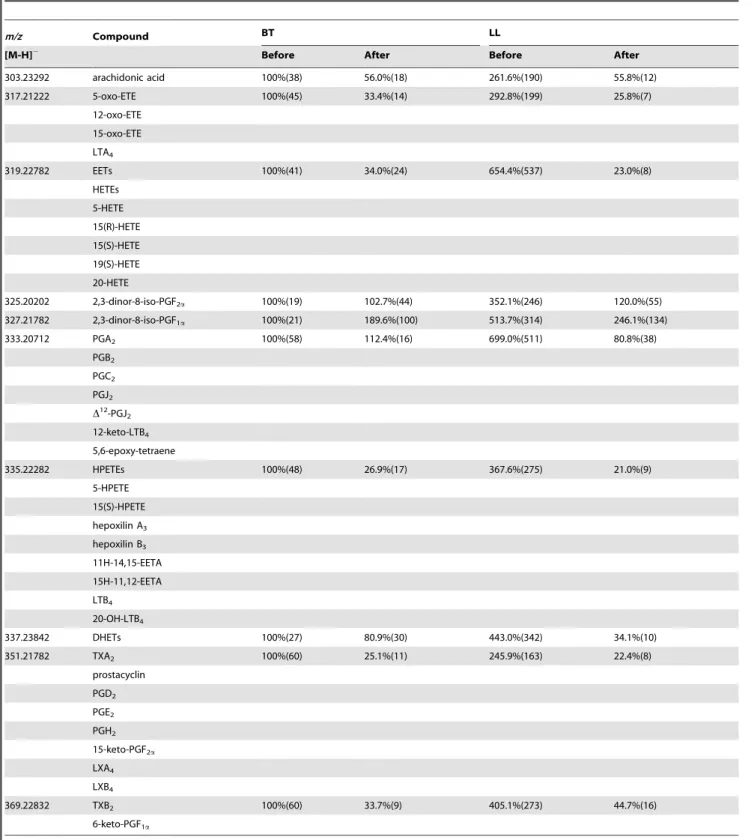
Table 2.Comparison of the relative levelsaof metabolites of the arachidonic acid pathway in sera from BT and LL patients before and after antibiotic treatment.
m/z Compound BT LL
[M-H]2 Before After Before After
303.23292 arachidonic acid 100%(38) 56.0%(18) 261.6%(190) 55.8%(12)
317.21222 5-oxo-ETE 100%(45) 33.4%(14) 292.8%(199) 25.8%(7)
12-oxo-ETE 15-oxo-ETE LTA4
319.22782 EETs 100%(41) 34.0%(24) 654.4%(537) 23.0%(8)
HETEs 5-HETE 15(R)-HETE 15(S)-HETE 19(S)-HETE 20-HETE
325.20202 2,3-dinor-8-iso-PGF2a 100%(19) 102.7%(44) 352.1%(246) 120.0%(55)
327.21782 2,3-dinor-8-iso-PGF1a 100%(21) 189.6%(100) 513.7%(314) 246.1%(134)
333.20712 PGA2 100%(58) 112.4%(16) 699.0%(511) 80.8%(38)
PGB2
PGC2
PGJ2 D12-PGJ2
12-keto-LTB4
5,6-epoxy-tetraene
335.22282 HPETEs 100%(48) 26.9%(17) 367.6%(275) 21.0%(9)
5-HPETE 15(S)-HPETE hepoxilin A3
hepoxilin B3
11H-14,15-EETA 15H-11,12-EETA LTB4
20-OH-LTB4
337.23842 DHETs 100%(27) 80.9%(30) 443.0%(342) 34.1%(10)
351.21782 TXA2 100%(60) 25.1%(11) 245.9%(163) 22.4%(8)
prostacyclin PGD2
PGE2
PGH2
15-keto-PGF2a
LXA4
LXB4
369.22832 TXB2 100%(60) 33.7%(9) 405.1%(273) 44.7%(16)
6-keto-PGF1a
aAbsent values were substituted with the limit of detection, represented by the lowest intensity value of any given sample. Then, averaged values from the untreated BT
serum samples (n = 4) were normalized to 100% and other samples were normalized accordingly. SD are shown in parentheses. PG, prostaglandin; LT, leukotriene; TX, thromboxane; EET, epoxyeicosatrienoic acid; oxo-ETE, oxoicosatetraenoic acid; HETE, hydroxyeicosatetraenoic acid; HPETE, hydroperoxyeicosatetraenoic acid; DHET, dihydroxyeicosatrienoic acid.
compared with their levels in healthy controls (n = 10). While no differences in LTB4levels were detected between different sample groups, the levels of PGD2and PGE2were significantly higher in LL patients when compared to BT (Figure 3), thus confirming the original observation thatm/z351.21782 was found in higher levels in LL serum by DI-FT-ICR-MS analysis (Table 2). Next, to
reinforce the notion that the altered production of eicosanoids observed in leprosy patients results from an active modulation by theM. lepraeinfection, serum concentrations of PGE2, PGD2and LTB4 in sera from BT and LL patients were measured at the conclusion of MDT and compared with the levels observed before treatment. By comparing pre- and post-MDT serum samples
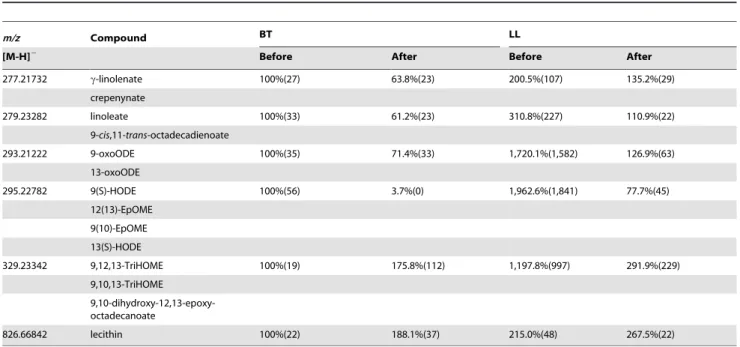
Table 3.Comparison of the relative levelsaof metabolites of the linoleic acid pathway in sera from BT and LL patients before and after antibiotic treatment.
m/z Compound BT LL
[M-H]2 Before After Before After
277.21732 c-linolenate 100%(27) 63.8%(23) 200.5%(107) 135.2%(29)
crepenynate
279.23282 linoleate 100%(33) 61.2%(23) 310.8%(227) 110.9%(22)
9-cis,11-trans-octadecadienoate
293.21222 9-oxoODE 100%(35) 71.4%(33) 1,720.1%(1,582) 126.9%(63)
13-oxoODE
295.22782 9(S)-HODE 100%(56) 3.7%(0) 1,962.6%(1,841) 77.7%(45)
12(13)-EpOME 9(10)-EpOME 13(S)-HODE
329.23342 9,12,13-TriHOME 100%(19) 175.8%(112) 1,197.8%(997) 291.9%(229) 9,10,13-TriHOME
9,10-dihydroxy-12,13-epoxy-octadecanoate
826.66842 lecithin 100%(22) 188.1%(37) 215.0%(48) 267.5%(22)
aAbsent values were substituted with the limit of detection, represented by the lowest intensity value of any given sample. Then, averaged values from the untreated BT
serum samples (n = 4) were normalized to 100% and other samples were normalized accordingly. SD are shown in parentheses. EpOME, epoxyoctadecenoic acid; HODE, hydroxyoctadecadienoic acid; TriHOME, trihydroxyoctadecenoic acid; oxoODE, oxooctadecadienoic acid.
doi:10.1371/journal.pntd.0002381.t003
Table 4.Comparison of the relative levelsaof omega-3 polyunsaturated fatty acids derivates in sera from BT and LL patients before and after antibiotic treatment.
m/z Compound BT LL
[M-H]2 Before After Before After
277.21732 a-linolenic acid 100%(27) 63.8%(23) 200.5%(107) 135.2%(29)
301.21732 EPA 100%(30) 51.8%(20) 253.4%(153) 38.4%(24)
305.24862 ETA 100%(37) 60.2%(18) 198.0%(145) 54.1%(12)
317.21222 18-HEPE 100%(46) 33.4%(14) 292.8%(200) 25.8%(7)
327.23302 DHA 100%(36) 74.2%(35) 199.0%(100) 95.5%(35)
333.20712 RvE2 100%(58) 112.4%(16) 699.0%(512) 80.8%(38)
349.20212 RvE1 100%(49) 37.1%(9) 193.0%(98) 30.8%(3)
359.22292 17-HpDHA 100%(41) 31.8%(11) 686.3%(539) 34.7%(11)
14-HpDHA RvD5,RvD6 (N)PD1 MaR1
375.21792 RvD1-RvD4 100%(48) 41.3%(16) 400.0%(265) 28.4%(4)
aAbsent values were substituted with the limit of detection, represented by the lowest intensity value of any given sample. Then, averaged values from the untreated BT
serum samples (n = 4) were normalized to 100% and other samples were normalized accordingly. SD are shown in parentheses. EPA, eicosapentaenoic acid; ETA, eicosatetraenoic acid; DHA, docosahexaenoic acid; RvE, E-series resolvins; HpDHA, hydroperoxydocosahexaenoic acid; RvD, D-series resolvins; (N)PD1, (neuro)protectin D1; MaR1, maresin 1. HEPE, hydroxyeicosapentaenoic acid.
Figure 2. Principal component analysis of the metabonomics data.Raw DI-FT-ICR-MS data in both negative and positive ionization modes were combined and PCA was performed using Multibase (http://www.numericaldynamics.com/). Plots show the separation of groups based on the pole of disease (BT, LL) and treatment status (before, after). Sample groups are indicated by the dashed lines.
doi:10.1371/journal.pntd.0002381.g002
Figure 3. Serum levels of eicosanoids in borderline tuberculoid and polar lepromatous patients determined by EIAs.Box-plots represent serum levels of PGD2(a), PGE2(b), LTB4(c) and LXA4(d) assessed in healthy controls, BT and LL patients, as indicated. Median values are
indicated by lines. Outliers were detected using the Grubbs’ test and removed. Group comparisons were evaluated with Kruskall–Wallis non-parametric analysis of variance (ANOVA) and Dunn’s multiple-range post hoc test. PGD2, prostaglandin D2; PGE2, prostaglandin E2; LTB4, leukotriene
B4; LXA4, lipoxin A4.P-values higher than 0.05 are not shown.
taken from the same patients, we observed significantly higher PGD2 levels in the BT group after the conclusion of MDT, in contrast to the heterogeneous behavior of this mediator observed in LL patients (Figure 4A). After treatment, the PGD2levels were similar between LL and BT (Figure S5). Regarding levels of PGE2, a decrease was observed in most LL patients, although 4 of them showed higher levels after treatment (Figure 4B). In contrast, no changes in PGE2 levels were observed in most BT patients after the conclusion of MDT, although 3 patients showed a decrease in its levels (Figure 4B). Even after treatment, PGE2 levels were significantly higher in LL versus BT patients (Figure S5). LTB4levels tended to decrease both in LL and BT patients, although 2 LL patients showed higher levels after conclusion of MDT (Figure 4C). Finally, as seen previously in the context of untreated patients, no differences between LTB4serum levels in LL versus BT patients were detected after conclusion of MDT (Figure S5).
We also measured the levels of LXA4 in serum samples and found that concentrations of this lipid mediator were significantly altered in leprosy patients when compared to healthy controls. LXA4is likely the major contributor tom/z[M-H]2351.21782, followed by PGE2. While PGD2, PGE2and LTB4 serum levels were below 0.6 ng/mL in most samples from leprosy patients, particularly in untreated LL patients, LXA4 levels were much higher, ranging from 2 to 17 ng/mL. As shown in Figure 3D, significantly higher levels of LXA4were detected in both BT and LL patients when compared to the controls, but no significant difference was found between these two groups. However, after treatment, serum LXA4levels in BT and LL patients returned to normal (Figure S5). The decrease in LXA4levels in LL and BT sera after the conclusion of MDT can be clearly seen in paired pre-and post-MDT serum samples taken from the same patients (Figure 4D). LXA4concentrations showed a statistically significant decrease after MDT, with a consistent behavior in all analyzed sera. These data suggest that LXA4is a major contributor ofm/z [M-H]2 351.21782 and point to a more predominant role of LXA4during leprosy.
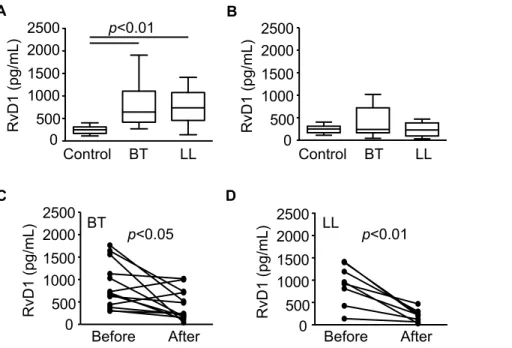
Circulating levels of resolvin D1 are altered in leprosy patients
Resolvins, including D and E series resolvins, are endogenous lipid mediators generated during the resolution phase of acute inflammation from the omega-3 polyun- saturated fatty acids docosahexaenoic acid (DHA) and eicosapentaenoic acid (EPA), having potent anti-inflammatory and pro-resolution actions in several animal models of inflammation. In order to confirm that the omega-3 polyunsaturated fatty acid metabolism is disturbed during leprosy, levels of RvD1 in sera from leprosy patients were measured by EIA. Circulating levels of this mediator were determined in leprosy patients (BT, n = 20; LL, n = 19) and compared with their levels in healthy controls (n = 6). Interestingly, the results were similar to those observed for LXA4, which also has anti-inflammatory and pro-resolution action. Levels of RvD1 were found to be significantly different in leprosy patients when compared to healthy controls (Figure 5A), returning to normal levels after treatment in both BT and LL patients (Figure 5B). The decrease in RvD1 levels in LL and BT sera after the conclusion of MDT can also be seen in paired pre- and post-MDT serum samples taken from the same patients (Figure 5C and D). However, there was no difference between levels of RvD1 between BT and LL sera before MDT (Figure 5A), in contrast to the profile observed for the m/z 375.21792 in the DI-FT-ICR analysis (Table 4). Thus, the difference observed in the metabonomic study could be due to other compounds with the same m/z such as RvD2–4 or others.
DI-FT-ICR-MS analysis of skin specimens reveals higher levels of polyunsaturated fatty acid metabolites in LL patients
To expand the metabolite profiles generated with serum samples, we performed a metabolomic analysis of human skin biopsies from 4 cases of LL and 4 cases of BT, looking for alterations in PUFA metabolism at the site ofM. lepraeinfection. To do so, we extracted metabolites from the biopsies and analyzed them through DI-FT-ICR-MS, as described above. The complete Figure 4. Circulating levels of eicosanoids in borderline tuberculoid and polar lepromatous patients before and after MDT determined by EIAs.Paired values of serum concentrations of PGD2(a), PGE2(b), LTB4(c) and LXA4(d) from each patient, as assessed in BT and LL
patients before and right after MDT conclusion. Each line represents one patient. Paired t tests were used for statistical analysis. PGD2, prostaglandin
D2; PGE2, prostaglandin E2; LTB4, leukotriene B4; LXA4, lipoxin A4.P-values higher than 0.05 are not shown.
skin DI-FT-ICR-MS raw data set is shown in Tables S4 and S5. Almost 2,000 metabolites were detected, and their relative abundance was compared between LL and BT lesions. Among the list ofm/zdetected, we selected metabolites showing at least a 2-fold difference between samples from BT and LL patients. As shown in Table 5,m/z potentially corresponding to docosapen-taenoic acid (DPA), DHA, AA, linoleic acid/9-cis,11-trans-octadecadienoate, 1-acyl-sn-glicero-3-phosphocholine (lysoleci-thin), lecithin and plasmenic acid were present in higher levels in LL lesions. In contrast, the mass 376.2226 Da, which corresponds to several potential metabolites of the arachidonic acid pathway, was present in higher levels in BT lesions. Although definitive metabolite identity cannot be determined using this method, our results suggest that phospholipids and products of PLA2activity accumulate in LL lesions, correlating with the higher levels of potential phospholipids and free unsaturated fatty acids and their derivatives observed in the serum of these patients. Of note, potential DPA (330.2559 Da) levels were about 50 times higher in LL lesions when compared to BT lesions (Table 5). DPA is a 22-carbon PUFA with anti-inflammatory properties derived from an elongation step of EPA, abundantly present in macro-phages treated with EPA [27].
Discussion
Although leprosy is one of mankind’s oldest diseases, the interplay between the human body andM. lepraeremains poorly understood. Research in leprosy lacks laboratory tools that can be used to predict susceptibility to the disease and disease progression, which are critical for an improved management of patients through the use of more rational therapeutic approaches. Among the branches of ‘‘omics’’, the recent development of high-throughput techniques that allow the simultaneous identification and quantification of small metabolites from different tissues and
biofluids is emerging as a powerful approach to investigate the modulation of host metabolism during infection, with the perspective to disclose potential contributors to disease pathology.
Table 5.Comparison of the relative levelsaof metabolites in skin biopsies from LL and BT patients.
Mass (Da) Compounds LL:BT
330.2559 DPA 50.6:1
328.2402 DHA 3.4:1
304.2402 arachidonic acid 2.9:1
332.2715 adrenic acid 1.9:1
280.2402 linoleic acid 32.7:1
9-cis,11-trans-octadecadienoate
703.5152 lecithin 2.8:1
656.4781 plasmenic acid 6.4:1
479.3376 1-acyl-sn-glycero-3-phosphocoline 8.1:1
376.2226 8-isoprostane 1:3.5
11,14,15-THETA 11,12,15-THETA 11-epi-PGF2a
PGF2a
trioxilin A3
trioxilin B3
aData are shown as the ratio of the averaged values from the LL skin samples
(n = 4) and the averaged values from the BT skin samples (n = 4). DPA, docosapentaenoic acid; DHA, docosahexaenoic acid; THETA, trihydroxyicosatrienoic acid; PG, prostaglandin.
doi:10.1371/journal.pntd.0002381.t005
Figure 5. Serum levels of resolvin D1 in borderline tuberculoid and polar lepromatous patients determined by EIAs.Box plots represent serum levels of RvD1 assessed in healthy controls, BT and LL patients before (A) and right after MDT conclusion (B), as indicated. Median values are indicated by lines. Group comparisons were evaluated with Kruskall–Wallis non-parametric analysis of variance (ANOVA) and Dunn’s multiple-range post hoc test. Paired values of serum concentrations of RvD1 from each patient before and right after MDT conclusion, as assessed in BT and LL patients, are shown in C and D, respectively. Each line represents one patient. Paired t tests were used for statistical analysis.P-values higher than 0.05 are not shown.
Herein, we have applied a metabonomics analysis of serum samples from leprosy patients to the comparison of host metabolism regulation during infection in two distinct clinical forms of the disease (lepromatous versus tuberculoid). Extensive differences in metabolic composition during leprosy were ob-served, supporting the notion that a unique metabolic shift occurs during disease. Moreover, serum composition of infected patients converged to a similar profile after conclusion of treatment, indicating that the differences observed resulted from M. leprae infection. When analyzing the metabolic pathways affected byM. leprae, a robust increase in the levels of potential AA metabolites was observed in LL patients in comparison to BT patients. However, MDT caused a decrease in the levels of most potential metabolites from the arachidonic acid pathway, both in the BT and LL groups. This suggests that, although higher levels of these metabolites were generally observed in LL samples when compared to BT, these molecules were present at increased levels in leprosy patients in general, both LL and BT. One caveat of our metabonomics study is the fact that only a limited number of samples was available for analysis. Therefore, an extensive statistical analysis was not feasible and the results of the metabonomics experiments must be taken with caution. Never-theless, this approach is very useful in an exploratory mode and many aspects that we have previously investigated using this methodology were confirmed using other techniques [3,11]. In order to ameliorate this issue, we used EIAs to measure the concentrations of a few molecules of interest in the serum of other leprosy patients and healthy controls. Higher levels of PGD2and PGE2 in LL sera when compared to BT sera were confirmed through EIAs. We also found high levels of LXA4in both LL and BT patients in comparison with healthy individuals. Of note was the enrichment of masses that may correspond to omega-3 PUFAs and their biologically-active, anti-inflammatory and pro-resolving Rvs, PD1 and MaR derivatives, some of which were also detected in LL skin lesions. Higher levels of RvD1 were detected by EIA in leprosy patients (both LL and BT), and decreased to normal levels after treatment. To our knowledge, this is the first study reporting the levels of LX and RvD1 during leprosy. The main conclusion of this study is that PUFA metabolism is markedly regulated during M. lepraeinfection, potentially contributing to multiple aspects of the immunopathogenesis of leprosy.
The finding of higher levels of potential free PUFAs both in sera and skin lesions of LL patients, and of lysophosphatidylcholine in LL lesions suggests a high lipid turnover in these lesions. These data agree with previous studies showing a higher expression of host PLA2and PLC in LL patients [28] and of the high PL activity detected in M. leprae preparations [29]. PGE2 levels were significantly higher in untreated LL patients, returning to levels similar to BT patients after the conclusion of MDT. Accordingly, increased cyclooxygenase-2 expression has been observed in biopsies from LL patients [26,30]. PGE2 is the main cyclooxy-genase product produced by macrophages, and it supports acute local inflammation, being at a first moment pro-inflammatory and at the same time immunosuppressive, because it inhibits cell-mediated immunity by selectively inhibiting Th1cytokines (IFN-c and IL-2) and suppressing IL-12 production in monocytes and dendritic cells (as well as the expression of its receptor), without interfering with the production of the Th2cytokines IL-4 and IL-5. Overproduction of PGE2 is observed in Th2-associated diseases (asthma, atopic dermatitis) (reviewed in [31]), which is the case of LL leprosy, where humoral immune responses are unable to control the infection. The observed increase in PGE2levels in sera from LL patients agrees with previous studies of PGE2inM. leprae, where it was observed in animal models (nude mice) that infected
macrophages obtained from footpad granulomas produced high levels of PGE2, which was associated with a down-regulation of macrophage and T-cell functions [21]. These functions were restored when PGE2biosynthesis was inhibited, eitherin vivo, when infected mice were subjected to a diet deficient in essential fatty acids, orin vitro, by treatment of cultured cells with indomethacin [21,22]. Human monocytes obtained from LL patients showed a high production of PGE2[24,32], and other studies showed that the lipid droplets induced in macrophages and Schwann cells by M. lepraeare sites for PGE2biosynthesis. Moreover, COX-2 was detected in lipid droplets present in nerve and dermal lesions of LL patients, suggesting that they constitute sites of PGE2productionin vivo[25,26].
Recent studies indicate that PGE2 may have different effects during the course of inflammation. At early stages, as previously described, PGE2presents a pro-inflammatory activity (reviewed in [31]). However, with the progress of the inflammatory process, it was observed that PGE2decreases the production of 4-series LTs through the inhibition of 5-lipoxygenases, and regulates the transcription of 15-lipoxygenase in neutrophils, switching the production of LTs to LXs (reviewed in [20]). Indeed, it has been recently shown that PGE2serves as a feedback inhibitor essential for limiting chronic inflammation in autoimmune arthritis [33]. Furthermore, PGE2inhibits the synthesis of the pro-inflammatory cytokines TNF-a and IL-1 by macrophages (reviewed in [31]). PGE2 may undergo a non-enzymatic dehydration reaction, forming the cyclopentenone PGA2and its isomerization products PGC2 and PGB2. Cyclopentenone PGs have reported anti-inflammatory activity, through activation of PPAR, specifically PPAR-a and PPAR-d in the case of PGA2 (reviewed in [34]). Interestingly, m/z 333.20712, which may correspond to PGA2, PGB2and PGC2, was detected in LL but not BT sera, probably as a consequence of the higher availability of PGE2in LL. Therefore, PGE2, in conjunction with its cyclopentenone PG derivatives, may play an immunosuppressive and anti-inflammatory role in LL.
Regarding PGD2, it is also a pro-inflammatory eicosanoid, and it elicits inflammatory and vascular responses through interaction with the D prostanoid receptor 1 (DP) and chemoattractant receptor-like molecule expressed on Th2cells (CRTH2). PGD2is capable of inducing chemotaxis of eosinophils, basophils, and Th2 cells, stimulating the production of IL-4, IL-5, and IL-13 in the latter [35], and thus eliciting a Th2 response, typical of LL immunopathology. Other studies of PGD2 synthase (PGDS) expression showed a drop in its biosynthesis after the beginning of the inflammatory process, reaching its lowest point at the peak of inflammation, and returning to normal levels as the inflamma-tion resolved, indicating a role of PGD2in the promotion of the resolution process. Similarly to PGE2, PGD2 can undergo spontaneous dehydrations, leading to the formation of 15-deoxy-D12,14-PGJ2(15d-PGJ2), which can also act via DP. However this PG acts mainly via intracellular receptors, activating PPAR-cand inhibiting nuclear factor kappa B (NF-kB). 15d-PGJ2 has anti-inflammatory and pro-resolution effects, inhibiting the secretion of IL-6, IL-1b, IL-12 and TNF-afrom macrophages, and downreg-ulating the production of inducible nitric oxide synthase (iNOS) [36]. 15d-PGJ2is a very unstable molecule; its intermediateD12 -PGJ2is formed by the dehydration of PGD2catalyzed by human serum albumin, which may bind and stabilizeD12
As mentioned above, the higher levels of LXA4, the predom-inant endogenously-generated LX, in leprosy patients suggested by the metabonomics analysis were confirmed by EIA. LXs are trihydroxytetraene-containing AA metabolites that are produced by at least 3 distinct LO pathways, involving interactions among diverse cell types, including leukocytes, epithelia, endothelia, and platelets. LXA4and/or its aspirin-triggered isomer, 15-epi-LXA4 have a number of reported in vitro activities, including: (a) inhibition of neutrophil chemotaxis, adherence, transmigration, and activation; (b) suppression of the production of diverse chemokines by epithelial cells and leukocytes; (c) inhibition of IL-12 production by dendritic cells; (d) upregulation of monocyte chemotaxis and ingestion of apoptotic neutrophils; and (e) suppression of MMP production, while stimulating production of tissue inhibitors of MMPs.In vivo, LXA4has been shown to have broad counter-regulatory properties, suppressing proinflammatory responses (preventing neutrophil-mediated damage, promoting the resolution of neutrophil-mediated inflammation), Th2-polarized responses (inhibiting inflammation and airway hyperresponsive-ness in experimental asthma), and Th1 responses (suppressing immunopathology during infection with Toxoplasma gondii) alike [20,37]. Moreover, LXA4 stimulates phagocytosis and IL-10 production in macrophages [38], a phenotype characteristic of foamy macrophages present in LL lesions [25].
Our metabonomics data on omega-3 PUFAs are sustained by a recent serum metabonomic analysis on leprosy patients, which showed a significant raise in the levels of EPA and DHA in sera from high-BI patients [39]. Also, hits that may correspond to DHA and DPA (a 22-carbon derivative of EPA) were detected in higher levels in skin lesions of LL patients when compared to BT lesions, reinforcing these data. Moreover, the remarkable differences in the levels of several potential omega-3 PUFA metabolites observed in leprosy patients before and after MDT, point to the participation of these bioactive lipid mediators in the immunopa-thology of leprosy. The anti-inflammatory properties of omega-3 PUFAs have been recently shown to be mediated, at least in part, by a new family of pro-resolving lipid mediators that include Rvs, PD1 and MaR (reviewed in [20]). Our metabonomics data showed the decrease ofm/z that may correspond to RvE1 and RvE2, RvD1–4, RvD5–6, PD1, as well as MaR1 after treatment. Indeed, high levels of RvD1 were found by EIA in serum samples of leprosy patients, which returned to normal levels after treatment. Moreover, anm/zthat corresponds to DPA was found in levels 50 times higher in skin biopsies of LL when compared to BT lesions.
Lipid mediators are produced in a temporally orchestrated fashion during inflammation. During the initial phases of inflammation, pro-inflammatory eicosanoids such as PGE2, PGD2 and LTB4 are generated. With time, a class-shift occurs towards anti-inflammatory and pro-resolving mediators (LXA4, 15d-PGJ2, Rvs, PD1 and MaR) that switch the inflammatory response off and restore homeostasis. Resolution of inflammation and return to homeostasis is actively mediated by these compounds and the failure of resolution is considered as one of the causes of chronic inflammatory diseases such as age-related macular degeneration, asthma, lupus erythematosus, atheroscle-rosis, chronic pulmonary disease, inflammatory bowel disease, multiple sclerosis, rheumatic arthritis and cancer [40]. In all of these cases, LX deficiency in association with high levels of pro-inflammatory mediators has been implicated in disease pathogen-esis. Thus, LXA4and its more stable synthetic analogues, as well as Rvs, PD1 and MaR and their agonists have emerged as novel therapeutic candidates via accelerated resolution of inflammation for the management of a broad range of disorders with an
inflammatory component, including type 2 diabetes and cardio-vascular diseases [41,42]. On the other hand, production of LXA4 early during inflammation was shown to delay resolution and, in the case of infection, promote pathogen persistence in the host. This is the case for infections withM. tuberculosisandM. marinum, where an imbalance between LXA4 and pro-inflammatory eicosanoids (PGE2and LTB4) during the early stages of infection has been shown to favor pathogen survival and multiplication [43].
Interestingly, a recent study on metabolic profiling of sera from tuberculosis (TB) patients also provided evidence for anti-inflammatory metabolic changes in this disease [44]. The authors found increased levels of kynurenine, the product of tryptophan catabolism by indoleamine 2,3 dioxygenase 1 (IDO1), in patients with active TB. This was significantly correlated with similarly increased abundance of the immunosuppressive stress hormone cortisol.
The metabonomics analysis presented herein discloses potential host tolerance mechanisms toM. leprae infection. Recently, the concept of disease tolerance as a defense strategy to infection has been introduced in the field of animal immunity (reviewed in [45]). While the immune system protects from infections primarily by detecting and eliminating the pathogen, tolerance does not directly affect pathogen burden, but rather, decreases immunopathology caused by the pathogens or the immune responses against them. Particularly the lepromatous pole of leprosy seems to be an excellent model to study disease tolerance in humans. Clinical data indicate that LL patients have developed tolerance mechanisms that allow them to survive with minimal pathology, despite the high bacterial burden. In LL patients, failure of the immune system to kill or inhibit M. leprae allows the mycobacteria to reproduce to very high numbers reaching multiple tissues and organs in a systemic infection. Heavy bacteremia is often observed in these patients but, in contrast to other bacterial infections, no symptoms of septicemia are observed. Moreover, a subtype of LL, known as diffuse LL, ‘‘pretty leprosy’’ or Lucio leprosy, appears in the earlier stages of disease as uniformly diffused, shiny infiltrations of all the skin of the body, without any actual lesions [46]. Increased tolerance to tissue damage can be achieved, in general, through tissue protection and repair. It is, therefore, reasonable to speculate that the higher levels of LXA4, and PGE2 levels, in association with the omega-3 PUFAs DHA, EPA, RvD1, and other potential Rvs, PD1 and MaR detected in leprosy patients may contribute to the molecular mechanisms that restrain the inflammatory responses in LL and at the same time favorM. leprae growth and persistence in the host. Indeed, the ameliorative effects of LXA4and omega-3 PUFA metabolites have been reported in animal models of sepsis and through the observation of their inhibitory effects on the inflammatory response to endotoxin in humans (reviewed in [42,47,48]). Although the role of these resolving lipid mediators is well established in acute infections, more detailed studies on chronic infections are needed to establish the function of these mediators in determining disease outcome. Deciphering the molecular details of tolerance mechanisms in leprosy may pave the way to new prevention and management strategies of leprosy reactions as well as new treatments for many human maladies, including infectious, inflammatory and autoim-mune diseases.
Supporting Information
http://www.genome.jp/kegg/). Metabolites in red are those that presented higher relative intensities in LL than in BT sera. Metabolites in black were not detected or were not affected over 2-fold. Detected m/z[M-H]2values from affected metabolites are shown in parentheses. PG, prostaglandin; LT, leukotriene; TX, thromboxane; EET, epoxyeicosatrienoic acid; oxo-ETE, oxoico-satetraenoic acid; HETE, hydroxyeicooxoico-satetraenoic acid; HPETE, hydroperoxyeicosatetraenoic acid; DHET, dihydroxyeicosatrie-noic acid; THETA, trihydroxyicosatriedihydroxyeicosatrie-noic acid.
(EPS)
Figure S2 The differential effect of leprosy clinical forms on linoleic acid metabolism.Schematic overview of the linoleic acid metabolic pathway (adapted from http://www. genome.jp/kegg/). Metabolites in red are those that presented higher relative intensities in LL than in BT sera. Metabolites in black were not detected or were not affected over 2-fold. Detected m/z [M-H]2 values from affected metabolites are shown in
parentheses. EpOME, epoxyoctadecenoic acid; HPODE, hydro-peroxyoctadecadienoic acid; HODE, hydroxyoctadecadienoic acid; TriHOME, trihydroxyoctadecenoic acid; DHOME, dihy-droxyoctadecenoic acid; DiODE, dihydroxyoctadecadienoic acid; oxoODE, oxooctadecadienoic acid.
(EPS)
Figure S3 The differential effect of leprosy clinical forms on omega-3 PUFA metabolism.Schematic overview of omega-3 PUFA metabolism (adapted from http://www. genome.jp/kegg/). E-series resolvins, D-series resolvins, protectins, and maresin metabolic pathways adapted from [49] are shown. Metabolites in red are those that presented higher relative intensities in LL than in BT sera. Detected m/z[M-H]2 values
from affected metabolites are shown in parentheses. Solid arrows, direct steps; dashed arrows, multiple steps that are not shown. EPA, eicosapentaenoic acid; DHA, docosahexaenoic acid; ETA, eicosatetraenoic acid; HEPE, hydroxyeicosatetraenoic acid; HpDHA, hydroperoxydocosahexaenoic acid; RvE, resolvin E; RvD, resolvin D; (N)PD1, (neuro)protectin D; MaR, maresin.m/z with relative changes that were close to 2-fold: *DHA = 1.99, **RvE1 = 1.93, ***ETA = 1.98. Fatty acids that can be obtained from the diet are indicated.
(EPS)
Figure S4 The impact of MDT on arachidonic acid metabolism of LL and BT patients.Schematic overview of arachidonic acid metabolism (adapted from http://www.genome. jp/kegg/). Metabolites in green are those that presented lower relative intensities after MDT in both BT and LL sera, and in red are those that presented lower relative intensities after MDT only
in LL sera. No metabolites showed reduced abundances after MDT in BT sera only. Metabolites in black were not detected or were affected below the 2-fold cut-off. Detected m/z [M-H]2 values from affected metabolites are shown in parentheses. PG, prostaglandin; LT, leukotriene; TX, thromboxane; EET, epox-yeicosatrienoic acid; HETE, hydroxyeicosatetraenoic acid; HPETE, hydroperoxyeicosatetraenoic acid; DHET, dihydroxyei-cosatrienoic acid.
(EPS)
Figure S5 Circulating levels of eicosanoids on leprosy patients after MDT.Box-plots represent the serum levels of PGD2(a), PGE2(b), LTB4 (c) and LXA4 (d) assessed in healthy controls, borderline tuberculoid patients (BT) after MDT and lepromatous leprosy patients (LL) after MDT. Median values are indicated by lines. Outliers were detected using the Grubbs’ test and removed. Group comparisons were evaluated with Kruskall– Wallis non-parametric analysis of variance (ANOVA) and Dunn’s multiple-range post hoc test. PGD2, prostaglandin D2; PGE2, prostaglandin E2; LTB4, leukotriene B4; LXA4, lipoxin A4. P -values higher than 0.05 are not shown.
(EPS)
Table S1 Overview of DI-FT-ICR-MS results from leprosy patients sera.
(XLSX)
Table S2 Raw DI-FT-ICR-MS data of serum samples, negative ionization.
(XLSX)
Table S3 Raw DI-FT-ICR-MS data of serum samples, positive ionization.
(XLSX)
Table S4 Raw DI-FT-ICR-MS data of skin samples, negative ionization.
(XLSX)
Table S5 Raw DI-FT-ICR-MS data of skin samples, positive ionization.
(XLSX)
Author Contributions
Conceived and designed the experiments: JJA LCMA CSdM KAM ALPC MdGMOH PTB MCVP. Performed the experiments: JJA LCMA CSdM KAM JH JP. Analyzed the data: JJA LCMA CSdM KAM JH JP ALPC MdGMOH PTB MRA BBF MCVP. Contributed reagents/materials/ analysis tools: CHB ALPC MdGMOH PTB MRA ENS. Wrote the paper: JJA LCMA CSdM KAM BBF MCVP.
References
1. WHO (2011) Leprosy Update, 2011. Weekly Epidemiological Report (WER). Switzerland: WHO. pp. 389–400.
2. Scollard DM, Adams LB, Gillis TP, Krahenbuhl JL, Truman RW, et al. (2006) The continuing challenges of leprosy. Clin Microbiol Rev 19: 338–381. 3. Antunes LC, Arena ET, Menendez A, Han J, Ferreira RB, et al. (2011) Impact
of salmonella infection on host hormone metabolism revealed by metabolomics. Infect Immun 79: 1759–1769.
4. Denery JR, Nunes AA, Hixon MS, Dickerson TJ, Janda KD (2010) Metabolomics-based discovery of diagnostic biomarkers for onchocerciasis. PLoS Negl Trop Dis 4: e834.
5. Lakshmanan V, Rhee KY, Wang W, Yu Y, Khafizov K, et al. (2012) Metabolomic Analysis of Patient Plasma Yields Evidence of Plant-Like alpha-Linolenic Acid Metabolism in Plasmodium falciparum. J Infect Dis 206: 238– 248.
6. Psychogios N, Hau DD, Peng J, Guo AC, Mandal R, et al. (2011) The human serum metabolome. PLoS One 6: e16957.
7. Han J, Danell RM, Patel JR, Gumerov DR, Scarlett CO, et al. (2008) Towards high-throughput metabolomics using ultrahigh-field Fourier transform ion cyclotron resonance mass spectrometry. Metabolomics 4: 128–140.
8. Ridley DS, Jopling WH (1966) Classification of leprosy according to immunity. A five-group system. Int J Lepr Other Mycobact Dis 34: 255–273.
9. Bligh EG, Dyer WJ (1959) A rapid method of total lipid extraction and purification. Can J Biochem Physiol 37: 911–917.
10. Folch J, Lees M, Sloane Stanley GH (1957) A simple method for the isolation and purification of total lipides from animal tissues. J Biol Chem 226: 497–509. 11. Antunes LC, Han J, Ferreira RB, Lolic P, Borchers CH, et al. (2011) Effect of antibiotic treatment on the intestinal metabolome. Antimicrob Agents Che-mother 55: 1494–1503.
12. Basu S (2008) F2-isoprostanes in human health and diseases: from molecular mechanisms to clinical implications. Antioxid Redox Signal 10: 1405–1434. 13. Cheng Y, Austin SC, Rocca B, Koller BH, Coffman TM, et al. (2002) Role of
14. Buczynski MW, Dumlao DS, Dennis EA (2009) Thematic Review Series: Proteomics. An integrated omics analysis of eicosanoid biology. J Lipid Res 50: 1015–1038.
15. Prasad CV, Kodliwadmath MV, Kodliwadmath GB (2008) Erythrocyte glutathione peroxidase, glutathione reductase activities and blood glutathione content in leprosy. J Infect 56: 469–473.
16. Jyothi P, Riyaz N, Nandakumar G, Binitha MP (2008) A study of oxidative stress in paucibacillary and multibacillary leprosy. Indian J Dermatol Venereol Leprol 74: 80.
17. Patwardhan AM, Scotland PE, Akopian AN, Hargreaves KM (2009) Activation of TRPV1 in the spinal cord by oxidized linoleic acid metabolites contributes to inflammatory hyperalgesia. Proc Natl Acad Sci U S A 106: 18820–18824. 18. Moghaddam MF, Grant DF, Cheek JM, Greene JF, Williamson KC, et al.
(1997) Bioactivation of leukotoxins to their toxic diols by epoxide hydrolase. Nat Med 3: 562–566.
19. Altmann R, Hausmann M, Spottl T, Gruber M, Bull AW, et al. (2007) 13-Oxo-ODE is an endogenous ligand for PPARgamma in human colonic epithelial cells. Biochem Pharmacol 74: 612–622.
20. Serhan CN (2010) Novel lipid mediators and resolution mechanisms in acute inflammation: to resolve or not? Am J Pathol 177: 1576–1591.
21. Sibley LD, Krahenbuhl JL (1988) Induction of unresponsiveness to gamma interferon in macrophages infected with Mycobacterium leprae. Infect Immun 56: 1912–1919.
22. Adams LB, Gillis TP, Hwang DH, Krahenbuhl JL (1997) Effects of essential fatty acid deficiency on prostaglandin E2 production and cell-mediated immunity in a mouse model of leprosy. Infect Immun 65: 1152–1157. 23. Divangahi M, Desjardins D, Nunes-Alves C, Remold HG, Behar SM (2010)
Eicosanoid pathways regulate adaptive immunity to Mycobacterium tubercu-losis. Nat Immunol 11: 751–758.
24. Montreewasuwat N, Curtis J, Turk JL (1987) Interleukin 1 and prostaglandin production by cells of the mononuclear phagocyte system isolated from mycobacterial granulomas. Cell Immunol 104: 12–23.
25. Mattos KA, D’Avila H, Rodrigues LS, Oliveira VG, Sarno EN, et al. (2010) Lipid droplet formation in leprosy: Toll-like receptor-regulated organelles involved in eicosanoid formation and Mycobacterium leprae pathogenesis. J Leukoc Biol 87: 371–384.
26. Mattos KA, Oliveira VG, D’Avila H, Rodrigues LS, Pinheiro RO, et al. (2011) TLR6-driven lipid droplets in Mycobacterium leprae-infected Schwann cells: immunoinflammatory platforms associated with bacterial persistence. J Immunol 187: 2548–2558.
27. Norris PC, Dennis EA (2012) Omega-3 fatty acids cause dramatic changes in TLR4 and purinergic eicosanoid signaling. Proc Natl Acad Sci U S A 109: 8517–8522.
28. Cruz D, Watson AD, Miller CS, Montoya D, Ochoa MT, et al. (2008) Host-derived oxidized phospholipids and HDL regulate innate immunity in human leprosy. J Clin Invest 118: 2917–2928.
29. Wheeler PR, Ratledge C (1991) Phospholipase activity of Mycobacterium leprae harvested from experimentally infected armadillo tissue. Infect Immun 59: 2781–2789.
30. Kiszewski AE, Becerril E, Baquera J, Ruiz-Maldonado R, Hernandez Pando R (2003) Expression of cyclooxygenase type 2 in lepromatous and tuberculoid leprosy lesions. Br J Dermatol 148: 795–798.
31. Kalinski P (2012) Regulation of immune responses by prostaglandin E2. J Immunol 188: 21–28.
32. Misra N, Selvakumar M, Singh S, Bharadwaj M, Ramesh V, et al. (1995) Monocyte derived IL 10 and PGE2 are associated with the absence of Th 1 cells and in vitro T cell suppression in lepromatous leprosy. Immunol Lett 48: 123– 128.
33. Chan MM, Moore AR (2010) Resolution of inflammation in murine autoimmune arthritis is disrupted by cyclooxygenase-2 inhibition and restored by prostaglandin E2-mediated lipoxin A4 production. J Immunol 184: 6418– 6426.
34. Straus DS, Glass CK (2001) Cyclopentenone prostaglandins: new insights on biological activities and cellular targets. Med Res Rev 21: 185–210. 35. Xue L, Gyles SL, Wettey FR, Gazi L, Townsend E, et al. (2005) Prostaglandin
D2 causes preferential induction of proinflammatory Th2 cytokine production through an action on chemoattractant receptor-like molecule expressed on Th2 cells. J Immunol 175: 6531–6536.
36. Surh YJ, Na HK, Park JM, Lee HN, Kim W, et al. (2011) 15-Deoxy-Delta(1)(2),(1)(4)-prostaglandin J(2), an electrophilic lipid mediator of anti-inflammatory and pro-resolving signaling. Biochem Pharmacol 82: 1335–1351. 37. Aliberti J, Serhan C, Sher A (2002) Parasite-induced lipoxin A4 is an endogenous regulator of IL-12 production and immunopathology in Toxoplas-ma gondii infection. J Exp Med 196: 1253–1262.
38. Souza DG, Fagundes CT, Amaral FA, Cisalpino D, Sousa LP, et al. (2007) The required role of endogenously produced lipoxin A4 and annexin-1 for the production of IL-10 and inflammatory hyporesponsiveness in mice. J Immunol 179: 8533–8543.
39. Al-Mubarak R, Vander Heiden J, Broeckling CD, Balagon M, Brennan PJ, et al. (2011) Serum metabolomics reveals higher levels of polyunsaturated fatty acids in lepromatous leprosy: potential markers for susceptibility and pathogenesis. PLoS Negl Trop Dis 5: e1303.
40. Lee CH (2012) Resolvins as new fascinating drug candidates for inflammatory diseases. Arch Pharm Res 35: 3–7.
41. Borgeson E, McGillicuddy FC, Harford KA, Corrigan N, Higgins DF, et al. (2012) Lipoxin A4 attenuates adipose inflammation. FASEB J 26: 4287–4294. 42. Spite M, Serhan CN (2010) Novel lipid mediators promote resolution of acute
inflammation: impact of aspirin and statins. Circ Res 107: 1170–1184. 43. Tobin DM, Vary JC, Jr., Ray JP, Walsh GS, Dunstan SJ, et al. (2010) The lta4h
locus modulates susceptibility to mycobacterial infection in zebrafish and humans. Cell 140: 717–730.
44. Weiner J, 3rd, Parida SK, Maertzdorf J, Black GF, Repsilber D, et al. (2012) Biomarkers of inflammation, immunosuppression and stress with active disease are revealed by metabolomic profiling of tuberculosis patients. PLoS One 7: e40221.
45. Medzhitov R, Schneider DS, Soares MP (2012) Disease tolerance as a defense strategy. Science 335: 936–941.
46. Pfaltzgraff R, Bryceson A (1985) Clinical Leprosy. In: Hastings R, editor. Leprosy. New York: Churchill Livingstone Inc. pp. 134–176.
47. Eisen DP (2012) Manifold beneficial effects of acetyl salicylic acid and nonsteroidal anti-inflammatory drugs on sepsis. Intensive Care Med 38: 1249– 1257.
48. Walker J, Dichter E, Lacorte G, Kerner D, Spur B, et al. (2011) Lipoxin a4 increases survival by decreasing systemic inflammation and bacterial load in sepsis. Shock 36: 410–416.