ANALYSIS OF EXPORTS FROM THE METALLURGICAL SECTOR DURING THE
ECONOMIC CRISIS IN ROMANIA
NICOLAE ECOBICI
ASSOCIATE PROFESSOR PH.D., CONSTANTIN BRANCUSI UNIVERSITY OF TARGU-JIU
[email protected]
IRINA ELENA CHIRTOC
ASSISTANT PH.D, CONSTANTIN BRANCUSI UNIVERSITY OF TARGU-JIU
[email protected]
GABRIELA BU
Ș
AN
LECTURER PH.D, C CONSTANTIN BRANCUSI UNIVERSITY OF TARGU-JIU
[email protected]
DORU CÎRNU
PROFESSOR PH.D., CONSTANTIN BRANCUSI UNIVERSITY OF TARGU-JIU
[email protected]
Abstract
Starting from the fact that the exports are one of the direct factors influencing the economic growth of a country, the influence of the activity of the companies in the metallurgical sector on the volume of exports from Romania in the period 2008-2014 is analyzed in this paper. The multifactorial regression model is use in the analysis.
Keywords: metallurgical industry; export; economic growth; Romania
Clasificare JEL : F31, L61
1.
Introduction
After the economic crisis in late 2008, the metallurgical activities in Romania recorded a significant decline, with lasting implications on production capacity and jobs in the metallurgical units.
The paper presents the evolution of exports of metallurgical products in Romania during the economic crisis, in the period 2008-2014: the evolution of the exports of metallurgic products compared to GDP, the share of the exports of metallurgical products in total exports and the number of companies and the turnover in the metallurgical industry.
This paper analyzes, using the multifactorial regression model, the interdependence between the export of products in the metallurgical industry and the independent variables: the turnover indexes, industrial production indexes and labor productivity indexes in Romania.
2. Literature review
The impact of the outbreak of the economic crisis in late 2008 is felt differently across industrial branches and its influence on their long-term developments is different [1].
Undoubtedly that there is no top field whose progress is not influenced by the performances of the used materials nowadays. The material is a “living organism” that is an integrated part of the human society and represents one of the main factors in its development. The knowledge and rational use of the materials is an inexhaustible source of technical progress. Therefore, there is no surprise that this field is enjoying the economic interest, and especially the scientific one, materialized by the efforts allocated to researches [2].
Although with a rich tradition, from a leading position among the major manufacturers of world metallurgy/ siderurgy in the 80s, almost all the major industrial complexes, except AcelorMittal from Galaţi, disappeared or if they produce something, these unfortunately are just losses, due to certain disastrous privatizations.
The ARDIMET specialists appreciate that at least 10 years of economic boom would be needed in order that the Romanian siderurgy market to reach again the levels from the top years of the industry [3].
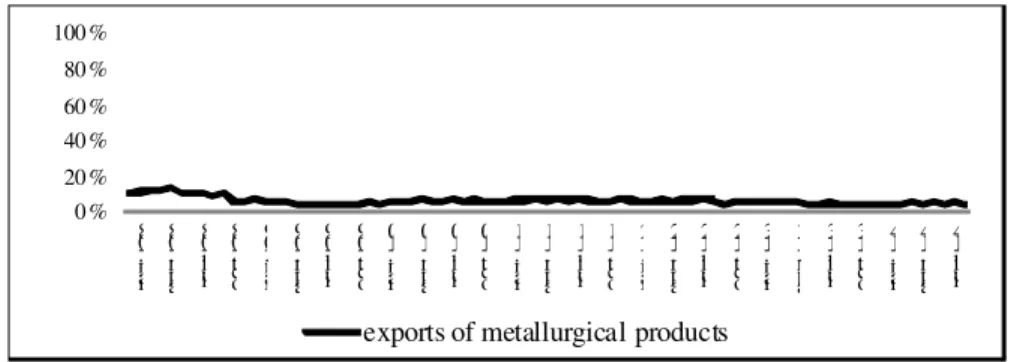
0 % 20 % 40 % 60 % 80 % 100 % ia n .-0 8 a p r. -0 8 iu l. -0 8 o ct .-0 8 ia n .-0 9 a p r. -0 9 iu l. -0 9 o ct .-0 9 ia n .-1 0 a p r. -1 0 iu l. -1 0 o ct .-1 0 ia n .-1 1 a p r. -1 1 iu l. -1 1 o ct .-1 1 ia n .-1 2 a p r. -1 2 iu l. -1 2 o ct .-1 2 ia n .-1 3 a p r. -1 3 iu l. -1 3 o ct .-1 3 ia n .-1 4 a p r. -1 4 iu l. -1 4
exports of metallurgical products
The need to achieve certain positive effects in the operators’ activity from the metallurgical industry is undeniable both in terms of the importance to create goods in this branch for the economic activity, and of their contribution to the economic growth [5].
3. The evolution of exports of metallurgical products in Romania during the economic crisis
The main indicator of the economic growth for a country is the gross domestic products (GDP). It is obvious that the exports are the engine for an economy to restore because the correlation between exports and the economic growth is a direct and positive one: GDP = consumption + investments + exports – imports
The metallurgical sector contributed very little to the GDP value, both in industry and on the economic total in the period 2008-2014, as it can be noticed from Figure 1.
Figure 1 The evolution of the exports of metallurgic products compared to GDP
The low value of the exports from the metallurgical sector can also be seen in Figure 2, where these do not exceed 20% of the total value of the export from Romania.
Figure 2 The share of the exports of metallurgical products in total exports
The low value of the exports of metallurgical products is due to the small number of companies that have the main activity in this field, and also the small turnover that they register as shown in Table 1.
Table 1 The number of companies and the turnover in the metallurgical industry
Years
Number of companies with CA > 0 Turnover
Total number
Metallurgical industry Total million euro
Metallurgical industry
number % million euro %
2008 507271 469 0.092 215908.7 4782.27 2.215
2009 474047 445 0.094 190393.1 2621.79 1.377
2010 444813 406 0.091 219186.6 3945.91 1.800
2011 438786 399 0.091 240474.9 4953.22 2.060
2012 450448 407 0.090 255194.8 4595.79 1.801
2013 454839 375 0.082 289662 4573.77 1.579
For transformation we used the medium course communicated by the National Bank of Romania. Although it should be an important engine for GDP, the exports from the metallurgic industry do not have enough force to drag the Romanian economy, due to the pretty low activity in this field.
4. The use of the multifactorial regression model in the analysis of the export in the
metallurgical sector
The interdependence between the export of products in the metallurgical industry and a series of independent variables in this sector are analyzed using the multifactorial regression model.
The analysis starts from a data set comprising the dependent variable – the export of products FOB (yi) and the
independent variables: the turnover indexes - ICA (x1), industrial production indexes - IPi (x2) and labor productivity
indexes - IW (x3).
The data were processed on a 76 months period (January of 2008 – April of 2014), from the monthly bulletins issued by the National Institute of Statistics [7].
The analysis is started from the following structure of the regression model: yi = β0 + β1x1 + β2x2 + β3x3 + ɛ,
where β0, β1, β2, β3, are the parameters of the model, and – random variable. Two hypothesis are taken into account:
β1≠ 0 şi β0 = 0.
Using the “Regression” procedure in the Excel application, the value of the parameters and of the random variable is calculated, and the statistic power of the model is also tested with the t model, F model and Durbin Watson test, opting for a confidence level α = 0,05.
The coefficients of multiple correlation are first calculated to measure the intensity between the resulting variable and the factorial variables, and also the coefficients of determination to establish the share wherewith the independent variables influence the dependent variable, for the two hypothesis taken into account.
Table 2 Statistics of regression
Summary output Summary output
Pentru β1≠ 0 Pentru β0 = 0
Multiple R 0.923436 0.993572
R Square (R2) 0.852734 0.987184
Adjusted R Square (Rc 2
) 0.846598 0.973135
Standard Error 29.09216 29.04929
Observations (n) 76 76
Source: own processing by using [7, 8]
It can be seen from Table 2 that the value of the coefficient of multiple correlation (R) is quite high, fact leading to the conclusion that there is a pretty intense connection between the exports of products from the metallurgical industry and the turnover, industrial production and labor productivity indexes in this sector.
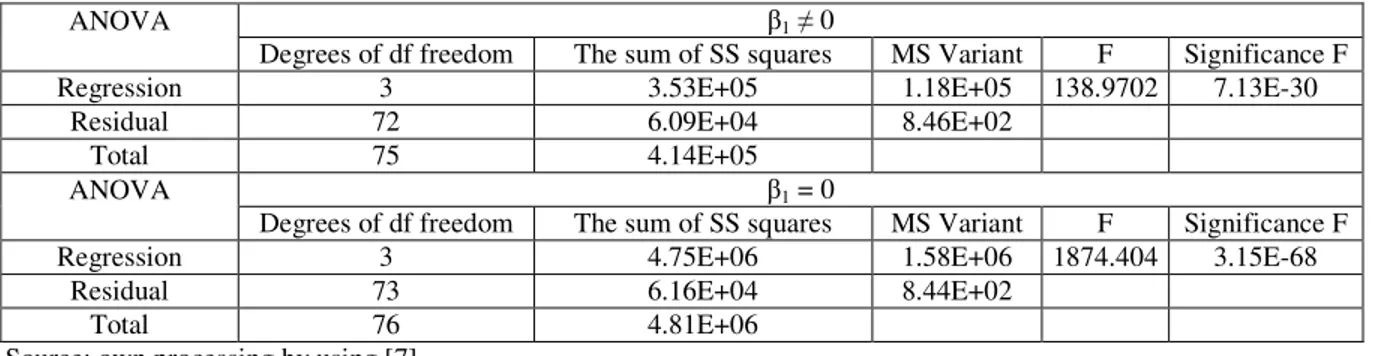
Table 3 Analysis based on ANOVA table
ANOVA β1≠ 0
Degrees of df freedom The sum of SS squares MS Variant F Significance F
Regression 3 3.53E+05 1.18E+05 138.9702 7.13E-30
Residual 72 6.09E+04 8.46E+02
Total 75 4.14E+05
ANOVA β1 = 0
Degrees of df freedom The sum of SS squares MS Variant F Significance F
Regression 3 4.75E+06 1.58E+06 1874.404 3.15E-68
Residual 73 6.16E+04 8.44E+02
Total 76 4.81E+06
Source: own processing by using [7]
Analyzing deeper the connection between these variables using the multiple determination coefficient. It can say that: 85,27% of the exports were influenced by independent variables, in the case of the hypothesis: β1≠ 0 and 98,71% of the
exports were influenced by the independent variables, in the case of the hypothesis: β1 = 0. The standard error for β1≠ 0 is
From Table 3, correlated with the values that Ftabled = Fa;k-1;n-k can have, it can be said that:
- in the case of the variant β1 ≠ 0, Ftabled = F0,05;3;72 = 2,732 < Fcalculated = 138,9702. This situation determines the entrance
to the rejection area of the null hypothesis;
- in the case of the variant β1 = 0, Ftabled = F0,05;3;73 = 2,730 < Fcalculated = 1874,404. The null hypothesis is also rejected in
this case.
Therefore, it can be said that the chosen model models are statistically significant.
The same conclusion of validity of the models, the strong dependence between the variables can be drawn from the significance threshold value (Significance F): for β1 ≠ 0, Significance F = 3,13E – 30 < 0,05; for β1 = 0,
Significance F = 3,15E – 68 < 0,05.
It can be said after the analysis of variation that the value of the exports of the metallurgical products from Romania is significantly influenced by the turnover, industrial production and labor productivity indexes in metallurgy.
Table 4 The value of the model coefficients and the analysis of the significance threshold Variant 1 yi = β0 + β1x1 + β2x2 + β3x3 + ɛ
P - value Interpretation
The interval during which the coefficient
takes values
Coefficients Standard
Error P - value Lower 95 %
Upper 95 %
Intercept β0 - 16.3044 18.40209 0.378562
> 0,05, this coefficient is not statistically
significant, but only incidental. - 52.9883339 20.37947
X Variable 1 β1 1.923547 0.235603 7.56E-12 < 0,05, the coefficient is significantly
different from zero 1.453881002 2.393213
X Variable 2 β2 1.809876 0.493105 0.000462 < 0,05, the coefficient is significantly
different from zero 0.826889013 2.792862
X Variable 3 β3 - 0.73806 0.167945 3.75E-05 < 0,05, the coefficient is significantly
different from zero - 1.072852967 - 0.40327 Variant 2 yi = β1x1 + β2x2 + β3x3 + ɛ
P - value Interpretation
The interval during which the coefficient
takes values
Coefficients Standard
Error P - value Lower 95 %
Upper 95 %
X Variable 1 β1 1.977255 0.227336 6.88E-13
< 0,05, the coefficient is significantly
different from zero 1.524175 2.430334
X Variable 2 β2 1.586682 0.423279 0.000353 < 0,05, the coefficient is significantly
different from zero 0.743088 2.430276
X Variable 3 β3 - 0.7866 0.158526 4.42E-06
< 0,05, the coefficient is significantly
different from zero - 1.10254 - 0.47065 Source: own processing by using [7]
Econmetric models can be made according to Table 4.
Variant 1: yi = - 16.3044 + 1.923547x1 + 1.809876x2 - 0.73806x3.
The interpretation of the model coefficient by the appeared modifications:
- a change of the export of products by 1,923547 units is produced when modifying one unit of the turnover index in the metallurgical industry;
- a change of the export of products by 1,80987 units is produced when modifying one unit of the industrial production index in the metallurgical industry;
- a change of the export of products by – 0,73806 units is produced when modifying one unit of the labor productivity index in the metallurgical industry.
Variant 2: yi = 1.977255x1 + 1.586682x2 - 0.7866x3.
The interpretation of the model coefficient by the appeared modifications:
- a change of the export of products by 1,977255 units is produced when modifying one unit of the turnover index in the metallurgical industry;
- a change of the export of products by 1,586682 units is produced when modifying one unit of the industrial production index in the metallurgical industry;
Although the tests applied to these models led to the conclusion that the model in the independent variable β1 =
0 would be better, the fact that this cannot be submitted to the statistic test for Durbin-Watson autocorrelation detection, the analysis of the exports based on the variable where β1 ≠ 0 is continued.
Thus, the value of the Durbin-Watson variable is calculated based on the residues calculated by the “regression” procedure of the used application in order to check the hypothesis of the independence of the errors. Thus:
where ɛi – is the residues.
The obtained value is compared with the critical values du = 1,71 and dl = 1,54 taken from Durbin-Watson
distribution table for n = 76 and k = 4. It can be noticed that the calculated value is smaller than dl, resulting a positive
autocorrelation of the values, and so the rejection of the null hypothesis. In order to take the best decision, it is checked if d > 4 – dl = 2,29.
It is inferred that the null hypothesis is rejected, and the chosen model is statistically significant.
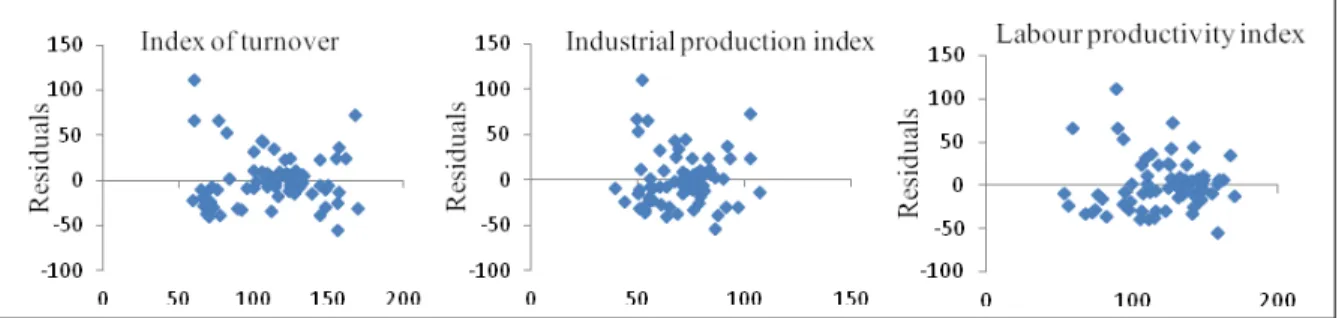
The quality of the model is also facilitated by the graphics presented in Figure 3, automatically built by the used application.
Figure 3 The graphics of the residues for each independent variable
The normal probability plot is presented in Figure 4 from where it results an approximately linear distribution of the probabilities.
Figure 4 Normal Probability Plot
From the analysis made for a series of 76 months, it results that the size of the exports in the metallurgical industry is influenced by the turnover, industrial production and labor productivity.
The economic modeling is based on the hypothesis that the variables of interest are random, in the sense that the values they are going to take in the future are uncertain [8].
5. Conclusions
The analyzed indicators, correlated with a quality management in companies, both in terms of labor productivity and finding certain external markets to sell off the products, ensure the economic growth and stability in the country.
6. References
[1] Zaharia, M., Babucea, A. G., Bălăcescu, A., Răbonțu C., Metallurgical industry in Romania in the context of the economic crisis, Metalurgija 54 (2015) 2, 445 – 448.
[2] Şerban, V.A, Răduţă, A., Science and material engineering, Politehnica Publishing House, Timişoara, 2006. [3] Cojocar A., Disaster: The steel works produced by up to 75 % less in S1, Ziarul financiar, 20.09.2009. [4] http://www.zf.ro/eveniment/exporturile-au-ajutat-economia-in-criza-dar-nu-au-avut-suficienta-forta-trendul-este-dat-de-consumul-intern-13252116.
[5] Dobrotă, G., Ungureanu, M., D., The dimensioning of performance in metallurgical industry from Romania, Metalurgija 54 (2015) 3, 583 - 586.
[6] https://www.anaf.ro/indicatori/indfinanciari.
[7] National Institute of Statistics, Monthly statistical bulletin, 2008 – 2014
[8] Bălăcescu, A., Chirtoc, I., The analysis of the interregional mobility flows - the use of the linear econometric model, Romanian Statistical Review no. 8 / 2010.
[9] www.insse.ro [10] www.bnr.ro