Why Do Cryptic Species Tend Not to
Co-Occur? A Case Study on Two Cryptic Pairs of
Butterflies
Raluca Vodă1,2, Leonardo Dapporto3, Vlad Dincă1,4, Roger Vila1*
1Butterfly Diversity and Evolution Lab, Institut de Biologia Evolutiva (CSIC-Universitat Pompeu Fabra), Barcelona, Spain,2Departament de Genètica i Microbiologia, Universitat Autònoma de Barcelona,
Bellaterra, Spain,3Department of Biological and Medical Sciences, Oxford Brookes University, Headington, Oxford, United Kingdom,4Biodiversity Institute of Ontario, University of Guelph, Guelph, Ontario, Canada
Abstract
As cryptic diversity is being discovered, mostly thanks to advances in molecular techniques, it is becoming evident that many of these taxa display parapatric distributions in mainland and that they rarely coexist on islands. Genetic landscapes, haplotype networks and eco-logical niche modeling analyses were performed for two pairs of non-sister cryptic butterfly species,Aricia agestis-A.crameraandPolyommatus icarus—P. celina(Lycaenidae), to specifically assess non-coexistence on western Mediterranean islands, and to test potential causes producing such chequered distribution patterns. We show that the morphologically and ecologically equivalent pairs of species do not coexist on any of the studied islands, al-though nearly all islands are colonized by one of them. According to our models, the cryptic pairs displayed marked climatic preferences and‘precipitation during the driest quarter’was recovered as the most important climatic determinant. However, neither dispersal capacity, nor climatic or ecological factors fully explain the observed distributions across particular sea straits, and the existence of species interactions resulting in mutual exclusion is sug-gested as a necessary hypothesis. Given that the studied species are habitat generalists, feeding on virtually unlimited resources, we propose that reproductive interference, together with climatic preferences, sustain density-dependent mechanisms like“founder takes all”
and impede coexistence on islands. Chequered distributions among cryptic taxa, both sister and non-sister, are common in butterflies, suggesting that the phenomenon revealed here could be important in determining biodiversity patterns.
Introduction
Adaptation to different abiotic elements (e.g. climate, geomorphology and soil) and biotic re-sources determines the fundamental niche of a species. The occupancy of this theoretically suit-able space is in turn constrained by other abiotic and biotic factors (such as geographic barriers and species interactions) that shape the realized niche of a species [1–4]. In the last decade,
OPEN ACCESS
Citation:VodăR, Dapporto L, DincăV, Vila R (2015) Why Do Cryptic Species Tend Not to Co-Occur? A Case Study on Two Cryptic Pairs of Butterflies. PLoS ONE 10(2): e0117802. doi:10.1371/journal. pone.0117802
Academic Editor:Carlos López-Vaamonde, Institut National de la Recherche Agronomique (INRA), FRANCE
Received:February 24, 2014
Accepted:December 31, 2014
Published:February 18, 2015
Copyright:© 2015 Vodăet al. This is an open access article distributed under the terms of the Creative Commons Attribution License, which permits unrestricted use, distribution, and reproduction in any medium, provided the original author and source are credited.
Funding:Funding for this research was provided by the Spanish Ministerio de Economía y Competitividad (Projects CGL2010-21226/BOS and CGL2013-48277-P and a predoctoral fellowship to R. Vodă, AP-2010-5409), by the European Commission through a Marie Curie International Outgoing Fellowship for Career Development to V. Dincă(project no. 625997), and by the projects“Barcoding Italian Butterflies”and
considerable progress has been made to provide researchers with essential data (climatic, envi-ronmental and distributional, e.g. GBIFhttp://www.gbif.org/, BIOCLIMhttp://www.
worldclim.org/bioclim[5], Socioeconomic Data And Applications Center (SEDAC)http:// sedac.ciesin.columbia.edu/) and methodological tools to unravel the relative importance of bi-otic and abibi-otic factors in determining the observed distribution of species [6–9]. Among all
concurrent effects, a direct evaluation of biotic interactions such as competition and reproduc-tive interference requires particularly complex and long-term studies [10–13]. For this reason,
in most cases, the importance of species interactions is indirectly evaluated through compara-tive studies or by testing the power of models that, in addition to climatic and environmental variables, include biotic variables potentially correlated with the supposed interaction, such as the presence of the presumably competing species [9,14–18].
A recent study on passerine birds examined a series of sister species and revealed that rates of secondary sympatry are positively associated with both phylogenetic and morphological dis-tance between species. The authors suggested that competition between ecologically similar species limits their possibilities to occur in sympatry [17]. The use of a large number of sister species allowed a comprehensive comparative analysis, but eliminated the possibility to exam-ine the nature of the interactions between non-sister species that can also be morphologically and ecologically similar, despite being phylogenetically relatively distant. A recent comparative study of the entire butterfly fauna of the western Mediterranean revealed that complexes of cryptic taxa show lower co-occurrence than other congeneric non-cryptic species [19]. Among these, several examples of non-sister cryptic taxa with chequered distributions have been re-ported. Interestingly, such ecologically and morphologically similar species tend to be parapa-tric on mainland and apparently many display chequered distributions on islands, even over narrow sea straits [20–25]. Such a pattern could represent a signal of interspecific interactions
[17,26,27].
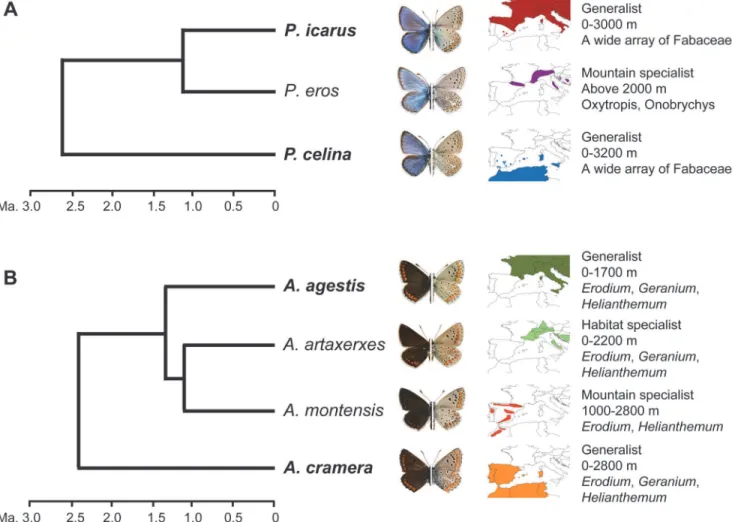
Here, we indirectly test for the existence of mutual exclusion, using as a model two pairs of non-sister cryptic butterfly species:Polyommatus icarus-P.celina, andAricia agestis-A. cra-mera. The genetic structure and evolutionary relationships of these species have been recently documented [21,22].Polyommatus icarusandP.celinaare parapatric, habitat generalist spe-cies, are found over a broad altitudinal range, and feed on a wide array of host plants (Fig. 1A).
Polyommatus celinahas been only recently recognized as a distinct species, and it can be reli-ably distinguished fromP.Icarusbased on both nuclear and mitochondrial genetic markers, while morphological traits only show minor trends of variation[21,28]. However,P.icarusis phylogenetically closer toP.eros, a genetically and morphologically differentiated mountain taxon that feeds on a more restricted number of host plants [21,28]. Similarly,A.agestisis a habitat generalist and ubiquitous Palaearctic species that is phylogenetically closer to the boreo-montaneA.artaxerxesand the montaneA.montensis. The sister of this clade isA. cra-mera, which occurs in the south-western Mediterranean and is almost identical toA.agestisin ecology and external morphology, but it is differentiated genetically and in the male genital morphology[22] (Fig. 1B). The recognition of these taxa as species or subspecies has been de-bated [29,30], but what it is important in our case is that the phylogenetically divergent pairs are parapatric and show higher morphological similarity than the sympatric and phylogenetic closer taxa. Moreover, the parapatric pairs are habitat generalists [31] that occur from sea level to high mountains, both in highly anthropic and in non-managed areas, and their varied host plants represent a virtually continuous and unlimited resource over space. Thus, it is unlikely that their distributions are constrained by habitat quality and host plant presence [10].
We sequenced a large number of specimens for all four cryptic species from the entire west-ern Mediterranean region, with a special effort on the currently known contact areas (Iberia, the Sicily channel, the Messina channel and the strait of Bonifacio). We combined phylogeny, Competing Interests:The authors have declared
distribution modeling, genetic landscapes, and the evaluation of dispersal capabilities for each taxon and showed that the biogeographical patterns consistent with mutual exclusion for these cryptic species cannot be fully explained either by climatic preferences or by limited
dispersal capabilities.
Methods
Ethics Statement
No specific permits were required for the studied areas in France, Italy and North Africa (Mo-rocco, Algeria and Tunisia), because the locations were not privately owned or protected in any way, and the field studies did not involve endangered or protected species. All necessary per-mits for the field studies in Spain were obtained from the competent public bodies: environ-mental agencies of the Comunidades Autónomas, the Natural Parks of Sierra Nevada, Montseny and Picos de Europa, and Reserva Natural Illes Columbretes.
Fig 1. Model species. A. The evolutionary relationships, external appearance, western Mediterranean distribution and ecological preferences for
Polyommatus icarus,P.erosandP.celina.Polyommatus icarusandP.celinaare almost identical ecologically and morphologically, butP.icarusis phylogenetically closer toP.eros, a morphologically differentiated mountain species that feeds on a more restricted number of host plants.B. The evolutionary relationships, external appearance, western Mediterranean distribution and ecological preferences forAricia agestis,A.artaxerxes,A.
montensisandA.cramera.Aricia agestisis a habitat generalist phylogenetically the closest to a pair of specialist species:Aricia artaxerxes(boreo-montane) andA.montensis(montane).Aricia cramerais phylogenetically more distant toA.agestis, although both species are almost identical ecologically
and morphologically.
Molecular data and genetic landscape
We analyzed the cytochromecoxidase I(COI) mitochondrial marker for 325P.icarus-P.celina
and 262A.agestis-A.crameraspecimens from the western Mediterranean mainland and most of the islands in this region (S1 Table). Total genomic DNA was extracted using Chelex 100 resin, 100–200 mesh, sodium form (Biorad), under the following protocol: one leg was
re-moved and introduced into 100μL of Chelex 10% and 5μL of Proteinase K (20 mg⁄mL) were
added. The samples were incubated overnight at 55°C and were subsequently incubated at 100° C for 15 minutes. Samples were then centrifuged for 10 seconds at 3.000 rpm. A 658-bp frag-ment at the 5’end of the mitochondrial gene (COI) was amplified by polymerase chain reaction
using the primers LepF1 (5´-ATTCAACCAATCATAAAGATATTGG-3´) and LepR1
(5´-TAAACTTCTGGATGTCCAAAAAATCA-3´) [32]. Double-stranded DNA was amplified through polymerase chain reactions (PCR) in 25-μL volumes containing: 14.4μL autoclaved Milli-Q water, 5μL 5x buffer, 2μL 25 mM MgCl2, 0.5μL 10 mM dNTPs, 0.5μL of each primer (10μM), 0.1μL Taq DNA Polymerase (Promega, 5U/μL) and 2μL of extracted DNA. The typ-ical thermal cycling profile was: first denaturation at 92°C for 60 s, followed by five cycles of 92°C for 15 s, 49°C for 45 s and 62°C for 150 s, and then by 35 cycles of 92°C for 15 s, 52°C for 45 s and 62°C for 150 s and a final extension at 62°C for 420 s. PCR products were purified and sequenced by Macrogen Inc. Sequences were edited and aligned using GENEIOUS PRO 6.0.5 created by Biomatters (http://www.geneious.com/). A part of the sequences generated by this study have been obtained at the Biodiversity Institute of Ontario, Canada. In this case a glass fibre protocol [33] was employed to extract DNA and PCR and DNA sequencing were carried out following standard DNA barcoding procedures for Lepidoptera [34]. All new sequences have been deposited in GenBank (accession numbers KM459029—KM459439, and
KP052710). Neighbour-Joining (NJ) phylogenetic trees for identification purposes were ob-tained using MEGA 5.05 [35], with 100 bootstrap pseudo-replicates to assess the robustness of the tree clades.
To create genetic landscapes for each species pair, a matrix of p-distances and a table of GPS coordinates (decimal degrees format) for the corresponding samples were imported in R 3.0.2. When more than one sample belonged to the same location, mean genetic distances have been computed. Using the“deldir”package, we calculated a Delaunay triangulation among the GPS
coordinates of the collection sites (S1 Fig.). Since the segments composing the triangles have different lengths and genetic distances tend to increase with geographic distance following dif-ferent trends according to organisms and scale [36–38], we computed a series of preliminary
regressions (linear with original values, linear with log-transformed values, and asymptotic re-gression) and selected the one showing the highest fit (R2). Subsequently, we computed residu-als of the selected regressions between dissimilarities and geographical distances. For all pairs of areas connected in the Delaunay triangulations, we attributed the residual p-distance calcu-lated between those areas to the midpoint of each segment [39]. The residual values and mid-point locations were imported in QGIS 2.0.1. (www.qgis.org), and the values interpolated using the inverse distance weighting algorithm to generate a visual representation of the spatial distri-bution of genetic divergence [39].
Haplotype networks and evaluation of dispersal constraints
dispersal event when a haplotype was shared between two areas separated by a sea strait. We also scored a dispersal event if two haplotypes occurring in areas separated by sea straits were directly linked in the haplotype network. When calculating the sea crossing capacity of the spe-cies, we used the-50m isobath, representing an approximate mean sea depth between glacial maxima and interglacial periods. Some of the investigated islands were connected to mainland areas according to this isobath (Elba, Pianosa and Ischia to Italy, Levant to France, Levanzo to Sicily) and hence no dispersal was scored in these cases. We conservatively excluded particular-ly long dispersal events when the genetic pattern could also be explained by extinction or non-detection of some haplotypes. As an additional source of information, we used island groups that are outside the studied area, but where some of the four studied species occur (eastern Mediterranean forP.icarusandA.agestis, Canary Islands forP.celinaandA.cramera), and re-constructed the minimum number and shortest over-sea dispersal events required for these species to achieve the observed distributional pattern. Finally, we plotted the frequency of the observed dispersal lengths in order to verify if the unobserved events determining the che-quered distributions lie within the inferred dispersal capability of each species.
Ecological niche modeling
In order to test if the observed chequered distributions of the species pairs can be explained by climatic factors, we performed ecological niche modeling for each of the four species. Based on molecular results, reliable observations, and data from literature, we gathered over 7000 pres-ence points for these species in the study area. For areas close to the contact zones we exclusive-ly used presence points based on molecular results. In order to eliminate clustered occurrences due to unbalanced sampling, we filtered the datasets by randomly selecting points at a mini-mum distance of 0.5 degrees using the function gridSample of the R package“dismo”. The
se-lection of 0.5 degrees has been made as a visual best compromise between maintaining the largest possible number of occurrence data and a good level of homogeneity. After filtering, we obtained 599 records forP.icarus, 128 forP.celina, 444 forA.agestisand 322 forA.cramera
ones [44]. The distribution of each species was modeled using 100 replicates, subsample and random seed, with 25% of the presence data to test the model and 75% to train the model. All other settings were left by default. To plot the maps for the predicted species occurrences we considered as potentially suitable areas, those cells showing logistic values higher than the max-imum training sensitivity plus specificity logistic threshold [45]. In order to test the importance of species interactions, we performed another set of species distribution modeling analyses in which we used the presence of the corresponding cryptic species as an additional categorical layer. The new layers were generated by alpha-convex hulls based on the presence data of each species. In order to obtain the best compromise between local convexity and the actual distri-bution of species we used the function alhull of the R package“alphahull”with the alpha value
set to ten. Each 0.1 degree cell of the layers was categorized as 1 if internal to the convex hull (species occurring in the area of the cell) and as 0 if external (species not recorded to occur in the area of the cell). The convex hull layer of each species was then included as a categorical variable in a new MaxEnt analysis of its corresponding cryptic species.
In order to evaluate the relative importance of highly correlated predictors in the models, we inspected both the percent contribution of each variable to the model and the Jackknife out-put produced by MaxEnt. Because the Jackknife regularized training gain for models per-formed without one of the variables are expected uninformative in case of high collinearity, we used instead the training gain of the models, which tested the performance of each variable in-dividually [41]. The least important variable returned by the climatic models was removed from the interaction analyses in order to use the same number of variables in both series of analyses.
Results
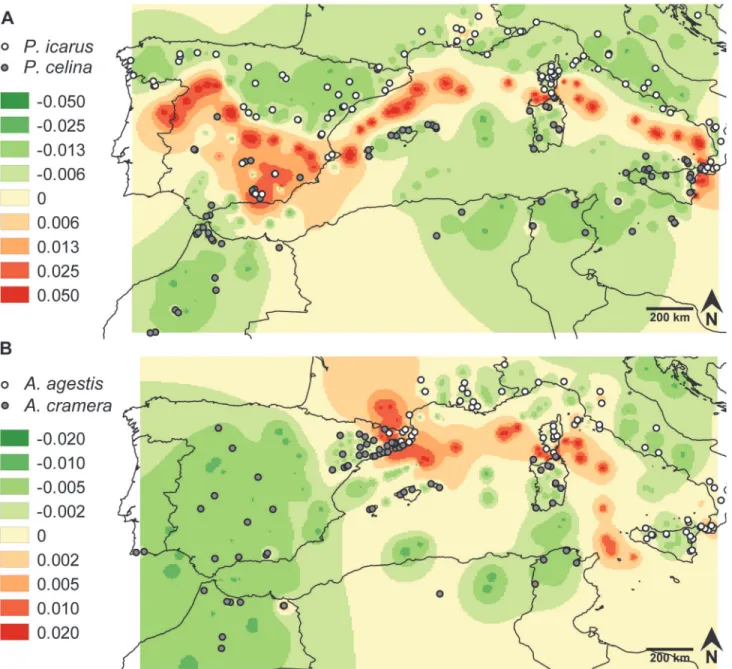
Locating hotspots of mutual exclusion: genetic landscape
The phylogenetic trees based on COI sequences (S2 Fig.) resulted in clearly differentiated clades for each species in accordance with previous studies [21,22]. Among the regressions used to correct the genetic distances according to geographic distances, the relationship of orig-inal p-distances against log-transformed geographic distances showed the best fit. As expected for the reduced geographic scale involved in the Delaunay triangulation, the asymptotic regres-sion failed in finding any significant solution. We thus computed and interpolated the residuals between p-distance and log-geographic distance. The resulting genetic divergence landscapes and the assignment of individuals to a species based on their position in the phylogenetic tree indicated, for both cryptic pairs, parapatry on mainland with a contact zone in the Iberian Pen-insula, and not a single case of coexistence on islands (Fig. 2). ForPolyommatus, the strongest genetic divergence with respect to geographic distance corresponded to abrupt changes of dis-tributions across the narrow Messina and Bonifacio straits, along the Tyrrhenian Sea between Italy and Sardinia, between the Balearics and Iberia and between northern and southern Iberia. In southern Iberia the picture became more complex due to the existence of isolated popula-tions ofP.Icarusin particular mountaintops, such as Sierra Nevada and Sierra de La Sagra. For
Aricia, the highest divergence emerged across the Bonifacio strait, along the Tyrrhenian Sea, between North Africa and Sicily, between the Balearics and France, in Catalonia and along the Pyrenees. As a result of intraspecific divergence, minor differentiation was also found between Corsica and the Tuscan Archipelago and between Sicily and the Italian Peninsula. In summary, for both species pairs the most pronounced genetic differences were located over sea areas, con-firming that sea straits have strong power in the formation and maintenance of
Evaluation of dispersal constraints based on haplotype networks
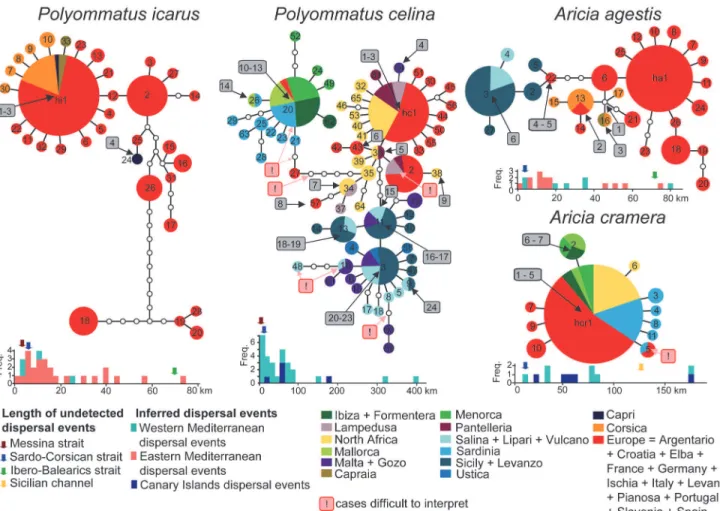
Haplotype networks of the studied species showed different degrees of complexity, but in all cases intraspecific divergences were small enough so that the biogeographical history could be explained by Quaternary environmental changes and by the dispersal capabilities of the butter-flies, instead of vicariance caused by older geological events. Regardless of the hypothetical lo-cation of the ancestor, the most parsimonious series of dispersal events that could have produced the observed patterns are highlighted inFig. 3,S3andS4Figs.Aricia cramera
showed a simple pattern with a widespread haplotype and some satellite ones connected by a single substitution (Fig. 3). Among dispersal events that could have produced the observed dis-tributions (Fig. 3andS3a Fig.), we retained that the pattern showed by haplotype hcr5,
Fig 2. Genetic landscapes obtained for the sequenced specimens of the two pairs of cryptic species.The color gradient represents residuals of COI genetic p-distances.A.Polyommatus icarusandP.celina.B.Aricia agestisandA.cramera.
indicating dispersal from Spain to Sardinia, can be more parsimoniously explained by conver-gence or by the extinction or undetected presence of this haplotype in the Balearics. In order to obtain a conservative measurement of the frequencies of dispersal lengths, we excluded this ambiguous event. A minimum of five steps was required to attain the occurrence pattern ofA.
crameraover the Canary Islands (S3b Fig.). The dispersal length frequency, measured between the-50m isobaths, showed that the unrecorded Sardinia-Corsica dispersal event, potentially al-lowingA.cramerato mix withA.agestispopulations in Corsica, would have been among the shortest dispersal events detected for this species. Conversely, the length of a hypothetical dis-persal between Tunisia and Sicily is showed to be much less frequent (Fig. 3).
Aricia agestisshowed a slightly more complex pattern. Corsica has been presumably colo-nized only once by an undetected haplotype that has drifted on both Corsica and mainland and successively reached Elba Island (connected to Italy in the-50 m isobath) and Capraia from Corsica (Fig. 3). Sicily has been apparently colonized in two events followed by differenti-ation and successive colonizdifferenti-ation of the Aeolian Islands. We thus scored six dispersal events (S3c Fig.), to which another between Sicily and Malta should be added becauseA.agestiswas present in Malta at least until 30 years ago [46]. The examination of the distribution in the
Fig 3. Haplotype networks and evaluation of dispersal events over the sea.Inferred over-sea dispersal events are numbered in grey rectangles, and ambiguous cases that were excluded from the analyses are highlighted in pink squares. The lengths of the dispersal events for the study area have been measured according to the-50m isobath and are displayed in histograms (cyan blocks), together with minimal dispersal events based on the distribution of the same species in the eastern Mediterranean (red blocks) and Canary Islands (blue blocks). The width of the key sea-straits Sardinia-Corsica, Italy-Sicily, Tunisia-Sicily and Ibero-Balearic are indicated by blue, red and green arrows, respectively.
eastern Mediterranean, where onlyA.agestisis to be found, showed that a minimum of 14 dis-persal events occurred in that region (S3d Fig.). Again, the Corsica-Sardinia dispersal would be among the shortest events recorded for this species, thus demonstrating that the dispersal capa-bilities have not been the limiting factor for the colonization of Sardinia byA.agestis.
According to previous results [21],P.celinashowed three main lineages associated with i) Spain-Maghreb-southern Sicilian islands, ii) Balearics-Sardinia-Spain, iii) Sicily, circum-Sicilian islands. Spain and Malta harbour specimens belonging to two different lineages, which indicates that they can coexist in sympatry (S2 Fig.). According to such a complex pattern we scored a minimum of 24 overseas dispersal events (Fig. 3,S4a Fig.). We did not consider seven ambiguous events for the same reasons discussed forA.cramera. Four other events can be rec-ognized for the Canary Islands (S4b Fig.). The comparison of the length of these events in the-50 m isobath with those required to colonize Italy from Sicily and Corsica from Sardinia re-vealed that such unrecorded dispersal events would have been among the shortest ones per-formed by this species.
Two well-separated lineages could be identified forP.icarus: one widely distributed over the whole Palaearctic region and one ranging from Sierra Nevada to France and Crete[21]. One Palaearctic haplotype found on Corsica, Capraia and Capri also occurs on mainland. There-fore, Corsica and Capraia seem to have been recently colonized and only once, while Capri has been colonized at least two times (Fig. 3). No evidence for other overseas dispersal events in the-50m isobath could be detected (Fig. 3,S4c Fig.). In the eastern Mediterranean at least 25 events(S4d Fig.) were necessary to justify the distribution on islands and most of them are lon-ger than those required to reach Sicily from the Italian Peninsula and Sardinia from Corsica.
In summary, a number of successful colonization events were inferred from the haplotype networks and distributions on islands for the studied species. The lengths of the estimated sea-crossing dispersal events were frequently much longer than the distances required to cross the sea barriers where the most striking genetic divergences have been detected, especially for the narrow Messina and Bonifacio straits, just 3 and 5 kilometers long when considering the-50 m isobath (Fig. 3).
Evaluation of climatic and interaction constraints: species distribution
modeling
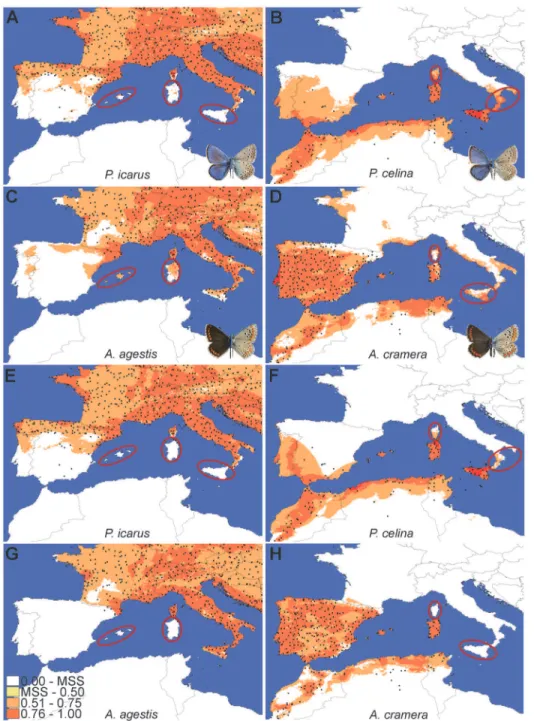
All the climatic models showed a good fit and with very similar results between H and HQP models (AUC for H models:P.icarus= 0.758;P.celina= 0.901;A.agestis= 0.791;A.cramera
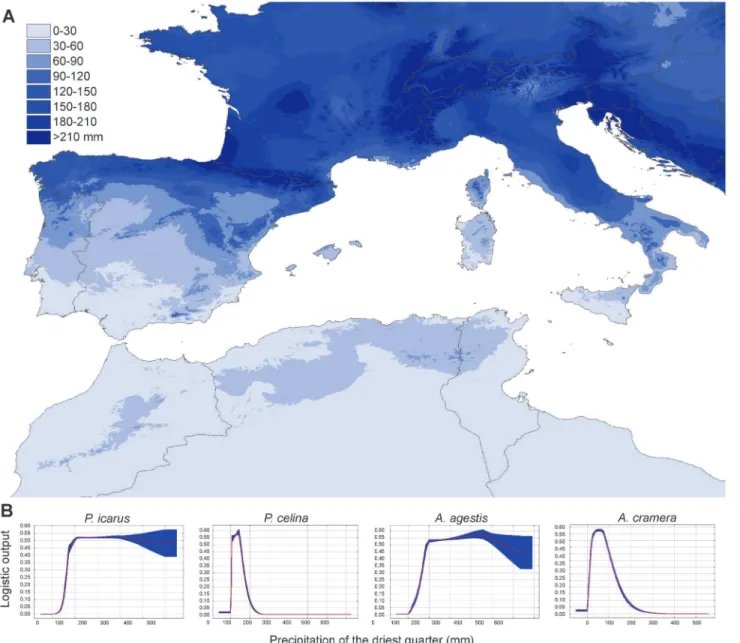
= 0.833; AUC for HQP models:P.icarus= 0.758;P.celina= 0.904;A.agestis= 0.792;A. cra-mera= 0.835;Fig. 4andS5 Fig. for map projections). The climatic variable showing the highest percentage of contribution to the model in both the H and HQP analyses was precipitation of the driest quarter. This variable also showed the highest regularized gain when tested alone in the Jackknife evaluation for all species exceptA.agestis, for which the highest contribution was given by mean temperature diurnal range. By projecting the values of precipitation of the driest quarter on a map and comparing it with the plots representing the response of logistic occur-rences of the four species (Fig. 5), it is clear that values of 50–100 mm of precipitation
compareFig. 2andFig. 4A–DandS5a–d Fig.), thus indicating that climatic constraints cannot entirely explain the chequered distributions of three of the studied species.
The second series of maximum entropy models, in which we included the convex hull repre-senting the presence area of the corresponding cryptic species as a categorical predictive layer, revealed a strong influence of the presence of the peer cryptic species in determining the
Fig 4. Projection over the study area of the logistic values obtained by MaxEnt analyses (H model) for the four species.The color gradient indicates the logistic probabilities of species occurrence, increasing from white (very low probability) to red (very high probability). The maximum value of the lowest class (white) is represented by the maximum training sensitivity plus specificity logistic threshold returned by MaxEnt. The key areas where the species are predicted to occur but are not present despite geographical proximity are highlighted.
observed pattern. The models revealed high AUC values also in this case (AUC for H models:
P.icarus= 0.754;P.celina= 0.902;A.agestis= 0.799;A.cramera= 0.867); AUC for HQP mod-els:P.icarus= 0.755;P.celina= 0.904;A.agestis= 0.805;A.cramera= 0.904). The presence of the related cryptic species was indicated as the variable showing the highest percentage contri-bution to the model for all species exceptP.icarus, for which it is ranked as second after precip-itation of the driest quarter. Conversely, in the Jackknife evaluation of the regularized gain, the presence of the related cryptic species was the most important variable only forA.cramera. In these analyses, logistic predictions for presence/absence along sea straits showed a much higher correspondence with the observed patterns than those obtained only with climatic variables (Fig. 4E–HandS5e–h Fig.).
Fig 5. Projection of the climatic variableprecipitation in the driest quarterand logistic responses for each species. A. The color gradient on the map indicates the precipitations (in mm) over the study area.B. The logistic responses of the precipitation in the driest quarter tested alone for the four studied species (P.icarus,P.celina,A.agestis,A.cramerafrom left to right). The response showed a clear and recurrent threshold between 50 and 100 mm of precipitation.
Discussion
This study shows that the strongest genetic contrasts between the two pairs of cryptic species occur over short distances, which prominently correspond to the Bonifacio and Messina straits. On the basis of the estimated dispersal capabilities, we show that each species are able to cross much longer sea barriers than Bonifacio and Messina. The two pairs of cryptic species revealed strong climatic preferences but these preferences alone could not fully explain the observed dis-tribution pattern. In fact, on the basis of disdis-tribution modeling, both cryptic pairs were ex-pected to coexist at least on one side of these relatively narrow sea straits. Conversely, only one of the two sibling species was documented on each side (Figs.3and4), although dozens of indi-viduals from the potential contact zones were examined (S1 Table). Previous papers suggested potentially chequered distribution patterns for several butterfly taxa in the Mediterranean re-gion [20–22,47,48] and a recent study showed that the cryptic butterfly diversity in this region
is overwhelmingly composed by groups of species that are not sympatric [19]. Since geographic isolation is considered to be the main driver for speciation, the tendency for sister species to show allopatric distributions is to be expected. However, the complete segregation of species and lineages over narrow sea straits that we observed is intriguing. Several hypotheses can be proposed to explain this pattern.
Dispersal capabilities and ecological constraints
A direct comparison of dispersal capabilities against the observed barriers potentially main-taining the vicariance patterns failed to explain the observed distribution. This is not surprising since recent studies have shown that butterflies can experience range expansions/contractions even over relatively short periods of time [20,49–51] and can rapidly adjust their distribution
to track suitable environments [49]. The absence of specific resources, such as host plants, is unlikely to be an explanation for the observed mutual exclusion, because the four studied spe-cies are habitat and trophic generalists, occurring in a wide array of environments, from an-thropic to mountain areas, and feeding on a variety of similar, and even identical, ubiquitous plant resources [52–54]. Since the host plants for the more recently discovered speciesP.celina
were not well documented, we provide a table of our field observations (S2 Table) showing that it feeds on at least four widespread genera of Fabaceae. Species distribution modeling revealed that the two pairs of species experience different climate settings in the areas where they occur and that a common threshold of about 50–100 mm of precipitation in the driest quarter
Competition
Studies focused on birds demonstrated a correlation between differences in functional beak morphology and the rate of secondary sympatry, which suggests that competition instead of sexual interference was the main determinant of chequered distributions [17,18]. However, we specifically selected two pairs of species with high genetic divergence, thus with long potential time for secondary contacts, and a high degree of generalism, which renders competition for resources rather unlikely [10]. The evidence for a highly nested structure in butterfly commu-nities, assembled in an order that reflects well their degree of specialization, provides empirical evidence that generalist butterflies do not tend to exclude each other [57]. Indeed, most of the widespread species of butterflies are habitat generalists that have the tendency to largely co-occur [58]. Thus, the two pairs of species studied here show idiosyncratic distributions beyond the general hypothesis stating that sister species are primarily allopatric and maintained their distribution pattern due to a short dispersal and evolutionary time, but competition for re-sources does not seem to be a suitable alternative explanation either.
Reproductive interference
It should be noted that the observation of strict mutual exclusion among these pairs of species only applies to islands, because on restricted mainland areas these cryptic species are known to display contact zones [21,22] where occasional potential hybrids are found. Accordingly, distri-bution modeling showed that the two pairs experience different climatic conditions but also that suitable areas largely overlap. Presumably, no strong precopulatory barriers exist between these species, as is the case in many butterflies [59,60], but hybrids between closely related spe-cies often display reduced fitness [30,61]. In the absence of precise recognition mechanisms, contact areas can be seen as population sinks, unlikely to enlarge given the cost for the neigh-boring populations [26]. Moreover, hybrid zones are predicted to shift until areas allowing low dispersal and low population densities are reached [26,62]. A concentration of boundaries be-tween cryptic species over sea straits located over areas separating the climatic preferences of the different taxa, highly matches this hypothesis [19]. Thus, we hypothesize that the observed mutual exclusion, at least for the two pairs of cryptic species studied here, could be mainly due to a combination of climatic preference reinforced by reproductive interference between spe-cies [63].
Interestingly, our data onP.celinashow that different lineages coexist in Malta (Sicilian and North African lineages) and Spain (European and Sardo-Corsican lineages), suggesting that multiple successful colonization events over notably long distances can take place, but only when propagules involve the same species as recipient populations (a case in which reproduc-tive interference would not exist). In fact, these observations suggest that the niche carrying ca-pacities in these islands are not saturated and allow the establishment of additional
incoming lineages.
Conclusion
largely sympatric. Our data support productive interference plus climatic preference hypothe-sis over ecological competition, but the mechanisms contributing to the realized distributions may vary depending on the taxonomic group.
Climatic preference and density-dependent processes have been supposed to be key factors in determining the evolution of species, their mutual exclusion on oceanic islands and in gener-ating and maintaining the phylogeographic structures of many species in Europe [21,22,47,48]. Indeed, density-dependent processes, mostly at the leading edge of colonization events, can generate striking geographic contrasts in the distribution of genes and species. We hypothesize that a well-established population of a taxon in a recipient area can strongly interfere with the dispersing individuals belonging to the other cryptic taxon, and thus maintain the geographic patterns established over sea straits by a“founder takes all”mechanism [64]. With increasing
knowledge of cryptic Mediterranean butterflies there is evidence for recurrent separation of dif-ferent species/lineages over the Bonifacio and Messina channels (e.g.Spialia orbifer/sertorius,
Melanargia arge/pherusa[65],Coenonympha pamphilus/lyllus[66],Lysandra coridongroup [67],Pararge aegerialineages [20]). This pattern is reinforced by the observation that among all western Mediterranean butterfly species, cryptic taxa tend to establish contact zones over the same sea straits [19]. Notably, the Messina and Bonifacio straits, but also the area between Iberia and Maghreb, show a similar abrupt change in the quantity of precipitations during the driest quarter. Precipitation is an important factor influencing butterfly survival in the Medi-terranean, since it determines availability of key resources for adults and larvae (water, nectar sources, host plants)[55]. Thus, the phenomenon studied here for two pairs of species may have a prominent impact in determining the overall patterns of butterfly diversity in the region.
The mechanisms here discussed are theoretically applicable to most organisms, and a direct implication of our results is the necessity to consider interactions among cryptic entities when aiming at documenting diversity and its dynamics, including the effects of global changes [49,68,69]. Unfortunately, including the cryptic fraction of biodiversity is not straightforward because its complex recognition requires extensive morphological and/or genetic assessments, and these species are frequently amalgamated in wide-scale surveys [30,49,70].
Supporting Information
S1 Dataset. GPS coordinates for the specimens used in the ecological niche modeling.
(XLSX)
S1 Fig. Delaunay triangulation obtained for the sequenced specimens ofPolyommatusspp. andAriciaspp.
(TIF)
S2 Fig. Neighbour-Joining trees based on COI sequences forPolyommatusspp. and for Ari-ciaspp.
(TIF)
S3 Fig. Minimum dispersal events recorded forAriciaspp.
(TIF)
S4 Fig. Minimum dispersal events recorded forPolyommatusspp.
(TIF)
S5 Fig. Projection over the study area of the logistic values obtained by MaxEnt analyses for the four species, with the HQP models.
S1 Table. List of specimens used in the molecular analysis.
(XLSX)
S2 Table. List of host plant records forPolyommatus celina.
(XLSX)
Acknowledgments
We are grateful to all the people and institutions that provided presence records and/or sam-ples: B. Acosta, Z. Bálint, G. Barech, D. Carreras, J. Dantart, S. Cuvelier, M.Đurić, S. Estradé, B. Fontaine, O. Garcia, J. A. García-Alamá, F. Gil-T., E. García-Barros, F. González, J. Hernán-dez-Roldán, M. A. Ibáñez-Orrico, J. Jubany, M. Khaldi, E. Maravalhas, X. Merit, S. Montagud, M. Munguira, J. Olivares, J. Pérez-López, K. Rebbas, J. Requejo, P. Sammut, J. M. Sesma, F. Slamka, C. Stefanescu, M. R. Tarrier, M. A. Travassos, S. Viader and Juan Carlos Vicente. Special thanks to H. Romo and G. Talavera for their help with the ecological niche
modeling analyses.
Author Contributions
Conceived and designed the experiments: ROV LD. Performed the experiments: RAV VD. An-alyzed the data: ROV RAV LD VD. Contributed reagents/materials/analysis tools: ROV RAV LD VD. Wrote the paper: ROV RAV LD VD.
References
1. Meier ES, Kienast F, Pearman PB, Svenning JC, Thuiller W, et al. (2010) Biotic and abiotic variables show little redundancy in explaining tree species distributions. Ecography 33: 1038–1048.
2. Hutchinson GE (1957) Concluding remarks. Cold Spring Harbor Symposium on Quantitative Biology 22: 415–427.
3. Pianka ER, Huey RB, Lawlor LP (1979) Niche segregation in desert lizards. In: Horn DJ, Stairs GR, Mitchell RD, editors. Analysis of Ecological Systems Columbus: Ohio State Univ. Press. pp. 67–116 4. Soberon J (2007) Grinnellian and Eltonian niches and geographic distributions of species. Ecology
Let-ters 10: 1115–1123. PMID:17850335
5. Hijmans RJ, Cameron SE, Parra JL, Jones PG, Jarvis A (2005) Very high resolution interpolated cli-mate surfaces for global land areas. International Journal of Climatology 25: 1965–1978.
6. Phillips SJ, Anderson RP, Schapire RE (2006) Maximum entropy modeling of species geographic distri-butions. Ecological Modelling 190: 231–259.
7. Thuiller W (2003) BIOMOD—optimizing predictions of species distributions and projecting potential fu-ture shifts under global change. Global Change Biology 9: 1353–1362.
8. Guisan A, Thuiller W (2005) Predicting species distribution: offering more than simple habitat models. Ecology Letters 8: 993–1009.
9. Wisz MS, Pottier J, Kissling WD, Pellissier L, Lenoir J, et al. (2013) The role of biotic interactions in shaping distributions and realised assemblages of species: implications for species distribution model-ling. Biological Reviews 88: 15–30. doi:10.1111/j.1469-185X.2012.00235.xPMID:22686347
10. Friberg M, Leimar O, Wiklund C (2013) Heterospecific courtship, minority effects and niche separation between cryptic butterfly species. J Evol Biol 26: 971–979. doi:10.1111/jeb.12106PMID:23480828
11. Ord TJ, King L, Young AR (2011) Contrasting Theory with the Empirical Data of Species Recognition. Evolution 65: 2572–2591. doi:10.1111/j.1558-5646.2011.01319.xPMID:21884057
12. Kishi S, Nishida T, Tsubaki Y (2009) Reproductive interference determines persistence and exclusion in species interactions. Journal of Animal Ecology 78: 1043–1049. doi:10.1111/j.1365-2656.2009. 01560.xPMID:19457018
13. Zhou ZS, Chen ZP, Xu ZF (2010) Niches and interspecific competitive relationships of the parasitoids,
14. Wardle DA, Barker GM, Bonner KI, Nicholson KS (1998) Can comparative approaches based on plant ecophysiological traits predict the nature of biotic interactions and individual plant species effects in ecosystems? Journal of Ecology 86: 405–420.
15. Keddy PA (1992) A Pragmatic Approach to Functional Ecology. Functional Ecology 6: 621–626. 16. Heikkinen RK, Luoto M, Virkkala R, Pearson RG, Korber JH (2007) Biotic interactions improve
predic-tion of boreal bird distribupredic-tions at macro-scales. Global Ecology and Biogeography 16: 754–763. 17. Pigot AL, Tobias JA (2013) Species interactions constrain geographic range expansion over
evolution-ary time. Ecology Letters 16: 330–338. doi:10.1111/ele.12043PMID:23231353
18. Tobias JA, Cornwallis CK, Derryberry EP, Claramunt S, Brumfield RT, et al. (2013) Species coexis-tence and the dynamics of phenotypic evolution in adaptive radiation. Nature 506: 359–363. doi:10. 1038/nature12874PMID:24362572
19. VodăR, Dapporto L, DincăV, Vila R (in press) Cryptic matters: Overlooked buttery beta-diversity. Eco-graphy. DOI:10.1111/ecog.00762. PMID:25076812
20. Dapporto L, Bruschini C, DincăV, Vila R, Dennis RLH (2012) Identifying zones of phenetic compres-sion in West Mediterranean butterflies (Satyrinae): refugia, invacompres-sion and hybridization. Diversity and Distributions 18: 1066–1076.
21. DincăV, Dapporto L, Vila R (2011) A combined genetic-morphometric analysis unravels the complex biogeographical history ofPolyommatus icarusandPolyommatus celinaCommon Blue butterflies. Mo-lecular Ecology 20: 3921–3935. doi:10.1111/j.1365-294X.2011.05223.xPMID:21883579
22. Sañudo-Restrepo CP, DincăV, Talavera G, Vila R (2013) Biogeography and systematics ofAricia but-terflies (Lepidoptera, Lycaenidae). Molecular Phylogenetics and Evolution 66: 369–379. doi:10.1016/j. ympev.2012.10.010PMID:23099146
23. DincăV, Wiklund C, Lukhtanov VA, Kodandaramaiah U, Noren K, et al. (2013) Reproductive isolation and patterns of genetic differentiation in a cryptic butterfly species complex. J Evol Biol 26: 2095–2106. doi:10.1111/jeb.12211PMID:23909947
24. McBride CS, van Velzen R, Larsen TB (2009) Allopatric origin of cryptic butterfly species that were dis-covered feeding on distinct host plants in sympatry. Molecular Ecology 18: 3639–3651. doi:10.1111/j. 1365-294X.2009.04309.xPMID:19674305
25. Dapporto L (2010) Speciation in Mediterranean refugia and post-glacial expansion ofZerynthia poly-xena(Lepidoptera, Papilionidae). Journal of Zoological Systematics and Evolutionary Research 48: 229–237.
26. Dasmahapatra KK, Lamas G, Simpson F, Mallet J (2010) The anatomy of a‘suture zone’in Amazonian butterflies: a coalescent-based test for vicariant geographic divergence and speciation. Molecular Ecol-ogy 19: 4283–4301. doi:10.1111/j.1365-294X.2010.04802.xPMID:20819158
27. Porter AH (2009) Ecological genetics and gvolutionary ecology in hybrid zones. In: Settele J, Shreeve TG, Konvicka M, Van Dyck H, editors. Ecology of Butterflies in Europe. Cambridge: Cambridge Uni-versity Press. pp. 296–312.
28. Wiemers M, Stradomsky BV, Vodolazhsky DI (2010) A molecular phylogeny ofPolyommatuss. str. andPlebiculabased on mitochondrial COI and nuclear ITS2 sequences (Lepidoptera: Lycaenidae). Eu-ropean Journal of Entomology 107: 325–336.
29. FaunaEuropea (2013)http://wwwfaunaeurorg/.
30. Descimon H, Mallet J (2009) Bad species. In: Settele J, Shreeve TG, Konvicka M, Van Dyck H, editors. Ecology of Butterflies in Europe. Cambridge: Cambridge University Press. pp. 219–249.
31. Dapporto L, Dennis RLH (2013) The generalist-specialist continuum: Testing predictions for distribution and trends in British butterflies. Biological Conservation 157: 229–236.
32. Hebert PDN, Penton EH, Burns JM, Janzen DH, Hallwachs W (2004) Ten species in one: DNA barcod-ing reveals cryptic species in the neotropical skipper butterflyAstraptes fulgerator. Proceedings of the National Academy of Sciences of the United States of America 101: 14812–14817. PMID:15465915
33. Ivanova NV, Dewaard JR, Hebert PDN (2006) An inexpensive, automation-friendly protocol for recover-ing high-quality DNA. Molecular Ecology Notes 6: 998–1002.
34. deWaard JR, Ivanova NV, Hajibabaei M, Hebert PDN (2008) Assembling DNA barcodes: analytical protocols. In: Martin C, editor. Methods in molecular biology: environmental genetics. Totowa, NJ: Humana Press. pp. 275–293.
35. Tamura K, Dudley J, Nei M, Kumar S (2007) MEGA4: Molecular evolutionary genetics analysis (MEGA) software version 4.0. Molecular Biology and Evolution 24: 1596–1599. PMID:17488738
37. Keis M, Remm J, Ho SYW, Davison J, Tammeleht E, et al. (2013) Complete mitochondrial genomes and a novel spatial genetic method reveal cryptic phylogeographical structure and migration patterns among brown bears in north-western Eurasia. Journal of Biogeography 40: 915–927.
38. Ramachandran S, Deshpande O, Roseman CC, Rosenberg NA, Feldman MW, et al. (2005) Support from the relationship of genetic and geographic distance in human populations for a serial founder ef-fect originating in Africa. Proceedings of the National Academy of Sciences of the United States of America 102: 15942–15947. PMID:16243969
39. Vandergast AG, Perry WM, Lugo RV, Hathaway SA (2011) Genetic landscapes GIS Toolbox: tools to map patterns of genetic divergence and diversity. Molecular Ecology Resources 11: 158–161. doi:10. 1111/j.1755-0998.2010.02904.xPMID:21429115
40. Harrell FE (2001) Regression modeling strategies: with applications to linear models, logistic regres-sion, and survival analysis. New York: Springer. xxii, 568 p. p.
41. Blach-Overgaard A, Svenning JC, Dransfield J, Greve M, Balslev H (2010) Determinants of palm spe-cies distributions across Africa: the relative roles of climate, non-climatic environmental factors, and spatial constraints. Ecography 33: 380–391.
42. Santos H, Juste J, Ibanez C, Palmeirim JM, Godinho R, et al. (2014) Influences of ecology and biogeog-raphy on shaping the distributions of cryptic species: three bat tales in Iberia. Biological Journal of the Linnean Society 112: 150–162.
43. Merow C, Smith MJ, Silander JA (2013) A practical guide to MaxEnt for modeling species’distributions: what it does, and why inputs and settings matter. Ecography 36: 1058–1069.
44. Elith J, Phillips SJ, Hastie T, Dudík M, Chee YE, et al. (2011) A statistical explanation of MaxEnt for ecologists. Diversity and Distributions 17: 43–57.
45. Liu CR, White M, Newell G (2013) Selecting thresholds for the prediction of species occurrence with presence-only data. Journal of Biogeography 40: 778–789.
46. Sammut P (1984) A systematic and synonymic list of the Lepidoptera of the Maltese Islands. Neue Entomologische Nachrichten 13: 1–124.
47. DincăV, Lukhtanov VA, Talavera G, Vila R (2011) Unexpected layers of cryptic diversity in wood white Leptideabutterflies. Nature Communications 2: 324. doi:10.1038/ncomms1329PMID:21610727
48. Nazari V, Ten Hagen W, Bozano GC (2010) Molecular systematics and phylogeny of the‘Marbled Whites’(Lepidoptera: Nymphalidae, Satyrinae,MelanargiaMeigen). Systematic Entomology 35: 132–147.
49. Devictor V, van Swaay C, Brereton T, Brotons L, Chamberlain D, et al. (2012) Differences in the climatic debts of birds and butterflies at a continental scale. Nature Climate Change 2: 121–124.
50. Dapporto L, Bruschini C (2012) Invading a refugium: post glacial replacement of the ancestral lineage of a Nymphalid butterfly in the West Mediterranean. Organisms Diversity & Evolution 12: 39–49. doi:
10.1016/j.ijfoodmicro.2015.01.008PMID:25626150
51. Habel JC, Lens L, Rodder D, Schmitt T (2011) From Africa to Europe and back: refugia and range shifts cause high genetic differentiation in the Marbled White butterflyMelanargia galathea. Bmc Evolutionary Biology 11: 215. doi:10.1186/1471-2148-11-215PMID:21777453
52. Tennent J (1996) The Butterflies of Morocco, Algeria and Tunisia. Wallingford: Gem Publishing Company.
53. Tarrier MR, Delacre J (2008) Les Papillons de jour du Moroc. Mèze: Biotope.
54. Dennis RLH (2010) A resource-based habitat view for conservation: butterflies in the British landscape. Chichester, UK; Hoboken, NJ: Wiley-Blackwell. xii, 406 p. p.
55. Grill A, Cerny A, Fiedler K (2013) Hot summers, long life: egg laying strategies of Maniola butterflies are affected by geographic provenance rather than adult diet. Contributions to Zoology 82: 27–36. 56. Toews DPL, Mandic M, Richards JG, Irwin DE (2014) Migration, Mitochondria, and the Yellow-Rumped
Warbler. Evolution 68: 241–255. doi:10.1111/evo.12260PMID:24102562
57. Ulrich W, Gotelli NJ (2007) Disentangling community patterns of nestedness and species co-occur-rence. Oikos 116: 2053–2061.
58. Dennis RLH, Hardy PB, Dapporto L (2012) Nestedness in island faunas: novel insights into island bio-geography through butterfly community profiles of colonization ability and migration capacity. Journal of Biogeography 39: 1412–1426.
59. Friberg M, Vongvanich N, Borg-Karlson AK, Kemp DJ, Merilaita S, et al. (2008) Female mate choice de-termines reproductive isolation between sympatric butterflies. Behavioral Ecology and Sociobiology 62: 873–886.
61. Biermann H, Eitschberger U (1996) Bemerkungen zuLasiommata megera(Linnaeus, 1767) und
Lasiommata paramegaera(Hübner, [1824]) (Lepidoptera Saryridae). Atalanta 27: 253–319.
62. Mallet J (2010) Shift happens! Shifting balance and the evolution of diversity in warning colour and mim-icry. Ecological Entomology 35: 90–104.
63. Groning J, Hochkirch A (2008) Reproductive interference between animal species. Quarterly Review of Biology 83: 257–282. PMID:18792662
64. Waters JM, Fraser CI, Hewitt GM (2013) Founder takes all: density-dependent processes structure biodversity. Trends in Ecology & Evolution 28: 78–85. doi:10.1016/j.cub.2014.11.067PMID:
25619764
65. Kudrna O, Harpke A, Lux K, Pennerstorfer J, Schweiger O, et al. (2011) Distribution atlas of butterflies in Europe. Halle: Gesellschaft fuer Schmetterlingsschutz e.V. 1–576 p.
66. Boillat H (2002)Coenonympha lyllusEsper, 1805, spec. rev. Une nouvelle approche taxinomique du complexepamphilus. Alexanor 22: 243–309.
67. Talavera G, Lukhtanov VA, Rieppel L, Pierce NE, Vila R (2013) In the shadow of phylogenetic uncer-tainty: The recent diversification ofLysandrabutterflies through chromosomal change. Molecular Phylo-genetics and Evolution 69: 469–478. doi:10.1016/j.ympev.2013.08.004PMID:23954756
68. Hill JK, Thomas CD, Fox R, Telfer MG, Willis SG, et al. (2002) Responses of butterflies to twentieth cen-tury climate warming: implications for future ranges. Proceedings of the Royal Society B-Biological Sci-ences 269: 2163–2171. PMID:12396492
69. Parmesan C, Ryrholm N, Stefanescu C, Hill JK, Thomas CD, et al. (1999) Poleward shifts in geographi-cal ranges of butterfly species associated with regional warming. Nature 399: 579–583.