between Populations of the Endangered Mexican
Sheartail Hummingbird (
Doricha eliza
)
Yuyini Licona-Vera, Juan Francisco Ornelas*
Departamento de Biologı´a Evolutiva, Instituto de Ecologı´a, AC, Xalapa, Veracruz, Mexico
Abstract
The Mexican Sheartail (Doricha eliza), an endangered hummingbird, is endemic to Mexico where two populations have a disjunct distribution. One population is distributed along the northern tip of the Yucatan Peninsula whereas the other is mostly restricted to central Veracruz. Despite their disjunct distribution, previous work has failed to detect morphological or behavioral differences between these populations. Here we use variation in morphology, mtDNA and nuDNA sequences to determine the degree of morphological and molecular divergence between populations, their divergence time, and historical demography. We use species distribution modeling and niche divergence tests to infer the relative roles of vicariance and dispersal in driving divergence in the genus. Our Bayesian and maximum likelihood phylogenetic analyses revealed thatDoricha elizapopulations form a monophyletic clade and support their sister relationship withD. enicura. We found marked genetic differentiation, with reciprocal monophyly of haplotypes and highly restricted gene flow, supporting a history of isolation over the last 120,000 years. Genetic divergence between populations is consistent with the lack of overlap in environmental space and slight morphological differences between males. Our findings indicate that the divergence of the Veracruz and Yucatan populations is best explained by a combination of a short period of isolation exacerbated by subsequent divergence in climate conditions, and that rather than vicariance, the two isolated ranges ofD. elizaare the product of recent colonization and divergence in isolation.
Citation:Licona-Vera Y, Ornelas JF (2014) Genetic, Ecological and Morphological Divergence between Populations of the Endangered Mexican Sheartail Hummingbird (Doricha eliza). PLoS ONE 9(7): e101870. doi:10.1371/journal.pone.0101870
Editor:Joa˜o Pinto, Instituto de Higiene e Medicina Tropical, Portugal
ReceivedFebruary 10, 2014;AcceptedJune 12, 2014;PublishedJuly 3, 2014
Copyright:ß2014 Licona-Vera, Ornelas. This is an open-access article distributed under the terms of the Creative Commons Attribution License, which permits unrestricted use, distribution, and reproduction in any medium, provided the original author and source are credited.
Funding:This project was funded by competitive grants (grant numbers 61710 and 155686) from Consejo Nacional de Ciencia y Tecnologı´a (CONACyT, http:// www.conacyt.mx) and research funds from INECOL (20030/10563) awarded to Juan Francisco Ornelas. Yuyini Licona-Vera was supported by a Master of Science scholarship (no. 262561). The funders had no role in study design, data collection and analysis, decision to publish, or preparation of the manuscript.
Competing Interests:The authors have declared that no competing interests exist.
* Email: francisco.ornelas@inecol.mx
Introduction
The Mexican Sheartail Hummingbird (Doricha eliza) is an endemic to Mexico, and globally is a near threatened species according to the IUCN Red List [1]. It is locally endangered with population declines owing to habitat loss and degradation [2], and is thus facing risk of extinction in the wild. These hummingbirds of the monophyletic assemblage Mellisugini [3], known as bees, and were originally included in the genusTrochilus[4]. They have since moved into different genera (Calliphlox, Calothorax, Myrtis, Thau-mastura, Rhodopis, andDoricha; [4–5]). Although the recent use of mitochondrial DNA sequences placed D. elizain the bees group [6], additional taxa likely to be nested within the Mellisugini monophyletic assemblage, including the putative sister species, the Slender Sheartail (D. enicura), and multiple loci are needed to fully resolve the phylogenetic position of the Mexican Sheartail within the Mellisugini [6–7].
Sheartails are small hummingbirds with long, arched bills and are common in semi-open scrubby areas [8]. Males with glittering, rose-pink gorgets display rocking pendulum flights (shuttle displays) to females, along with high climbs and steep dives (Figure S1 and Video S1; personal observation, [8–11]). The breeding range of the Mexican Sheartail is divided into two widely separated geographical areas, one in central Veracruz and the
differences in the habitats occupied, there are no apparent morphological or behavioral differences [13]. However, geograph-ic distance as a driver of the divergence between the two populations of Mexican Sheartail in isolation, has not been investigated. This question is particularly important because each population is facing different threats and in a different environ-ment, requiring locally adapted conservation schemes.
In this study, we ask the following questions: (1) what is the phylogenetic position of Doricha eliza within the monophyletic assemblage of Mellisugini? (2) What is the level of genetic differentiation between the Veracruz and Yucatan populations? (3) Are disjunct populations currently connected by gene flow? (4) When did the Veracruz and Yucatan populations split? And (5) was the divergence between the two disjunct populations caused by vicariance or dispersal? To answer these questions, we conducted Bayesian and maximum likelihood phylogenetic analyses of mitochondrial and nuclear DNA markers and time estimates of intraspecific genetic divergence. We also used morphological data, genetic diversity and historical demographic indices, modeling ancestral distribution, and use of niche divergence tests to infer the history of the Veracruz and Yucatan populations and the relative roles of dispersal and vicariance in driving divergence in the genus.
Materials and Methods
Ethics Statement
We obtained the collecting permit to conduct this work from Mexico’s Secretarı´a de Medio Ambiente y Recursos Naturales, Instituto Nacional de Ecologı´a, Direccio´n General de Vida Silvestre (permit number: INE SGPA/DGVS/07701/11) for the field study described. This collecting permit specifically allowed for the collection of tail feathers from the birds. Manipulation of birds in the field was minimal. Birds were captured with mist nets, measured, and their two outermost tail feathers were removed for genetic analyses before the birds were released. All procedures with birds were carried out in accordance with the Guidelines for the Use of Wild Birds in Research proposed by the North American Ornithological Council and the ethics of experimental procedures were revised and authorized by the Animal Care and Use Committee under the Graduate Studies Committee (Maestrı´a en Biodiversidad y Sistema´tica; No. INECOL/SP/CAP/2012/ 103) of the Instituto de Ecologı´a, A.C. (INECOL). While the field studies involve an endangered and protected species, no specific permits are required for field studies such as the one described here.
Sample Collection
Feather samples were collected from a total of 25D. elizaduring the 2011 and 2012 breeding seasons. Ten hummingbirds were collected in central Veracruz at the following locations: Xalapa, El Lencero, Miradores and Chavarrillo. Feather samples were collected from 15 individuals of the Yucatan population at Rio
Lagartos and Chicxulub (Table S1). We sequenced the
mitochondrial nicotinamide adenine dinucleotide dehydrogenase subunit 2 gene (ND2) and the complete ATP synthase 6 and ATP synthase 8 coding region (ATPase), and the nuclear 20454 locus from tail feathers of 25 D. eliza, and sequenced or downloaded sequence data from GenBank for the sister speciesD. enicuraand for the outgroups, the bee hummingbirds Calothorax lucifer, C. pulcher,Selasphorus rufus,S. sasin,S. platycercus,S. calliope,Atthis heloisa, Archilochus colubrisand Tilmatura dupontii, and the emeraldAmazilia cyanocephala (Table S2). We also obtained ND2 sequences from GenBank for an additional 17 species of the bee hummingbird
group (Archilochus alexandri, Calliphlox amethystina, C. bryantae, C. mitchellii, Calypte anna, C. costae, Chaetocercus bombus, Ch. mulsant, Doricha enicura,Eulidia yarrellii,Microstilbon burmeisteri,Myrmia micrura, Myrtis fanny, Rhodopis vesper, Selasphorus flammula and Thaumastura cora), 11 representative taxa of the mountain gems group and 12 species of the emeralds group to be used for sequence alignment and as outgroups (Table S2).
DNA Isolation, Amplification and Sequencing Protocols Total genomic DNA was extracted using the Qiagen DNeasy blood and tissue extraction kit (Qiagen, Inc., Valencia, CA, USA), following the manufacturer’s protocol. Using polymerase chain reaction (PCR), we amplified fragments from three mitochondrial DNA (mtDNA) coding genes: ND2 (350 bp, primers pair L5216 and H5578 [16]); ATPase 6–8 (727 bp, primer pair L8929 and H9947 [17]); and 20454 (502 bp, primer pair 20454F and 20454R [18]). PCR reactions (20mL total volume) for genes contained 0.726buffer, 0.58 Mm of each dNTP, 0.4mg/mL BSA, 0.04 U
Taqpolymerase (Promega, Madison, WI, USA), 4.0 mM MgCl2,
and 0.29mM of each primer. PCR reactions were performed in a 2720 thermal cycler (Applied Biosystems, Carlsbad, CA, USA) or in an Eppendorf Mastercycler thermal cycler (Eppendorf AG, Hamburg, Germany). For amplification of the ND2, cycling parameters consisted of initial denaturation at 94uC for 3 min, followed by 40 cycles at 94uC for 45 sec, annealing at 47–48uC for 45 sec, 72uC for 30 sec, and a final step at 72uC for 5 min. The protocol for amplifying ATPase 68 was an initial denaturation at 95uC for 2 min, followed by 40 cycles at 92uC for 40 sec, annealing at 47–50uC for 1 min, 73uC for 2 min, and a final step at 73uC for 3 min. Amplification of the 20454 locus included initial denaturation at 94uC for 1.30 min, followed by 40 cycles at 94uC for 30 sec, annealing at 50–52uC for 30 sec, 72uC for 45 sec, and a final step at 72uC for 10 min. PCR products were purified with QIAquick (Qiagen Inc.) and sequenced in both directions to check the validity of sequence data using the Big Dye Terminator Cycle Sequencing kit (Applied Biosystems). The products were read on a 310 automated DNA sequencer (Applied Biosystems) at the INECOL’s sequencing facility. Finally, sequences were assembled using Sequencher v4.9 (Gene Codes Corp., Ann Arbor, MI, USA) and then manually aligned using SE-AL v2.0a11 (http://tree.bio.ed.ac.uk/software/seal). All sequences are depos-ited under the following GenBank accession numbers: KJ710519– KJ710624 (Table S2).
Individual haplotypes from 20454 sequences were statistically inferred using PHASE v2.1 [19–20] with the following parame-ters: 100,000 iterations, a thinning interval of 10, and a burn-in of 1000. PHASE uses a Bayesian statistical method to determine the most probable pair of alleles or haplotypes. Heterozygous sites in nuclear sequences were identified when two different nucleotides were present at the same position in the electropherograms of both strands. Three runs were conducted to check the consistency of results obtained by examining the allele frequencies and coalescent goodness-of-fit measures estimated for each run, and only highly supported haplotype pairs (probability 0.70–0.90) were main-tained.
Phylogenetic Analyses of mtDNA and nuDNA
American and South American members of the Mellisugini clade [7] retrieved from GenBank. The second set of analyses was run with the combined mtDNA data set (ND2 and ATPase) forD. eliza and outgroups, and the third with the nuclear 20454 locus data set. All DNA markers used and their accession numbers are listed inTable S2. We used jModeltest v1.1 [24] to choose the model of molecular evolution that best fit our sequence data under the
Akaike information criterion (AIC; [25]), GTR+I+G (base
frequencies: A = 0.3401, C = 0.3710, G = 0. 0760, T = 0.2183; gamma distribution shape parameter = 1.1860) for ND2; GTR+I
(base frequencies: A = 0.2304, C = 0.0958, G = 0.3565,
T = 0.3173) for ND2+ATPase; and HKY+G (base frequencies:
A = 0.2480, C = 0.2034, G = 0.2310, T = 0.3177; gamma distri-bution shape parameter = 0.0170) for the nuclear 20454 locus. For each data set, two parallel Markov chain Monte Carlo (MCMC) analyses were executed simultaneously, and each was run for 10 million generations, sampling every 1000 generations. A majority consensus tree was obtained (50% majority-rule), showing nodes with a posterior probability (PP) of 0.6 or more. Bayesian PP values were calculated from the sampled trees remaining after 10% burn-in samples were discarded [21] to only include trees after stationarity/convergence was reached as checked in Tracer
v1.5 [31]. Nodes with PP$95 were considered to be strongly
supported [26]. The consensus tree was later visualized in FigTree v1.2.3 (http://tree.bio.ed.ac.uk/software/figtree/). The BI analy-ses included two additional sets of analyanaly-ses using the combined data set (ND2+ATPase+20454): the first used a single model for the entire combined loci data set (the ‘unpartitioned’ analyses), and the second set employed partition-specific DNA evolution models of each gene. For each data set, two parallel Markov chain Monte Carlo (MCMC) analyses were executed simultaneously, and each was run for 50 million generations, sampling every 1000 generations. We computed Bayes factors with the harmonic means [27] to determine whether applying partition-specific models significantly improved the explanation of the data.
ML analyses were performed using default values and the same evolution models as in the Bayesian analyses. Node support for the ML tree was estimated with 1000 bootstrap replicates, and nodes were considered highly supported when bootstrap values were$
70% [28].
Species Tree and Divergence Time Estimation
To estimate relationships between populations of D. eliza, we used ND2, ATPase and 20454 sequences for allD. elizasamples under the multispecies coalescent method of *BEAST [29–30] implemented in BEAST v1.7.4 [31]. This method models the lineage sorting process between units for groups of individuals not connected by gene flow above, at, or below the species level to obtain a species tree [32].Doricha enicura,Calothorax luciferandC. pulcher were the outgroups. We employed a relaxed molecular clock model with branch rates drawn independently from a lognormal distribution and the Yule process as a tree prior under a continuous population size model. The models of molecular evolution that best fit our sequence data under the Akaike information criterion (AIC; [25]) were HKY (base frequencies: A = 0.2247, C = 0.1467, G = 0.3356, T = 0.2930) for ND2; HKY+
G (base frequencies: A = 0.2325, C = 0.1003, G = 0.3430,
T = 0.3242; gamma distribution shape parameter = 0.0160) for ATPase; and HKY+G (base frequencies: A = 0.2447, C = 0.1990, G = 0.2310, T = 0.3254; gamma distribution shape parame-ter = 0.0160) for the nuclear 20454 locus. We performed three independent runs of 10 million generations each, sampling every 1000 generations, and discarding the first 1 million generations of every replicate as burn-in. Replicate results were combined in
LogCombiner v1.7.4 (http://beast.bio.ed.ac.uk/LogCombiner) and the convergence of runs was confirmed by effective sample sizes (ESS).200 for all parameters and by visual inspection of traces within and between replicates using Tracer v1.5 [31]. The resulting posterior sample of trees was summarized in a Maximum Clade Credibility (MCC) tree using TreeAnnotator v1.7.4 (http:// beast.bio.ed.ac.uk/TreeAnnotator). Nucleotide substitution mod-els selected with jModeltest v1.1 [24] were incorporated, and we used a relaxed clock model with an uncorrelated lognormal distribution. To calibrate the tree we used the mean rates of 2.9610–2 substitutions/site/lineage/million years (s/s/l/My) for ND2, 2.2610–2s/s/l/My for ATPase, and 1610–3s/s/l/My for
20454 based on rates obtained for Hawaiian honeycreepers [33]. We prefer the rates suggested by Lerner et al. [33] because these are likely more appropriate for the lower taxonomic level of Dorichaspecies [34–35] than the low substitution rates obtained for major bird orders [36].
BEAST v1.7.4 [31] was used to estimate the time of the most
recent common ancestor (TMRCA) of clades inD. eliza. We ran
two individual analyses to estimate TMRCA, one with all the ND2 sequences of bee hummingbirds available from previous studies [6–7,37–38] and retrieved from GenBank, and the second with the mtDNA sequences (ND2 and ATPase) generated in our study for D. eliza and the other hummingbird species listed above. All sequences used and those retrieved from GenBank are listed with
their accession numbers in Table S2. The best-fit model of
evolution, GTR+I+G for the ND2 and GTR+I for the ND2+
ATPase data set, was estimated from the data sets using jModeltest and an uncorrelated lognormal relaxed model selected in BEAST as the clock model. A coalescent model assuming constant population size was used to model the tree prior. The coalescent tree prior used in these analyses appears to fit better when mixed data sets are predominantly intraspecific data [39]. To calibrate the root in both analyses, we used the divergence time between the bee and emerald hummingbird groups (normal prior, mean 13.97 Ma, SD 3.0; [6]) as a secondary calibration. To calibrate the tree, we used the average divergence time for the basal split between North and South American bee hummingbirds (normal prior, mean 6.1, SD 1.0, range of 7.74-4.45 Ma; [40]). Twenty-seven species from the bee hummingbird group, and representatives of the mountain gems (11 taxa) and emeralds (13 taxa) were included as outgroups in the analysis using the ND2 data set, and a fewer outgroups were used in the analysis using the ND2+ATPase data set separately (see Sample Collection; Table S2). All of the samples ofD. elizawere used in both analyses, rather than just the unique haplotypes, to avoid overestimating evolutionary time scales [41]. For each of the analyses, we performed three independent runs of 10 million generations, sampling every 1000 steps, and discarding the first 10% of trees as burn-in. We combined the log and trees files from each independent run using LogCombiner, then viewed the combined log file in Tracer to ensure that ESS values for all priors and the posterior distribution
were.200, and then annotated the trees using TreeAnnotator
summarized as a maximum clade credibility tree with mean divergence times and 95% highest posterior density (HPD) intervals of age estimates, visualized in FigTree.
Genetic Structure and Genetic Diversity
variance (AMOVA [43]). The AMOVA was run grouping individuals into two groups according to the observed divergence in the BI analysis (see Results), and using the Jukes and Cantor model, and 16,000 permutations to determine the significance of the AMOVA using Arlequin v3.1 [44]. Lastly, we calculated corrected genetic distances [45] for mtDNA data sets between populations of D. eliza and other species within the Mellisugini clade (D. enicura,Calothorax pulcher,C. lucifer) using DnaSP v5.1 [46], and assessed genetic variation within populations by calculating the haplotype diversity (Hd) and nucleotide diversity (p) using Arlequin [44].
Historical Demography
The demographic histories of the Veracruz and Yucatan populations ofD. eliza were inferred by means of neutrality tests and mismatch distributions carried out in Arlequin v3.1 [44]. Tajima’sD[47] and Fu’sFs[48] were calculated to test whether populations evolved under neutrality, and mismatch distributions [49] were calculated using the sudden expansion model [50] with 1000 bootstrap replicates. The validity of the sudden expansion assumption was determined using the sum of squares differences (SSD), which is higher in stable, nonexpanding populations [51]. To validate the estimated demographic and geographic expansion tests 16,000 permutations were used in Arlequin. We also used Bayesian skyline plots (BSP; [52]) to assess changes in effective population size (Ne) over time in BEAST. This analysis was performed for each genetic group separately and for the two groups combined (concatenated). Concatenated analysis has been proposed to satisfy the assumption of lineages interbreeding in scenarios where divergence is recent and there is low genetic structure [53]. The time axis was scaled using the mean rates of 2.9610–2 substitutions/site/lineage/million years (s/s/l/My) for
ND2 and 2.2610–2s/s/l/My for ATPase based on rates for
Hawaiian honeycreepers [33].
We used the ‘isolation-with-migration’ coalescent model as implemented in the program IMa [54–55] to estimate the time of divergence (t) between the Veracruz and Yucatan populations of D. eliza, the effective number of migrants per generation (mV to Y andmY to V), and the effective population size of the ancestral (qA) and descendant populations (qVandqY). We used mitochondrial and nuclear phased haplotypes to produce maximum-likelihood estimates and confidence intervals for splitting times, effective population sizes, and gene flow [55]. Every locus was tested for evidence of recombination using IMgc [56]. This program removes either sites or haplotypes to obtain the longest region to pass the four-gamete test [57]. Three independent runs of 25 million generations were performed under Hasegawa-Kishino-Yano (HKY) model for mitochondrial loci and the Infinite Sites (IS) model for nuclear locus. Each run used identical conditions, but different starting seed values, and a burn-in period of 3 million steps with parameter values empirically determined in the preliminary runs to verify the convergence of independent analyses. To improve the mixing of the Markov chains (to facilitate convergence), we ran multiple heated chains and kept monitoring the autocorrelation and estimates of ESS [55]. Using estimated ESS values in IMa [55], we considered stationarity to have been reached when the ESS value for each independent run was.50. The rates of 2.9610–2substitutions/site/lineage/million years (s/s/l/My) for ND2, 2.2610–2s/s/l/My for ATPase and
1610–3s/s/l/My for 20454 obtained for Hawaiian honeycreepers
[33] were provided in the IMa input file and the mean rates for all genes were used to estimate the effective population sizes of each genetic group. We used a 2.5 year generation time assuming that the sexual maturity of Mexican Sheartail begins approximately 2
years after hatching and assuming an annual survivorship of 0.35, as estimated for other bee hummingbirds [58–59], to convert the effective population size estimates. Migration rates per generation were converted to population migration rates per generation using estimates of the effective population size. The approximate average generation time (T) is calculated according to T =a+[s/ (1–s)] [60–61], whereais the time to maturity andsis the adult annual survival rate. Based on this, the estimate for T was 3.04 years. To convert the time since divergence parameter of IMa to years,t, we divided the time parameter (B) by the mutation rate per year (U) converted to per locus rate by multiplying by the fragment length in base pairs, and calculated for the rates described above.
Species Distribution Models
We constructed a species distribution model (SDM [62]) to predict where populations of D. eliza resided during the Last Glacial Maximum (LGM, 21,000-18,000 years ago) and Last Interglacial (LIG, 120,000–140,000 years ago). We assembled a data set of 121 unique records (51 for Veracruz and 76 for the Yucatan) from georeferenced museum (Atlas Aves de Me´xico, [63]) specimens obtained through http://vertnet.org and the Global Biodiversity Information Facility (GBIF, http://data.gbif. org/species/browse/taxon), and analyzed the data with the maximum entropy algorithm in MaxEnt [64–65]. Present climate layers (temperature and precipitation variables, BIO1–BIO19) were drawn from the WorldClim database (c. 1 km2; [66]). Using ArcView v3.2 (ESRI, Redlands, CA, USA), we first extracted GIS data from the 19 WorldClim layers atD. eliza’s occurrence points, and then ran a correlation analysis to eliminate correlated environmental variables using the program PAST v2.12 [67]. When the correlation coefficient was higher than 0.80 the variables were considered highly correlated, and for each pair of correlated variables we selected the one that was more temporally inclusive. After removing the highly correlated variables, six variables were used in the analysis (BIO1 [Annual Mean Temperature], BIO2 [Mean Diurnal Range], BIO3 [Isotherm-ality], BIO4 [Temperature Season[Isotherm-ality], BIO12 [Annual Precip-itation], and BIO14 [Precipitation of Driest Month]). MaxEnt was set to randomly use 70% of the values for training and 30% of values for testing the model. We constructed the species distribution models using MaxEnt because it provides robust performance with small sample sizes (restricted distribution) of presence only data [64]. Model performance was evaluated using the area under the receiver operating characteristic curve (AUC; [68]). The model for the present was also projected to past climate scenarios, and past climate layers were drawn from WorldClim for two LGM past climate scenarios developed by the Paleoclimate Modelling Intercomparison Project Phase II [69]: the Community Climate System Model (CCSM; [70]) and the Model for Interdisciplinary Research on Climate (MIROC; [71]), and for the LIG [72]. Both CCSM and MIROC climate models simulate climate conditions as they are calculated to have been during the LGM, with a stronger temperature decrease assumed in CCSM than in MIROC [73]. Climate suitability was displayed in ArcView v3.2. (ESRI, Redlands, CA, USA).
Niche Divergence Tests
package in ArcMap v9 [74]. We defined the background characteristics of each group using 1000 random points inside each polygon, and then conducted a principal components analysis (PCA) using these data. The first three PC (niche) axes explained a high percentage of the variance (89%) and were thus used in further analyses. Niche divergence or conservatism was evaluated on each niche axis by comparing the observed difference between the means for each lineage on that axis to the mean difference in their background environments on the same axis [74]. A null distribution of background divergence was created by recalculating the score of background divergence over 1000 jackknife replicates with 75% replacement. Significance for rejecting the null was evaluated at the 95% level. These analyses were conducted using Stata v10 (StataCorp, College Station LP, Texas, USA).
Morphological Variation
To examine differences in morphological variation between the mist-netted Veracruz and Yucatan adult hummingbirds used in the genetic analyses, six measures were taken using a dial calliper with a precision of 0.1 mm and a wing ruler: total body length (BL; the distance from the tip of its bill to the tip of longest tail feather); exposed culmen (EC; from the base of the bill to the tip of the upper mandible); bill width at the base (BB; by the location of the nostrils); and wing chord (WC; the distance from the carpal joint to the tip of the longest unflattened primary) for both males and females, and tail length (TL; from the uropygial gland to the tip of the longest rectrix) for females, and the length of the outermost rectrices (r5), from the base of the uropygial gland to the tip of the longest rectrix (left and right) for males. All measurements were taken by YLV. Measurements for two juvenile males from Yucatan were discarded from the analysis. To examine morphological differences between populations, for males and females we conducted a one-way non-parametric Kruskal-Wallis test using genetic group as fixed factors and morphological measures as dependent variables. These analyses were performed using SPSS v17 for Mac (SPSS, Armonk, NY, USA).
Results
Phylogenetic Analysis of mtDNA and nuDNA
Interspecific phylogenetic relationships among mtDNA and
nuDNA sequences of D. eliza and other species in the bee
hummingbird group were reconstructed using Bayesian inference (BI) and Maximum Likelihood (ML). The BI and ML analyses yielded the same general topologies with minor differences in the position of some terminal branches. Only BI trees are shown. Both the BI and ML trees of the ND2 sequence data set confirmed that D. elizaandD. enicuraform a highly supported monophyletic clade
(PP = 0.95, bootstrap = 79%; Figure S2). A highly supported
relationship betweenDorichaand Calothoraxspecies was retrieved (P = 0.94, bootstrap = 75%), yet the relationships within these genera of sheartails and those between other members of the Mellisugini are not fully resolved (Figure S2). The level of polymorphism found in the Mellisugini of the nuclear 20454 locus was low and several haplotypes were shared among species. Most interspecific relationships in the Mellisugini were not resolved when only using 20454 (Figure S3). In contrast, the interspecific phylogenetic relationships among species in the Mellisugini were
more fully resolved when using the combined ND2+ATPase+
20454 data set (Figure 1). The relationship betweenD. elizaand D. enicura is retrieved with high support in both the BI and ML analyses (PP = 0.99, bootstrap = 98%), and monophyly of shear-tails (betweenDorichaandCalothoraxspecies) is also retrieved with
high support (PP = 1.0, bootstrap = 99%). Individuals ofD. eliza are retrieved as a monophyletic group (PP = 0.99, boot-strap = 95%), with a split separating the Veracruz and Yucatan populations (Figure 1). The BI inference using the combined data
set of both mtDNA and nuDNA (ND2+ATPase+20454), with
unpartitioned and partitioned DNA evolution models of each gene yielded the same relationships. The Bayes factor indicated that the BI tree obtained with the unpartitioned data was more informative (harmonic mean loglikelihood, unpartititoned = –4616.68,
parti-tioned by each gene = –4547.25, logB10 = 69.43,
2logB10 = 138.68), and this difference was very strong (the PP values for the tree obtained with partitioned data are shown in Figure 1).
Species Tree and Divergence Time Estimation
Relationships between D. eliza populations estimated in
*BEAST (Figure 2) strongly supported common ancestry for
the Veracruz and Yucatan populations (PP = 1.0). Results from
*BEAST (ND2+ATPase+20454) suggest that the divergence
between the Veracruz and Yucatan clades occurred at c. 120,000 years ago (95% HPD 240,000-31,000 ka), and the
divergence between Doricha species (TMRCA) in BEAST was
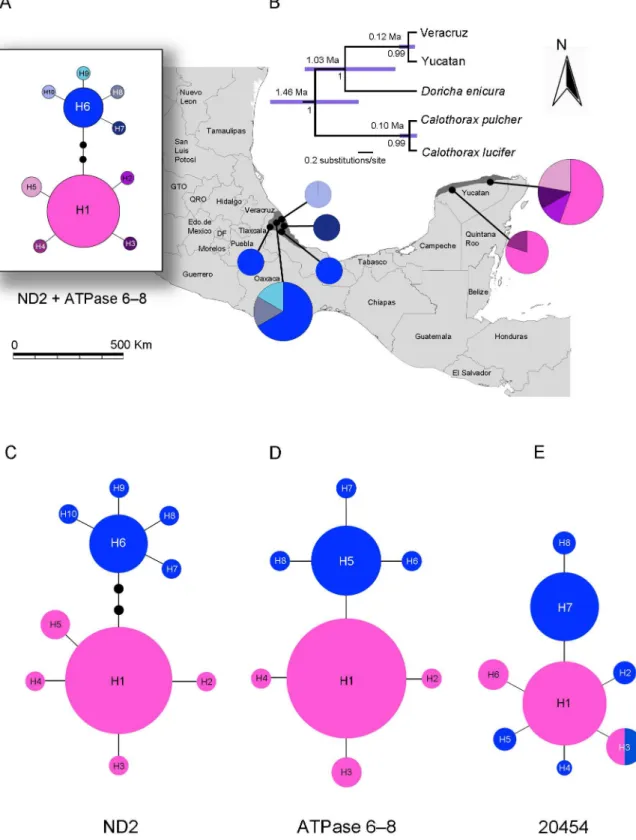
estimated to be 1.03 Ma (95% HPD 1.608-0.309 Ma) and 1.46 Ma (95% HPD 2.104-0.852 Ma) betweenCalothoraxspecies (Figure 2). Divergence time betweenD. elizapopulations was estimated to be 541,000 years ago (95% HPD 902,000-224,000 ka, PP = 0.99) when using the ND2 data set of Mellisugini representatives and 222,000 years ago (95% HPD 352,000-107,000 ka, PP = 1.0)
when using the ND2+ATPase data set. Estimates of the TMRCA
for Dorichaspecies and for the sheartails (Dorichaand Calothorax) indicate that the splits occurred at 1.04 Ma (95% HPD 1.674-0.486 Ma, PP = 0.99) and 2.06 Ma (95% HPD 3.224-1.038 Ma, PP = 1.0) when using the ND2 data set, and at 0.7 Ma (95% HPD 1.791-0.761 Ma, PP = 1.0) and 1.21 Ma (95% HPD 1.719-0.761 Ma, PP = 1.0) when using the ND2+ATPase data set.
Genetic Structure and Genetic Diversity
Sequencing two mtDNA markers in 25 individuals of D. eliza
(Tables S1 and S2) produced 10 haplotypes for ND2, and 8 haplotypes for ATPase, resulting in 10 haplotypes for the concatenated sequence (1077 bp). Phylogenetic analysis of the
ND2, ATPase, and concatenated ND2+ATPase haplotypes
revealed genetic divergence between the Veracruz and Yucatan populations with no shared haplotypes (Figure 2). Haplogroups are connected by more than one step for the ND2, one step for the
ATPase, and by four steps for the concatenated ND2+ATPase.
Haplotype diversity (h) and nucleotide diversity (p) were moderate
for both the Veracruz (h= 0.66660.163,p= 0.000760.0006) and
Yucatan (h= 0.56160.143,p= 0.000660.005) populations. When
samples were combined, overallhwas 0.796, and overallpwas
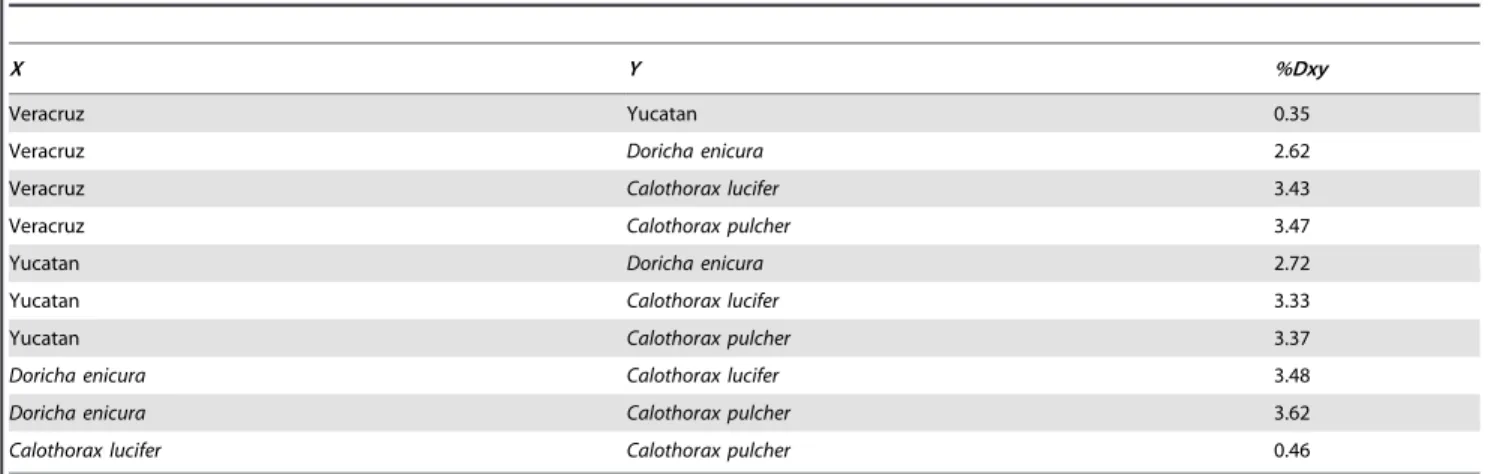
0.0020 indicating relatively high levels of genetic diversity in the Mexican Sheartail hummingbird. The AMOVA results revealed strong population structure (FCT= 0.79, df = 1,24,P,0.05) when samples were grouped by geographic area. Mitochondrial divergence between the Veracruz and Yucatan populations was low (Dxy= 0.35%), whereas genetic divergence between popula-tions ofD. elizaand the other members of the sheartails ranged from 0.46% to 3.47% (Table 1).
The sequencing of the nuDNA locus 20454 produced 8 haplotypes for the phased sequences. One haplotype was shared
between the Veracruz and Yucatan populations (Figure 2).
Historical Demography
We conducted demographic analyses for the Veracruz and Yucatan populations and for all populations ofD.elizausing the concatenated mtDNA data set. Neutrality tests revealed low and negative values in all cases, except that the Tajima’sDvalue for
the whole population was not significant (Table 2). In the
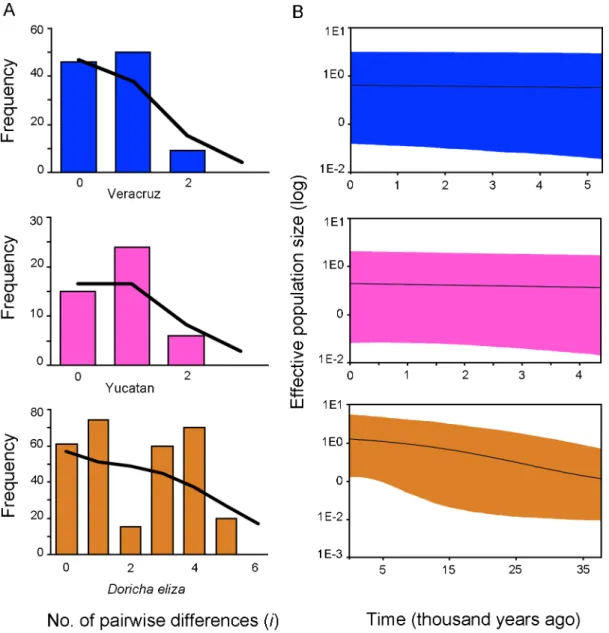
mismatch distribution (Figure 3), sudden demographic expansion (SSD values) was not rejected for all cases (Table 2). The BSP of Neover time showed no evidence for population expansion; BSP for the Veracruz and Yucatan lineages were flat over time and there was an increase in population size around the LGM (c. 21,000 years ago) when the Veracruz and Yucatan populations were pooled (Figure 3).
IMa results are summarized inTable 3. Results are reported as highest point estimates and 90% highest probability density (HPD). Based on the mutation rates obtained for Hawaiian honeycreepers, the ancestral population size (NA) was estimated to be 5,380 (90% HPD, 819–10,600) and the sizes of the two
descendant populations were NVERACRUZ= 1,830 (90% HPD,
1,120–2,520) and NYUCATAN= 1,410 (90% HPD, 993–1,830).
Migration rates between genetic groups (mYUCATANRVERACRUZ
andmVERACRUZRYUCATAN) were 1.28 (90% HPD, 0.316–2.790) and 1.02 (90% HPD, 0.299–2.120), respectively, and the divergence time (t) between genetic groups was estimated to be 22,100 years ago (90% HPD, 27,000-17,400 ka).
Figure 1. Bayesian posterior probabilities and bootstrap support for MrBayes and Maximum Likelihood analyses.Illustration of tree topology based on ND2+ATPase+20454 concatenated sequences of Doricha eliza and outgroups. Values above branches denote posterior probabilities (left) and bootstrap values (right) and those below branches denote the same values for phylogenetic analyses based on the ND2+
Figure 2. Genetic divergence ofDoricha elizapopulations in Veracruz and the Yucatan Peninsula, Mexico.(A) Haplotype network for ND2+ATPase 6–8 concatenated sequences overlaid on a relief map showing the geographical distribution ofD. eliza. (B) Species tree and time divergence estimates (95% HPD) in years from the *BEAST analysis based on both mitochondrial (ND2+ATPase) and nuclear DNA (20454 locus). Numbers below branches denote Bayesian posterior probabilities (PP). (C) Haplotype network for ND2. (D) Haplotype network for ATPase. (E) Haplotype network for 20454. Haplotypes are represented by circles, their size proportional to their frequency in the population. Each branch represents a single nucleotide change, with additional mutations indicated by black dots along branches. The color-coding of haplotypes is the same in all figures, blue colors for Veracruz and rose-pink colors for the Yucatan.
Species Distribution Models
The current distribution predicted by MAXENT (Figure 4)
closely matched the known range ofD. eliza(Figure 2), and the
models performed well (all AUC values.0.948). The ENM for
the current climate variables using both the Veracruz and Yucatan records predicted well the distribution of the species well and over-predicted the distribution of the Veracruz population (Figure 4). When models were projected onto past climatic layers based on two LGM climate scenarios (MIROC and CCSM), predictions suggest that suitable habitat for bothD. elizapopulations expanded in Veracruz and the Yucatan Peninsula with a large geographical disjunction. Lastly, models projected onto LIG climatic layers revealed a different scenario to the predicted ENM for the present (Figure 4). Predictions suggest that there was almost no suitable habitat for D. eliza in Veracruz, and that potentially suitable habitat forD. elizawas restricted to a smaller area in the tip of the Yucatan Peninsula, small areas in the arid central valleys of Oaxaca (low probability), and Guatemala.
Niche Divergence Tests
The PCA of environmental data that together three niche axes explained 88.7% of the variation inD. eliza(Veracruz and Yucatan records). The first niche axis (38.8% of variation) was associated with isothermality (BIO3) and precipitation of driest month (BIO14). The second niche axis (34.2%) was associated with annual precipitation (BIO12) and annual mean temperature (BIO1), and the third axis (15.7%) was associated with mean annual range (BIO2) and temperature seasonality (BIO4). Tests of niche divergence and conservatism on these three niche axes
showed evidence for niche conservatism on niche axis 1 and niche divergence on niche axis 2 and 3 (Table 4).
Morphological Variation
Morphological analysis detected no significant differences in the mean values of most traits between the Veracruz and Yucatan
populations (Kruskal-Wallis tests, P.0.05; Table S3 and
Figures S4 and S5), yet males from the Yucatan population
had significantly smaller left outermost rectrices (r5;
mean = 34.3 mm, SD = 0.05) than those from Veracruz
(mean = 37.3 mm, SD = 0.11; Kruskal-Wallis test, H= 7.5, P,
0.01;Figure S4).
Discussion
Mellisugini Phylogeny and the Molecular Placement of the Mexican Sheartail
A molecular phylogeny combining the available ND2 sequences to resolve the relationships within the Mellisugini (bees) clade was not available until now. Here we used a ND2 data set from four taxa assigned to the genera DorichaandCalothorax, as well as 22 samples of all other genera within Mellisugini [3] to determine the
place of D. eliza within this phylogeny. We included our ND2
(350 bp) sequences and the available ND2 (1041 bp) sequences were downloaded from GenBank, which led to a high percentage of missing characters. Although some studies found that incom-plete data could bias the ML and BI analysis [75], other studies have argued that missing data does not affect the accuracy of phylogenies in either the ML or BI analysis, and that phylogenetic
Table 1.Percent genetic distances between populations corrected for intra-population polymorphism (%Dxy).
X Y %Dxy
Veracruz Yucatan 0.35
Veracruz Doricha enicura 2.62
Veracruz Calothorax lucifer 3.43
Veracruz Calothorax pulcher 3.47
Yucatan Doricha enicura 2.72
Yucatan Calothorax lucifer 3.33
Yucatan Calothorax pulcher 3.37
Doricha enicura Calothorax lucifer 3.48
Doricha enicura Calothorax pulcher 3.62
Calothorax lucifer Calothorax pulcher 0.46
Data shown for differences between the Veracruz and Yucatan populations ofD. elizaand between species ofDorichaandCalothoraxbased on concatenated mtDNA (1077 bp).
doi:10.1371/journal.pone.0101870.t001
Table 2.Results of demographic analyses ofDoricha eliza.
Group N H D Fs SSD
Veracruz 10 5 –1.6670* –2.847*** 0.0311*
Yucatan 15 5 –1.5181* –2.676*** 0.0170*
Doricha eliza 25 10 –0.8057 –3.260** 0.0337*
N = number of individuals, H = number of haplotypes,D= Tajima’sD,Fs= Fu’sFs, SSD = differences in the sum of squares or mismatch distribution. *P,0.05,
**P,0.01, ***P,0.001.
accuracy is typically improved with the addition of characters even if much of the information for those characters is missing [76–77]. Most suspected members of the Mellisugini [3,78], Archilochus, Atthis, Calothorax, Calliphlox, Calypte, Chaetocercus, Doricha, Eulidia, Microstilbon, Myrmia, Myrtis, Rhodopis, Selasphorus (incl. Stellula), Thaumastura and Tilmatura, are recovered within two groups (sheartails and ‘‘Selasphorus’’+woodstars). A previous study [6]
using mtDNA sequences confirmed the inclusion of Doricha,
Calothorax, Atthisand Tilmaturain the Mellisugini as suggested by McGuire et al. [3], withTilmatura dupontiias the only representative of the woodstars and sister to all other bees in that study, whereas
our phylogenetic analyses place T. dupontii closer to South
American woodstars.
According to our phylogenetic analyses of the combined data set (ND2+ATPase+20454), the Mexican Sheartail hummingbird (D.
eliza) is strongly supported as the sister group to D. enicura, and together they appear as the sister toCalothoraxspecies forming the group of sheartails with strong support. The relationship between sheartails and woodstars, however, received moderate support, andArchilochus colubrisandA. alexandricluster with the woodstars. In a recent study surveying Mellisugini relationships using nuclear and mtDNA sequences [78],Archilochusspecies appeared in a clade withCalliphlox evelynaeandMellisuga minimabut a sister relationship between this clade and sheartails (Calothorax luciferandDoricha eliza) was not supported. More data is necessary, including that of Mellisuga helenae, Chaetocercus heliodor,Ch. astreans, Ch. berlepschiand Ch. jourdanii, to verify this position and to corroborate the monophyly of woodstars. Based on the BI and ML analyses of the combined data set (ND2+ATPase+20454), we propose thatD. Figure 3. Mistmatch distributions (A) and Bayesian skyline plots (B) showing historical demographic trends of Veracruz, the Yucatan and Doricha eliza populations using mitochondrial sequences. Histograms correspond to observed frequencies of pairwise nucleotide differences, and lines represent the expected frequencies under a sudden expansion model. Theyaxis of the skyline plots is the product between effective population size and the generation time and theyaxis is time in thousands of years. A mutation rate of 2.9610–2substitutions/ site/lineage/million years (s/s/l/My) for ND2, 2.2610–2s/s/l/My for ATPase, and 1610–3s/s/l/My for 20454 based on rates obtained for Hawaiian honeycreepers [33]. Solid lines represent median estimates and shaded areas represent 95% confidence intervals. The color-coding, as in Fig. 2, is blue for Veracruz, rose-pink color for the Yucatan, and orange for all populations ofD. eliza.
elizais sister toD. enicuraand both form a monophyletic clade with Calothoraxspecies.
Divergence Date Estimates
An important question that is implicit to our study is how much time after isolation (or colonization) is required for genetic and morphological variation to arise in natural populations. For Mexican Sheartails, the monophyly of D. elizais indicative of a single isolation or relatively recent colonization event from the Yucatan to Veracruz, perhaps in the last 120,000 years. The star-shaped haplotype network recovered in the ND2, ATPase, 20454 data sets and in the combined ND2+ATPase data set, and the lack of shared mtDNA haplotypes between the Veracruz and Yucatan populations also suggest a recent isolation or colonization followed by haplotype differentiation in situ. In contrast to the mtDNA pattern, one of the nuDNA locus 20454 low-frequency haplotypes is shared between populations, suggesting that the nuclear genome also became differentiated after a short history of isolation or colonization. The quasi star-shaped haplotype networks with some low frequency singletons separated from high frequency central haplotypes by a single mutational step, the moderate levels of differentiation between populations, and a mismatch distribution of pairwise differences among haplotypes indicating a sudden increase in expansion from a single population are all expected for a species that rapidly expanded from a single refugium with high levels of gene flow [51,79–80]. The modeled paleodistribution suggests that suitable LGM habitat for the Mexican Sheartail would have expanded under both the MIROC and CCSM scenarios, but suitable habitat conditions were not predicted in Veracruz during the LIG. While populations may have expanded during the LGM, the disjunction persisted and, therefore, our genetic results along with those of paleodistribution modeling correspond to the hypothesis of a relatively recent colonization event from the Yucatan to Veracruz.
Colonization
Mellisugini are a recently diverged lineage [3,6–7], and are part of a radiation that includes the evolution of several species of
Nearctic-Neotropical migrants [37,81]. Despite the observed genetic differentiation between the two populations of D. eliza, the question of how their isolation occurred remains unanswered. It is likely that the Veracruz population represents a relatively recent colonization event, though it is difficulty to directly observe immigration events in nature [82]. Colonization has been more important than large-scale vicariance in determining the phyloge-netic structure of hummingbird faunas, particularly the insular Mellisugini species assemblage of the West Indies [83], owing to their high dispersal ability, their capacity to adapt to novel environments [82–83], and the fact that migratory behavior can evolve rapidly in response to selection [37]. The Mellisugini are highly opportunistic generalists that, seasonally and altitudinally, cover large distances to track floral resources [5,84–85]. These migratory habits confer a natural vagility and may have predisposed them to fly long distances and tolerate a wide range of ecological regimes [84]. Although migratory behavior might have increased the colonization success of Mellisugini in the West Indies and remote geographic areas with a seasonal climate, vagrancy does not appear to predict the colonization of oceanic islands or remote areas [83], and it is not known whether migratory Mellisugini species are more prone to vagrancy than sedentary hummingbird species such as the Mexican Sheartail. An alternative explanation is that ancestral colonizers arrived naturally from Yucatan to Veracruz, a direction potentially assisted by the prevailing east-to-west trade winds and hurricanes. Our estimates of historical gene flow indicating a general trend of unidirectional gene flow between populations correspond to a Yucatan-to-Veracruz direction of historical migration.
Genetic and Morphological Differentiation between Disjunct Populations
Our results reveal moderate mtDNA divergence between the
Veracruz and Yucatan populations of D. eliza but reciprocal
monophyly of haplotypes, supporting the hypothesis of a short history of isolation. Moderate levels of haplotype and nucleotide diversity of populations suggest relatively small population sizes and founder effects. Significant genetic differentiation between
Table 3.Results of isolation-with-migration model (IMa) for the splits between the Veracruz (V) and Yucatan (Y) populations of Doricha eliza.
Model parameter estimates
qV qY qA t mV to Y mY to V
Veracruz vs. the Yucatan
Mean 2.213 1.712 6.538 1.917 1.155 1.192
HPD95Lo 1.360 1.206 0.994 1.505 0.465 0.495
HPD95Hi 3.056 2.206 12.883 2.341 1.823 1.911
Demographic parameter estimates
NV NY NA t NmY to V NmV to Y
Veracruz vs. the Yucatan
Mean 1,830 1,410 5,380 22,100 1.280 1.020
HPD95Lo 1,120 993 819 17,400 0.316 0.299
HPD95Hi 2,520 1,830 10,600 27,000 2.790 2.120
Model parameters indicate estimates without using the molecular rate of evolution for six parameters (IMa output values). Demographic rates represent parameters scaled to rates of molecular evolution;qparameters in thousands of effective population size (Ne),min genes per generation of effective migration rate (Nm),t parameter in thousands of years.
populations and limited gene flow resulting from barriers to dispersal have been found for montane hummingbird species in particular, such as Speckled Hummingbird (Adelomyia melanogenys) [86], Wedge-tailed Sabrewing (Campylopterus curvipennis) [87], Azure-crowned Hummingbird (Amazilia cyanocephala) [38,88], Broad-tailed Hummingbird (Selasphorus platycercus) [37] and Ame-thyst-throated Hummingbird (Lampornis amethystinus) [J. F. Ornelas, C. Gonza´lez, B. Herna´ndez-Ban˜os and J. Garcı´a-Moreno, unpublished data]. Limited differentiation has been found in
other species with a lowland distribution, such as the Rufous-tailed Hummingbird (Amazilia tzacatl) [89] and the Long-billed Hermit (Phaethornis longirostris) [90]. The Escudo Hummingbird (A. t. handleyi), endemic to the Caribbean island Escudo de Veraguas in western Panama, initially described as a distinct species on the basis of its considerably larger size and darker plumage, is slightly differentiated (ND2; 2 substitutions; uncorrected distance 0.2– 0.5%) from the mainlandA. tzacatlc. 10 km away [89].
Overall, population differentiation in the Mexican Sheartail seems primarily enhanced by isolation, which is reasonable for populations separated by a long distance. The Veracruz coloni-zation hypothesis is consistent with the lower migration rate of the Veracruz population to Yucatan than was found for the opposite direction, and with the results of the tests of niche conservatism that suggest that the Veracruz colonization with gene flow was facilitated by niche similarity (PC1). Consequently, following geographic isolation, the populations ofD. elizaseparated by the Gulf of Mexico would have been exposed and eventually adapted to the different environmental conditions. Populations of the Mexican Sheartail separated by 780 km (and by the Gulf) are distributed in a unique environmental space, implying that the different environmental conditions in the Yucatan Peninsula and in Veracruz would have reduced gene flow, as shown by the IMa results, and this would have reinforced the divergence of the two mtDNA haplogroups following the initial spatial separation. This scenario is supported by our tests of niche divergence and conservatism that compared the amount of climatic divergence to the null expectation of background climatic divergence and that showed evidence for niche divergence between theD. elizarecords of Veracruz and the Yucatan on two axes of environmental space related to annual precipitation and mean diurnal temperature range (PC2 and PC3). These findings support the hypothesis that climatic niche dissimilarity betweenD. elizapopulations separated by the Gulf seems to have reduced gene flow. Our analyses ofD. eliza, combining a phylogeographic and species distribution modeling approach, suggest that the observed patterns of genetic variation and divergence between the Veracruz and Yucatan populations are best explained by a combination of isolation exacerbated by subsequent climate differentiation between regions. Although the latter may be true for species that disperse poorly or that are reluctant to cross areas of less hospitable habitat for physiological reasons, niche divergence for other species with poor dispersal may mean enhanced opportunities for isolation and reduced gene flow, thereby increasing the likelihood of speciation. Our morphological analysis confirmed thatD. eliza humming-birds from Veracruz are similar in most trait mean values to individuals from the Yucatan population (see also [12]). Patterns of limited population differentiation in size trait values were surprising given the large geographic separation between the two populations and habitat differences. Studies of hummingbirds, such asA.melanogenys[86],C.curvipennis[87],A.cyanocephala[38],
and a member of the Mellisugini, S. platycercus [37], found
significant size differences between populations in different habitats, yet separated by shorter distances. In all these cases, the genetic break at the potential barriers corresponds to differences in morphology and to the lack of overlap in environmental space between lineages on both sides of the barrier. One possible explanation for this pattern is that vicariance and ecological divergence have both played an important role in the strong morphological differentiation between populations that are physically separated [38,86–87]. While this hypothesis may hold true for these hummingbird species, for which divergence times between populations were estimated to have occurred c. 700,000 years ago, the hypothesis alone is insufficient to explain the limited Figure 4. Distributional records and species distribution
models for Doricha eliza at present (A), the Last Glacial Maximum (LGM, 21 ka) (B, CCSM model; C, MIROC model), and the Last Interglacial (LIG, 140–120 ka) (D) climate condi-tions.The darkest colors indicate the highest predicted probability of occurrence.
morphological variation between the Veracruz and Yucatan populations of D. eliza. Interestingly, the time of divergence betweenD. elizapopulations was estimated at 120,000 years ago, supporting the hypothesis of a short period of isolation and limited morphological differentiation. However, male individuals from the Yucatan population had smaller values for the outermost rectrices than did males from Veracruz. It remains to be tested with larger sample sizes whether these differences represent significant levels of variation affecting the males’ acrobatic displays ([10], Figure S1 and Video S1), and thus increased sexual selection in the smaller population of Veracruz.
Conservation and Management Considerations
Our results reveal that the Veracruz and Yucatan populations of D. eliza are genetically differentiated, and that the outermost rectrices of male hummingbirds from Veracruz are longer than those of the males from Yucatan. The Mexican Sheartail Hummingbird is globally near threatened and both the Veracruz and Yucatan populations are locally endangered with population declines in Veracruz resulting from severe habitat degradation caused by livestock grazing, sugarcane cultivation and residential development, while the Yucatan population is under pressure mainly from the development of its coastal dune habitat for tourism [1,13–15]. Here we have identified that the disjunct populations ofD. elizaconstitute distinct genetic lineages, and that the importance of these populations as reservoirs of endemic genetic diversity require different management approaches and merit targeted conservation efforts to preserve the unique genetic pools of both populations and their habitats.
Supporting Information
Figure S1 Stills from video recording, showing mo-ments of a rocking pendulum flight displayed by a Doricha elizamale to a female at the nest.(A) Photograph
shows a maleD. elizafrom the Veracruz population. Photograph by Gerardo Sa´nchez Vigil. (B) Photograph shows a femaleD. eliza from the Veracruz population. Photograph by Yuyini Licona Vera. (C–J) The male begins the courtship display doing a pendulum flight (from left to right) in front of the female. During the display, the male extends his throat feathers and fully displays tail rectrices, while approaching the female repeatedly. The entire
time, the female at the nest follows the male’s movements (red arrows). This pendulum flight is done repeatedly around the female (from right to left and from left to right) and is finished with an upward flight (not shown in the video). The video is available as supplementary material – Video S1.
(TIF)
Figure S2 Bayesian posterior probabilities and boot-strap support for MrBayes and Maximum Likelihood analyses.Illustration of tree topology based on ND2 sequences for North American and South American members of the Mellisugini clade. Values above branches denote posterior probabilities (PP) and those below branches denote bootstrap values.
(TIF)
Figure S3 Bayesian posterior probabilities and boot-strap support for MrBayes and Maximum Likelihood analyses.Illustration of tree topology based on the nuDNA locus
20454 unphased sequences fromD. eliza and outgroups. Values
above branches denote posterior probabilities (PP) and those below branches denote bootstrap values.
(TIF)
Figure S4 Morphological differences between the Ver-acruz and Yucatan populations ofD. elizamales.Data are means and 95% confidence intervals for total body length (A), exposed culmen (B), base bill-width (C), wing chord (D), length of right outermost rectrix (E), and length of left outermost rectrix (F). Measurements are in mm.
(TIF)
Figure S5 Morphological differences between the Ver-acruz and Yucatan populations ofD. elizafemales.Data are means and 95% confidence intervals for total body length (A), exposed culmen (B), base bill-width (C), wing chord (D), and tail length (E). Measurements are in mm.
(TIF)
Table S1 Code for identification (ID), sex, state and locality of origin, geographic coordinates and elevation of sampled individuals ofDoricha eliza.
(DOC)
Table 4.Loadings of the environmental variables for each PC axis and tests of niche divergence and conservatism.
Niche Axes
PC1 PC2 PC3
BIO1 Annual Mean Temperature –0.2471 –0.5043 0.1829
BIO2 Mean Diurnal Range 0.4634 –0.0849 0.7049
BIO3 Isothermality 0.5661 –0.3322 0.0686
BIO4 Temperature Seasonality –0.4005 0.2751 0.6713
BIO12 Annual Precipitation 0.0082 0.6121 0.0565
BIO14 Precipitation of Driest Month 0.4932 0.4217 –0.1052
Percent variance explained 38.8 34.2 15.7
Observed differences 0.184* 3.637* 0.613*
Null distribution (1.801–1.820) (1.973–1.989) (0.334–0.3353)
Observed differences in climatic niche ofDoricha elizalineages (Veracruz and the Yucatan) on each PC axis. Bold values indicate significant niche divergence of the differences between their environmental backgrounds compared to the middle 95th percentile of a null distribution (in parentheses).
*Significance level,P,0.05.
Table S2 Species names, sequence data and GenBank accession numbers forDoricha eliza(25) and outgroups (51) used in this study.
(DOC)
Table S3 Code for identification (ID), sex, morpholog-ical data and GenBank accession numbers forDoricha elizaindividuals used in this study.
(DOC)
Video S1 Rocking pendulum flight as displayed by male Mexican Sheartails. The video was recorded at Miradores, Veracruz during the breeding season (07 September 2012). (MP4)
Acknowledgments
We extend our sincere gratitude to C. Ba´rcenas, I. Cha´vez-Domı´nguez, R. Dı´az-Valenzuela, C. Gonza´lez, R.A. Jime´nez, A. Malpica, G. Mejı´a, A.
Montes de Oca, A.E. Ortiz Rodrı´guez, F. Rodrı´guez-Go´mez, E. Ruı´z-Gonza´lez, E. Ruiz-Sa´nchez, M.J. Pe´rez Crespo, Pronatura Veracruz and A. Va´squez for field and laboratory assistance, and to G. Sa´nchez Vigil for permission to use his photographs in Figures 1 and 2. A. Navarro-Sigu¨enza, C. Gutie´rrez-Rodrı´guez, E. Ruiz-Sa´nchez, and three anony-mous reviewers provided useful comments on previous versions of the manuscript. Our fieldwork was conducted with the assistance of Irving Cha´vez and the permission of the Mexican Government, Secretarı´a de Medio Ambiente y Recursos Naturales, Subsecretarı´a de Gestio´n para la Proteccio´n Ambiental, Direccio´n General de Vida Silvestre (permit number SGPA/DGVS/07701/11). This work constitutes partial fulfill-ment of YLV’s degree requirefulfill-ments in Biodiversity and Systematics at INECOL.
Author Contributions
Conceived and designed the experiments: YLV JFO. Performed the experiments: YLV JFO. Analyzed the data: YLV JFO. Contributed reagents/materials/analysis tools: YLV JFO. Wrote the paper: YLV JFO.
References
1. IUCN (2013) The IUCN Red List of Threatened Species. Version 3.1. Available: http://www.iucnredlist.org. Accessed 2013 Nov. 23.
2. SEMARNAT (2010) Norma Oficial Mexicana NOM-059-ECOL-2010, Protec-cio´n ambiental-Especies nativas de Me´xico de flora y fauna silvestres-categorı´as de riesgo y especificaciones para su inclusio´n, exclusio´n o cambio-lista de especies en riesgo. Diario Oficial de la Federacio´n 30 December 2010. Me´xico, DF, 1–77.
3. McGuire JA, Witt CC, Remsen JV Jr, Dudley R, Altshuler DL (2009) A higher-level taxonomy for hummingbirds. J Ornithol 150: 155–165.
4. Ridgway R (1911) The Birds of North and Middle America. Bull US Nat Mus 50: 650–651.
5. Schuchmann KL (1999) Family Trochilidae (Hummingbirds). In: del Hoyo J, Elliott A and Sargatal J, editors. Handbook of the Birds of the World, Vol. 5, Barn-owls to hummingbirds. Barcelona, Spain: Lynx Editions, 468–535. 6. Ornelas JF, Gonza´lez C, Espinosa de los Monteros A, Rodrı´guez-Go´mez F,
Garcı´a-Feria LM (2014) In and out of Mesoamerica: temporal divergence of
Amaziliahummingbirds pre-dates the orthodox account of the completion of the Isthmus of Panama. J Biogeogr 41: 168–181.
7. McGuire JA, Witt CC, Altshuler DL, Van Remsen J Jr (2007) Phylogenetic systematics and biogeography of hummingbirds: Bayesian and maximum likelihood analyses of partitioned data and selection of an appropriate partitioning strategy. Syst Biol 56: 837–856.
8. Howell SNG, Webb S (1995) A guide to the birds of Mexico and northern Central America. Oxford, UK: Oxford University Press.
9. Scott PE (1994) Lucifer Hummingbird (Calothorax lucifer). In: Poole A and Gill F, editors. The Birds of North America, no. 134, Philadelphia, PA: Academy of Natural Sciences.
10. Dı´az-Valenzuela R, Lara-Rodrı´guez NZ, Ortiz-Pulido R, Gonza´lez-Garcı´a F, Ramı´rez Bautista A (2011) Some aspects of the reproductive biology of the Mexican Sheartail (Doricha eliza) in central Veracruz. Condor 113: 177–182. 11. Clark CJ, Feo TJ, Van Dongen WFD (2013) Sounds and courtship displays of
the Peruvian Sheartail, Chilean Woodstar, Oasis Hummingbird, and a hybrid male Peruvian Sheartail6Chilean Woodstar. Condor 115: 558–575. 12. Ortiz-Pulido R, Peterson AT, Robbins MB, Dı´az R, Navarro-Sigu¨enza AG, et
al. (2002) The Mexican Sheartail (Doricha eliza): morphology, behavior, distribution, and endangered status. Wilson Bull 114: 153–160.
13. Ornelas JF, Licona-Vera Y (2014)Doricha eliza(Lesson & DeLattre, 1839). In: Herna´ndez Baz F and Rodrı´guez Vargas DU, editors. Libro Rojo de la Fauna del Estado de Veracruz, Xalapa, Veracruz: Gobierno del Estado de Veracruz, 148–150.
14. Santamarı´a-Rivero W, MacKinnon B, Leyequie´n E (2013) Registros de anidacio´n del colibrı´ tijereta mexicano (Doricha eliza) en el estado de Yucata´n, Me´xico. Huitzil 14: 139–145.
15. Ortiz-Pulido R, Flores Ceballos E, Ortiz Pulido R (1998) Descripcio´n del nido deDoricha elizay ampliacio´n de su rango. Orn Neotrop 9: 223–224. 16. Sorenson MD, Ast JC, Dimcheff DE, Yuri T, Mindell DP (1999) Primers for a
PCR-based approach to mitochondrial genome sequencing in birds and other vertebrates. Mol Phylogenet Evol 12: 105–114.
17. Eberhard JR, Bermingham E (2004) Phylogeny and biogeography of the
Amazona ochrocephala(Aves: Psittacidae) complex. Auk 121: 318–332. 18. Backstro¨m N, Fagerberg S, Ellegren H (2008) Genomics of natural bird
populations: a gene-based set of reference markers evenly spread across the avian genome. Mol Ecol 17: 964–980.
19. Stephens M, Donelly P (2003) A comparison of Bayesian methods for haplotype reconstruction from population genotype data. Am J Human Genet 73: 1162– 1169.
20. Stephens M, Smith NJ, Donelly P (2001) A new statistical method for haplotype reconstruction from population data. Am J Human Genet 68: 978–989.
21. Ronquist F, Huelsenbeck JP (2003) MrBayes 3: Bayesian phylogenetic inference under mixed models. Bioinformatics 19: 1572–1574.
22. Stamatakis A (2006) RAxML-VI-HPC: maximum likelihood-based phylogenetic analyses with thousands of taxa and mixed models. Bioinformatics 22: 2268– 2690.
23. Miller MA, Pfeiffer W, Schwartz T (2010) Creating the CIPRES Science Gateway for inference of large phylogenetic trees. Proceedings of the Gateway Computing Environments Workshop (GCE), 14 Nov. 2010, New Orleans, LA, 1–8.
24. Posada D (2008) jModelTest: phylogenetic model averaging. Mol Biol Evol 25: 1253–1256.
25. Alfaro ME, Huelsenbeck JP (2006) Comparative performance of Bayesian and AIC-based measures of phylogenetic model uncertainty. Syst Biol 55: 89–96. 26. Felsenstein J (1985) Confidence limits on phylogenies: an approach using the
bootstrap. Evolution 39: 783–791.
27. Nylander JAA, Ronquist F, Huelsenbeck JP, Nieves-Aldrey JL (2004) Bayesian phylogenetic analysis of combined data. Syst Biol 53: 47–67.
28. Hillis DM, Bull JJ (1993) An empirical test of bootstrapping as a method for assessing confidence in phylogenetic analyses. Syst Biol 42: 182–192. 29. Heled J, Drummond AJ (2010) Bayesian inference of species trees from
multilocus data. Mol Biol Evol 27: 570–580.
30. Degnan JH, Rosenberg NA (2009) Gene tree discordance, phylogenetic inference and the multispecies coalescent. Trends Ecol Evol 24: 332–340. 31. Drummond AJ, Rambaut A (2007) BEAST: Bayesian evolutionary analysis by
sampling trees. BMC Evol Biol 7: 214.
32. Heled J, Drummond AJ (2010) Bayesian inference of species trees from multilocus data. Mol Biol Evol 27: 570–580.
33. Lerner HRL, Meyer M, James HF, Hofreiter M, Fleischer RC (2011) Multilocus resolution of phylogeny and timescale in the extant adaptive radiation of Hawaiian honeycreepers. Current Biol 21: 1838–1844.
34. Hosner PA, Nya´ri AS, Moyle RG (2013) Water barriers and intra-island isolation contribute to diversification in the insularAethopyga sunbirds (Aves: Nectariniidae). J Biogeogr 40: 1094–1106.
35. Voelker G, Bowie RCK, Klicka J (2013) Gene trees, species trees and Earth history combine to shed light on the evolution of migration in a model avian system. Mol Ecol 22: 3333–3344.
36. Pacheco MA, Battistuzzi FU, Lentino M, Aguilar RF, Kumar S, et al. (2011) Evolution of modern birds revealed by mitogenomics: timing the radiation and origin of major orders. Mol Biol Evol 28: 1927–1942.
37. Malpica A, Ornelas JF (2014) Postglacial northward expansion and genetic differentiation between migratory and sedentary populations of the broad-tailed hummingbird (Selasphorus platycercus). Mol Ecol 23: 435–452.
38. Rodrı´guez-Go´mez F, Gutie´rrez-Rodrı´guez C, Ornelas JF (2013) Genetic, phenotypic and ecological divergence with gene flow at the Isthmus of Tehuantepec: the case of the azure-crowned hummingbird (Amazilia cyanocephala). J Biogeogr 40: 1360–1373.
39. Ho SYW, Lanfear R, Bromham L, Phillips MJ, Soubrier J, et al. (2011) Time-dependent rates of molecular evolution. Mol Ecol 20: 3087–3101.
40. Smith BT, Klicka J (2010) The profound influence of the Late Pliocene Panamanian uplift on the exchange, diversification, and distribution of New World birds. Ecography 33: 333–342.
41. Marino IAM, Pujolar JM, Zane L (2011) Reconciling deep calibration and demographic history: Bayesian inference of post glacial colonization patterns in
Carcinus aestuarii(Nardo, 1847) andC. maenas(Linnaeus, 1758). PLoS One 6: e28567.
43. Excoffier L, Smouse PE, Quattro JM (1992) Analysis of molecular variance inferred from metric distances among DNA haplotypes: application to human mitochondrial DNA restriction data. Genetics 131: 479–491.
44. Excoffier L, Laval G, Schneider S (2005) Arlequin ver. 3.0: an integrated software package for population genetics data analysis. Evol Bioinformatics 1: 47–50.
45. Nei M (1987) Molecular Evolutionary Genetics. New York, NY: Columbia University Press.
46. Librado P, Rozas J (2009) DnaSP v5: a software for comprehensive analysis of DNA polymorphism data. Bioinformatics 25: 1451–1452.
47. Tajima F (1989) Statistical-method for testing the neutral mutation hypothesis by DNA polymorphism. Genetics 123: 585–595.
48. Fu YX (1997) Statistical neutrality of mutations against population growth, hitchhiking and background selection. Genetics 147: 915–925.
49. Harpending RC (1994) Signature of ancient population growth in a low-resolution mitochondrial DNA mismatch distribution. Human Biol 66: 591–600. 50. Schneider S, Excoffier L (1999) Estimation of demographic parameters from the distribution of pairwise differences when the mutation rates vary among sites: Application to human mitochondrial DNA. Genetics 152: 1079–1089. 51. Rogers AR, Harpending H (1992) Population growth makes waves in the
distribution of pairwise differences. Mol Biol Evol 9: 552–569.
52. Drummond AJ, Rambaut A, Shapiro B, Pybus OG (2005) Bayesian coalescent inference of past population dynamics from molecular sequences. Mol Biol Evol 22: 1185–1192.
53. Ho WYS, Shapiro B (2011) Skyline-plot methods for estimating demographic history from nucleotide sequences. Mol Ecol Res 11: 423–434.
54. Hey J, Nielsen R (2004) Multilocus methods for estimating population sizes, migration rates and divergence time, with applications to the divergence of
Drosophila pseudo-obscuraandD. persimilis.Genetics 167: 747–760.
55. Hey J, Nielsen R (2007) Integration within the Felsenstein equation for improved Markov chain Monte Carlo methods in population genetics. Proc Natl Acad Sci USA 104: 2785–2790.
56. Woerner AE, Cox MP, Hammer MF (2007) Recombination-filtered genomic datasets by information maximization. Bioinformatics 23: 1851–1853. 57. Storchova´ R, Reif J, Nachman MW (2009) Female heterogamety and speciation:
reduced introgression of the Z chromosome between two species of nightingales. Evolution 64: 456–471.
58. Calder WA, Calder LL (1992) Broad-tailed Hummingbird. In: Poole A, Stettenhein P and Gill F, editors. The Birds of North America. Philadelphia, PA: Academy of Natural Sciences of Philadelphia, 1–16.
59. Ruiz-Gutie´rrez V, Doherty PF, Santana E, Contreras Martı´nez S, Schondube J, et al. (2012) Survival of resident Neotropical birds: considerations for sampling and analysis based on 20 years of bird-banding efforts in Mexico. Auk 129: 500– 509.
60. Lande R, Engen S, Sæther BE (2003) Stochastic population dynamics in ecology and conservation. Oxford, UK: Oxford University Press.
61. Spellman GM, Klicka J (2006) Testing hypotheses of Pleistocene population history using coalescent simulations: phylogeography of the pygmy nuthatch (Sitta pygmaea). Proc R Soc Lond B 273: 3057–3063.
62. Elith JH, Phillips SJ, Hastie T, Dudı´k M, Chee YE, et al. (2011) A statistical explanation of MaxEnt for ecologists. Divers Dist 17: 43–57.
63. Navarro AG, Peterson AT, Gordillo-Martı´nez A (2003) Museums working together: the atlas of the birds of Mexico. In: Collar N, Fisher C and Feare C, editors. Why museums matter: avian archives in an age of extinction. Bull Brit Ornithologists’ Club Suppl 123A.
64. Phillips SJ, Anderson RP, Schapire RE (2006) Maximum entropy modeling of species geographic distributions. Ecol Modell 190: 231–259.
65. Phillips SJ, Dudı´k M (2008) Modeling of species distributions with MaxEnt: new extensions and a comprehensive evaluation. Ecography 31: 161–175. 66. Hijmans RJ, Cameron SE, Parra JL, Jones PG, Jarvis A (2005) Very high
resolution interpolated climate surfaces for global land areas. Int J Climatol 25: 1965–1978.
67. Hammer O (2011) PAST (Paleontological Statistics). Natural History Museum, University of Oslo. Available: http://folk.uio.no/ohammer/past/index.html.
68. Mertz CE (1978) Basic principles in ROC analysis. Sem Nuclear Med 8: 283– 298.
69. Braconnot P, Otto-Bliesner B, Harrison S, Joussaume S, Peterchmitt JY, et al. (2007) Results of PMIP2 coupled simulations of the Mid-Holocene and Last Glacial Maximum – Part 2: feedbacks with emphasis on the location of the ITCZ and mid- and high latitudes heat budget. Climate Past 3: 279–296. 70. Collins WD, Bitz CM, Blackmon ML, Bonan GB, Bretherton CS, et al. (2004)
The community climate system model: CCSM3. J Climate 19: 2122–2143. 71. Hasumi H, Emori S (2004) K-1 coupled GCM (MIROC) description, K-1 Tech.
Rep. 1, Climate Syst Res, Kashiwa, Japan.
72. Otto-Bliesner BL, Marshall SJ, Overpeck JT, Miller GH, Hu A (2006) Simulating Arctic climate warmth and icefield retreat in the Last Interglaciation. Science 311: 1751–1753.
73. Otto-Bliesner BL, Hewitt CD, Marchitto TM, Brady E, Abe-Ouchi A, et al. (2007) Last Glacial Maximum ocean thermohaline circulation: PMIP2 model intercomparisons and data constraints. Geophys Res Lett 34: L12707. 74. McCormack JE, Zellmer AJ, Knowles LL (2010) Does niche divergence
accompany allopatric divergence inAphelocomajays as predicted under ecological speciation?: insights from tests with niche models. Evolution 64: 1231–1244. 75. Lemmon AR, Brown JM, Stanger-Hall K, Lemmon EM (2009) The effect of
ambiguous data on phylogenetic estimates obtained by maximum likelihood and Bayesian inference. Syst Biol 58: 130–145.
76. Wiens JJ, Morrill MC (2011) Missing data in phylogenetic analysis: reconciling results from simulations and empirical data. Syst Biol 60: 719–731.
77. Wiens JJ, Tiu J (2012) Highly incomplete taxa can rescue phylogenetic analyses from the negative effects of limited taxon sampling. PLoS One 7: e42925. 78. McGuire JA, Witt CC, Remsen JV Jr, Corl A, Rabosky DL, et al. (2014)
Molecular phylogenetics and the diversification of hummingbirds. Current Biol 24: 910–916.
79. Slatkin M, Hudson RR (1991) Pairwise comparisons of mitochondrial DNA sequences in stable and exponentially growing populations. Genetics 129: 555– 562.
80. Hutchinson DW, Templeton AR (1999) Correlation of pairwise genetic and geographic distance measures: inferring the relative influences of gene flow and drift on the distribution of genetic variability. Evolution 53: 1898–1914. 81. Berns CM, Adams DC (2013) Becoming different but staying alike: patterns of
sexual size and shape dimorphism in bills of hummingbirds. Evol Biol 40: 246– 260.
82. Lees AC, Gilroy JJ (2014) Vagrancy fails to predict colonization of oceanic islands. Global Ecol Biogeogr 23: 405–413.
83. Bleiweiss R (1998) Origin of hummingbird faunas. Biol J Linn Soc 65: 77–97. 84. Des Granges JL (1979) Organization of a tropical nectar feeding bird guild in a
variable environment. Living Bird 17: 199–236.
85. Ornelas JF, Arizmendi MC (1995) Altitudinal migration: implications for the conservation of the Neotropical migrant avifauna of western Mexico. In: Wilson M and Sader S, editors. Conservation of Neotropical migratory birds in Mexico. Maine, USA: Maine Agriculture and Forestry Experimental Station, 98–112. 86. Chaves JA, Pollinger JP, Smith TB, LeBuhn G (2007) The role of geography and
ecology in shaping the phylogeography of the speckled hummingbird (Adelomyia melanogenys) in Ecuador. Mol Phylogenet Evol 43: 795–807.
87. Gonza´lez C, Ornelas JF, Gutie´rrez-Rodrı´guez C (2011) Selection and geographic isolation influence hummingbird speciation: genetic, acoustic and morphological divergence in the wedge-tailed sabrewing (Campylopterus curvipen-nis). BMC Evol Biol 11: 38.
88. Rodrı´guez-Go´mez F, Ornelas JF (2014) Genetic divergence of the Mesoamer-ican Azure-crowned hummingbird (Amazilia cyanocephala, Trochilidae) across the Motagua-Polochic-Jocota´n fault system. J Zool Syst Evol Res 52: 142–153. 89. Miller MJ, Lelevier MJ, Bermingham E, Klicka JT, Escalante P, et al. (2011)
Phylogeography of the rufous-tailed hummingbird (Amazilia tzacatl). Condor 113: 806–816.