Efeito aprendizado da perimetria automática padrão em indivíduos saudáveis
Department of Ophthalmology, Universidade Federal de São Paulo - UNIFESP - São Paulo (SP) - Brazil. 1Médica colaboradora do Setor de Glaucoma da
Univer-sidade Federal de São Paulo - UNIFESP - São Paulo (SP) - Brasil.
2Tecnóloga pela UNIFESP - São Paulo (SP) - Brasil. 3Médico pós-graduando do Setor de Glaucoma da
UNIFESP - São Paulo (SP) - Brasil.
Adress to correspondence: Dinorah Piacentini Engel Castro. Rua Borges Lagoa, 1.209/2.201 - São Paulo (SP) CEP 04038-033
E-mail: [email protected] Recebido para publicação em 20.11.2007
Última versão recebida em 24.02.2008 Aprovação em 13.03.2008
Dinorah Piacentini Engel Castro1
Juliana Kawase2
Luiz Alberto Soares Melo Jr.3
healthy individuals
Keywords: Visual fields;Learning; Perimetry; Sensory thresholds; Reference values; Sen-sitivity and specificity
Purpose: To evaluate the learning effect in standard automated perimetry
using SITA strategy, central 24-2 program, possible associated factors and spatial distribution in individuals with no perimetry experience. Methods:
A total of 55 healthy subjects were submitted to Humphrey perimetry in two different sessions in one day. Reliability and global indices, and threshold sensitivity at each point were compared between the two examinations. The influence of potential factors (age, gender, and educational level) and the spatial distribution were evaluated regarding alterations between these two examinations. Results: The duration of the test was longer in the
first session (median, 5.7 min; interquartile range [IQR], 1.7 min) than in the second (median, 5.3; IQR, 1.1 min) (p=0.002). The median (IQR) of false negative errors was 2% (6%) in the first examination and 0% (6%) in the second (p=0.04). The mean (standard deviation) in the mean deviation (MD) global index was -2.31 (1.86) dB in the first examination and -1.73 (1.69) dB in the second (p=0.07). No association was observed between the change in MD and age (p=0.29), gender (p=0.69) and educational level (p=0.27). The changes in threshold sensitivity were greater at the peripheral points than at the central points (p<0.001). Conclusion: The threshold sensitivity
increased in the second examination compared to the first. No factors were associated with this change. The changes in threshold sensitivity were more evident at the peripheral points.
ABSTRACT
INTRODUCTION
Glaucoma is the leading cause of nonreversible blindness and the se-cond cause of all types of blindness in the world(1). It is estimated that over
67 million people in the world are affected and 10% of those are legally blind(2). Standard automated perimetry (SAP) has been the gold standard
for the detection and monitoring of functional loss in glaucoma(3). This
examination detects the threshold sensitivity at different locations in the visual field, with good reproducibility, and without examiner influence(4-6).
The learning effect is an important issue in many psychophysical tests. It is generally assumed that the individual experience influences the results of automated perimetry(7). Several studies showed that healthy and
glau-comatous individuals can exhibit a learning effect with repeated standard automated perimetry testing(8-16). This effect was also demonstrated in short
wavelength automated perimetry(17-18), flicker perimetry(19), and frequency
Possible factors associated with the learning effect in glau-coma patients have been studied, such as age, race, gender and previous experience(26). However, studies that evaluate the
in-fluence of educational level on learning effect of automated perimetry have not been reported, and few studies analyzed the learning effect using Swedish interactive threshold algorithm (SITA) strategy(9-10). The learning effect in perimetry could be
influenced by possible associated factors including educatio-nal level. The performance of the first perimetry could be im-proved if a personal approach were provided before and during the examination.
The aim of this study is to evaluate the possible factors, including educational level, associated with learning effect and the spatial distribution of the changes in SAP using SITA strategy performed on the same day in healthy individuals.
METHODS
This study was approved by the Ethics in Research Com-mittee of the Federal University of São Paulo and conducted according to the tenets of Declaration of Helsinki and Health National Council resolution nº 196/96. Written informed con-sent was obtained from the participants.
Healthy subjects were recruited from volunteers of the com-munity, institution staff, and spouses or friends of patients. The participants underwent a complete ophthalmic examination in-cluding manifest refraction, slit lamp examination, Goldmann applanation tonometry, fundus biomicroscopy using a 78-diop-ter lens, and binocular indirect ophthalmoscopy. Race was ob-tained from subjects by self-designation. Educational level was classified according to the school instruction. Individuals with incomplete fundamental education in school were classified as incomplete primary education level. Those who completed fun-damental education were classified as complete primary level. The individuals who completed secondary education in school were classified as secondary level. The individuals who comple-ted the university/college were classified as tertiary level.
All recruited participants were 18 years or older, had not previously undergone SAP, had corrected visual acuity better than 20/40, intraocular pressure less than 22 mmHg on two different days, no media opacities except mild cataract (nu-clear opalescence and color less than 2, no peripheral cortical cataract, no subcapsular cataract by the Lens Opacities Clas-sification System III(27)), absence of glaucomatous optic nerve
head alterations (optic disc hemorrhages, neuroretinal locali-zed defect, cup disc ratio asymmetry greater than 0,2) and retinal nerve fiber layer defects. Exclusion criteria included: pregnancy, previous ocular surgery, retinal diseases, neurolo-gical pathologies that could influence the visual field, and inca-pacitating systemic disease (cerebral vascular disease, senile dementia, severe heart failure).
Detailed instructions about the perimetry, the test characte-ristics, the test duration, how each individual should perform the examination, were given verbally by either one of the two
examiners (D.P.E.C and J.K.) to the participants. SAP (central 24-2 program; SITA strategy- Humphrey-Zeiss Meditec Inc, Dublin, CA, USA) was performed in both eyes of the patients in two different sessions on the same day. The manifest refrac-tion and appropriate addirefrac-tion were corrected with trial lens. In each session, both eyes were examined in a random sequence. During the examination if the examiner noticed lack of atten-tion or misunderstanding of the examinaatten-tion, the test was paused and further explanation was given to the participant. If both eyes were eligible for this study, the first randomly cho-sen eye was analyzed. The interval between both sessions was 30 minutes or longer. The influence of age, gender and educational level on the learning effect was evaluated.
Statistical analysis
The statistical analysis was performed using the statistical package Stata 10.0 (StataCorp, College Station, TX, USA). The Wilcoxon signed rank test was used to compare the test duration, fixation loss, false positive and false negative error rates of the SAP between both sessions. The paired t test was performed to
compare the foveal sensitivity, mean deviation (MD) and pattern standard deviation (PSD) indices between sessions. The exact symmetry test was used to compare the results of the glaucoma hemifield test (GHT) between sessions.
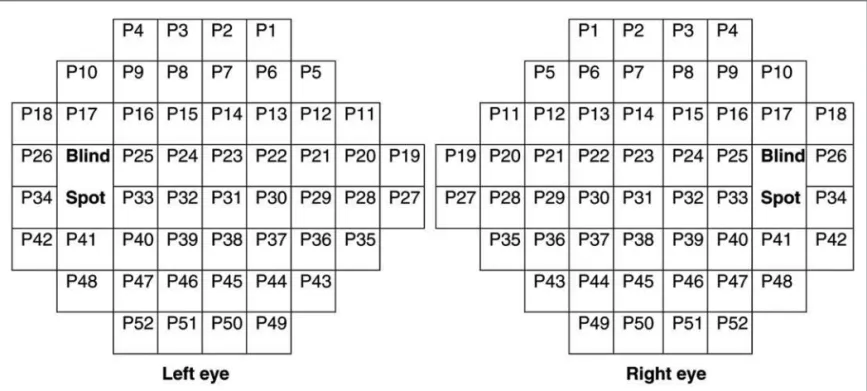
The within-subject standard deviation (SD) was calculated as the SD of the two threshold levels (one for each session) for each location tested in the SAP. The threshold level of the left eye was inverted for the right eye for analyses (Figure 1). The overall within-subject SD was calculated as the square root of the ave-rage within-subject variance of the 52 locations tested in the SAP. Spearman’s rank correlation test was used to evaluate the corre-lation of both the change in MD between sessions and overall within-subject SD with age. Mann-Whitney test was performed to compare both the change in MD between sessions and overall within-subject SD between male and female individuals. A non-parametric test for trend was used to compare the change in MD between sessions and overall within-subject SD between edu-cation levels. Friedman test was used to compare the within-subject SD across the locations tested in the SAP regarding the spatial distribution of the changes. Type I error was set at 0.05.
RESULTS
A total of 55 healthy volunteers were enrolled in this stu-dy. The mean (SD) age was 44.5 (14.4) years; 24 (44%) were men and 31 (56%) women. Regarding race distribution, 2 (4%) individuals were Asian, 31 (56%) were white, 6 (11%) were black, and 16 (29%) were mixed. Regarding educational level, 16 (29%) had incomplete primary education, 12 (22%) had com-plete primary education, 19 (35%) had secondary education and 8 (15%) had complete tertiary education.
sta-tistically significantly lower than that of the first session (me-dian, 5.7 min; Q1- Q3, 5.1-6.8 min) (p=0.002). The false negative error in the second session was lower than in the first session (p=0.04). The mean (SD) MD increased from -2.31 (1.86) dB in the first session to -1.73 (1.69) dB in the second session (p=0.007). The mean (SD) PSD decreased from 2.23 (1.40) in the first session to 1.86 (0.90) in the second session (p=0.03). None of the examinations had either positive or false negative errors above 33%. The first session, four examinations (7%) had fixa-tion loss above 20%; the second session, seven examinafixa-tions (13%) had fixation loss above 20%.
No factors were statistically significantly associated with changes in SAP between sessions. The correlation between age and MD change was 0.14 (p=0.29), and between age and within subject SD it was 0.12 (p=0.39). The mean (SD) MD change in men was 0.51 (0.93) dB and in women was 0.62 (1.87) dB (p=0.65). The mean (SD) within subject SD was 1.66 (0.46) dB in men and 2.37 (1.37) dB in women (p=0.05). Regarding the educational level, the mean (SD) difference in MD change between sessions for incom-plete primary, comincom-plete primary, secondary and tertiary level was, respectively, 0.75 (1.76) dB, 1.06 (2.09) dB, 0.21(0.87) dB and 0.36 (1.20) dB (p=0.27). The mean (SD) within subject SD for incomple-Figure 1 - The distribution of the perimetric points (p) in the left and right eyes that was used in the statistical analysis. The image of the left eye
is the mirror image of the right eye.
Table. Variables of standard automated perimetry in the two sessions
Variable First session Second session P
Test duration, median (Q1 to Q3), min 5.7 (5.1 to 6.8) 5.3 (4.7 to 5.8) 0.002
Reliability indices
Fixation loss, median (Q1 to Q3),% 0% (0% to 13%) 6% (0% to 12%) 0.490
False positive error, median (Q1 to Q3),% 1% (0% to 4%) 1% (0% to 3%) 0.670
False negative error, median (Q1 to Q3),% 2% (0% to 6%) 0% (0% to 4%) 0.040
Foveal sensitivity, mean (SD), dB 36.0 (2.1) 36.3 (2.2) 0.140
Global indices
MD, mean (SD), dB -2.31 (1.86) -1.73 (1.69) 0.007
PSD, mean (SD), dB 2.23 (1.40) 1.86 (0.90) 0.030
Glaucoma hemifield test, n (%*) 0.770
Within normal limits 33 (60) 38 (69)
Borderline 11 (20) 8 (15)
Outside normal limits 9 (16) 7 (13)
General reduction of sensitivity 2 (4) 1 (2)
Borderline and general reduction of sensitivity 0 (0) 1 (2)
te primary, complete primary, secondary and tertiary level was, respectively, 2.20 (1.25) dB, 2.36 (1.40) dB, 1.93 (1.01) dB and 1.65 (0.44) dB (p=0.16).
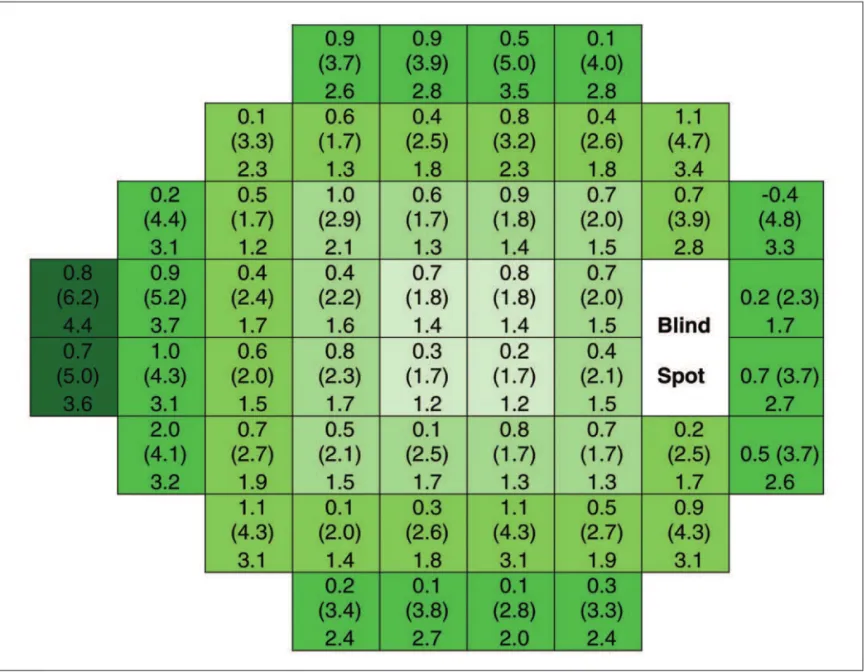
Greater changes in threshold sensitivity were observed in within subject SD when comparing peripheral points with central points (p <0.001) (Figure 2).
DISCUSSION
In this study a learning effect demonstrated by decrease in test duration, false negative errors, PSD, and increase in MD in two SAPs of healthy individuals with no previous perimetric experience, when they performed the exams in the same day was observed. Several studies have reported lear-ning effect both in glaucoma(10,15-16,28) and healthy
indivi-duals(7,9,13-14,28-29). Therefore, a change in the threshold
sensi-tivity can be expected between the first two SAP performed by an inexperienced individual.
In this study, none of the factors analyzed was associated with the perimetric changes between the two examinations. Auzen and Work(11) did not find an association between age
and learning effect, but they found short fluctuation to increa-se with age. Kulze et al. did not find association between lear-ning effect and area of the field tested, age, gender, race, pre-vious experience, or parameters on the initial field examination. However, learning effect was positively correlated to defect depth and negatively correlated to fixation losses(26).
To the best of our knowledge no study included educatio-nal level as a possible influence factor on the learning effect. Since SAP is a psychophysical test and presents a learning effect, one could think that the higher the educational level, the
Figure 2 - Spatial distribution of the variation in the threshold sensitivity in the 52 points tested in the standard automated perimetry. The distribution corresponds to the right eye. In each location, the values in the upper part represent the mean (standard deviation) difference (second minus first session) between the two sessions between individuals, and the value in the lower part represents the within-subject standard deviation.
better understanding of the examination, consequently, a better performance could be expected. However, this study did not find association between the educational level and learning effect in SAP. This could be due to the fact that all individuals were given detailed information about the examination before both examinations, and if lack of attention or fixation loss was noted during the testing, the examination was paused and fur-ther explanation was given. This routine might have produced a better perimetry result than the situation where the explanation is not given to the patient during the test.
In our study, few examinations had abnormal points. In fact, almost all examinations were within normal limits and the first examination was reliable. This could explain why we found little improvement between the two examinations.
In our study, all individuals had no previous experience with any type of perimetry. One study indicated that patients with previous manual perimetric experience failed to show a learning effect, while patients who had never undergone prior visual field testing improved on a second examination(12). One
report showed that in glaucoma patients who had previous manual perimetry experience, only the short-term fluctuation index improved while the average mean defect failed to chan-ge(30). Another study did not find association between
pre-vious experience and learning effect(26).
In this study, greater changes in threshold sensitivity were also observed at peripheral than at the central test point loca-tions. Heijl et al.(7), and Wood et al.(13), also found that the learning
effects were stronger in the periphery in agreement with our results. One possible limitation of this study is that only two exa-minations were performed to analyze the learning effect. Ho-wever, if further examinations were done in the same day, patients could have fatigued. Moreover, Heijl et al. showed that most improvement in SAP occurs in the first few tests(7). It is
important to note that both eyes of the individual were exami-ned in each session. Despite the fact that only one eye was included in the analysis. Therefore, the second examination included in the analysis of this study was, actually, the third experience of the individual with SAP.
CONCLUSION
There was an increase in threshold sensitivity between the first and the second examination sessions. No factors were associated with this increase. The changes in threshold sensi-tivity between examinations were more evident in the peri-pheral than in central locations in SAP. Therefore, normal patients independent of age, gender, or instruction level, should perform at least two perimetries. Even the individuals with high level of instruction still present learning effect.
RESUMO
Objetivo: Avaliar o efeito aprendizado da perimetria automati-zada padrão com a estratégia SITA, programa central 24-2,
possíveis fatores associados e distribuição espacial em indiví-duos inexperientes em perimetria. Métodos: Um total de 55
indivíduos saudáveis foi submetido a exame de perimetria com aparelho Humphrey em duas sessões no mesmo dia. Foram comparados os índices de confiabilidade, globais e limiares de sensibilidade de cada ponto entre os exames. Foram analisa-dos potenciais fatores relacionaanalisa-dos (idade, sexo e nível educa-cional), bem como a distribuição espacial em relação à altera-ção entre os exames. Resultados: A duração do exame foi
maior na primeira sessão (mediana, 5,7 min; amplitude inter-quartil [AIQ], 1,7 min) do que na segunda (mediana, 5,3; AIQ, 1,1 min) (p=0,002). A mediana (AIQ) da taxa de falsos negati-vos foi 2% (6%) no primeiro exame e 0% (4%) no segundo exame (p=0,04). A média (desvio padrão) do índice global des-vio médio (MD) foi -2,31 (1,86) dB no primeiro exame e -1,73 (1,69) dB no segundo exame (p=0,007). Não houve associação entre a mudança do MD em relação à idade (p=0,29), sexo (p=0,69) e nível de escolaridade (p=0,27). Houve maior alteração na sensibilidade dos pontos periféricos em relação aos pontos centrais (p<0,001).Conclusão: Houve melhora dos limiares de
sensibilidade entre o primeiro e segundo exames. Não foram detec-tados fatores associados a estas mudanças. Nos pontos mais periféricos do exame, tais mudanças foram mais acentuadas.
Descritores: Campos visuais; Perimetria; Aprendizagem; Limiar
sensorial; Valores de referência; Sensibilidade e especificidade
REFERENCES
1. Congdon N, O’Colmain B, Klaver CC, Klein R, Muñoz B, Friedman DS, et al. Causes and prevalence of visual impairment among adults in the United States. Arch Ophthalmol. 2004;122(4):477-85.
2. Quigley HA, Broman AT. Number of people with glaucoma worldwide in 2010 and 2020. Br J Ophthalmol. 2006;90(3):262-7. Comment in: Br J Ophthalmol. 2006;90(3):253-4.
3. Fankhauser F, Koch P, Roulier A. On automation of perimetry. Albrecht Von Graefes Graefes Arch Clin Exp Ophthalmol. 1972;184(2):126-50.
4. Anderson DR, Patella VM. Automated static perimetry. 2nd ed. St Louis:
Mosby Year Book; 1999.
5. Shirato S, Inoue R, Fukushima K, Suzuki Y. Clinical evaluation of SITA: a new family of perimetric testing strategies. Graefes Arch Clin Exp Ophthalmol. 1999;237(1):29-34.
6. Bengtsson B, Heijl A. Evaluation of a new perimetric threshold strategy, SITA, in patients with manifest and suspect glaucoma. Acta Ophthalmol Scand. 1998;76(3):268-72.
7. Heijl A, Lindgren G, Olsson J. The effect of perimetric experience in normal subjects. Arch Ophthalmol. 1989;107(1):81-6.
8. Werner EB, Krupin T, Adelson A, Feitl ME. Effect of patient experience on the results of automated perimetry in glaucoma suspect patients. Ophthalmo-logy. 1990;97(1):44-8.
9. Schimiti RB, Avelino RR, Kara-José N, Costa VP. Full-threshold versus Swedish Interactive Threshold Algorithm (SITA) in normal individuals under-going automated perimetry for the first time. Ophthalmology. 2002;109(11): 2084-92; discussion 2092.
10. Schimiti RB, Arciery ES, Avelino RR, Matsuo T, Costa VP. Full-threshold vs. Swedish Interactive Threshold Algorithm (SITA) em pacientes glaucomatosos submetidos à perimetria computadorizada pela primeira vez. Arq Bras Oftalmol. 2006;69(2):145-50.
11. Autzen T, Work K. The effect of learning and age on short-term fluctuation and mean sensitivity of automated static perimetry. Acta Ophthalmol (Copenh) 1990;68(3):327-30.
quantitative threshold field examination. Impact of age and ocular status. Arch Ophthalmol. 1986;104(3):398-401.
13. Wood JM, Wild JM, Hussey MK, Crews SJ. Serial examination of the normal visual field using Octopus automated projection perimetry. Evidence for a learning effect. Acta Ophthalmol (Copenh). 1987;65(3):326-33.
14. Flammer J, Drance SM, Zulauf M. Differential light threshold. Short and long term fluctuation in patients with glaucoma, normal controls, and patients with suspected glaucoma. Arch Ophthalmol. 1984;102(5):704-6.
15. Heijl A, Bengtsson B. The effect of perimetric experience in patients with glaucoma. Arch Ophthalmol. 1996;114(1):19-22.
16. Nordmann JP, Brion F, Hamard P, Mouton-Chopin D. [Evaluation of the Humphrey perimetry programs SITA Standard and SITA Fast in normal probands and patients with glaucoma]. J Fr Ophthalmol. 1998;21(8):549-54. 17. Wild JM, Moss ID. Baseline alterations in blue-on-yellow normal perimetric
sensitivity. Graefes Arch Clin Exp Ophthalmol. 1996;234(3)141-9. 18. Rosseti L, Fogagnolo P, Miglior S, Centofanti M, Vetrugno M, Orzalesi N.
Learning effect of short-wavelength automated perimetry in patients with ocu-lar hypertension. J Glaucoma. 2006;15(5):399-404.
19. Bernardi L, Costa VP, Shiroma LO. Flicker perimetry in healthy subjects: influence of age and gender, learning effect and short term fluctuation. Arq Bras Oftalmol. 2007;70(1):91-9.
20. Matsuo H, Tomita G, Suzuki Y, Araie M. Learning effect and measurement variability in frequency-doubling technology perimetry in chronic open-angle glaucoma. J Glaucoma. 2002;11(6):467-73.
21. Fujimoto N, Minowa K, Miyauchi O, Hanawa T, Adachi-Usami E. Learning effect for frequency doubling perimetry in patients with glaucoma. Am J Ophthalmol. 2002;133(2):269-70.
22. Horani A, Frenkel S, Yahalom C, Farber MD, Ticho U, Blumenthal EZ. The learning effect in visual field testing of healthy subjects using frequency dou-bling technology. J Glaucoma. 2002;11(6):511-6.
23. Iester M, Capris P, Pandolfo A, Zingirian M, Traverso CE. Learning effect, short-term fluctuation, and long-term fluctuation in frequency doubling techni-que. Am J Ophthalmol. 2000;130(2):160-4.
24. Pierre-Filho PT, Schimiti RB, Vasconcellos JP, Costa VP. Sensitivity and spe-cificity of frequency-doubling technology, tendency-oriented perimetry, SITA Standard and SITA Fast perimetry in perimetrically inexperience individuals. Acta Ophthalmol Scand. 2006;84(3):345-50.
25. Hong S, Na K, Kim CY, Seong GJ. Learning effect of Humphrey Matrix perime-try. Can J Ophthalmol. 2007;42(5):707-11.
26. Kulze JC, Stewart WC, Sutherland SE. Factors associated with a learning effect in glaucoma patients using automated perimetry. Acta Ophthalmol (Copenh). 1990;68(6):681-6.
27. Chylack LT Jr, Wolfe JK, Singer DM, Leske MC, Bullimore MA, Bailey IL,et al. The Lens Opacities Classification System III. The Longitudinal Study of Cataract Group. Arch Ophthalmol. 1993;111(6):831-6.
28. Salvetat ML, Zeppieri M, Parisi L, Brusini P. Rarebit perimetry in normal subjects: test-retest variability, learning effect, normative range, influence of optical defocus, and cataract extraction. Invest Ophthalmol Vis Sci. 2007; 48(11):5320-31.
29. Stewart WC, Hunt HH. Threshold variation in automated perimetry. Surv Ophthalmol. 1993;37(5):353-61.