www.ann-geophys.net/29/1537/2011/ doi:10.5194/angeo-29-1537-2011
© Author(s) 2011. CC Attribution 3.0 License.
Annales
Geophysicae
A statistical and event study of magnetotail dipolarization fronts
D. Schmid1,2, M. Volwerk1, R. Nakamura1, W. Baumjohann1, and M. Heyn2 1Space Research Institute, Austrian Academy of Sciences, 8042 Graz, Austria 2Institute for Theoretical Physics, Technical University Graz, 8010 Graz, Austria
Received: 8 February 2011 – Revised: 12 August 2011 – Accepted: 26 August 2011 – Published: 8 September 2011
Abstract. A study of dipolarization fronts of the Earth’s magnetotail has been performed using seven years (2001– 2007) of Cluster data. Events both with and without high-speed earthward flows are included. A superposed epoch analysis of the data shows that the dipolarization is preceeded by a decrease ofBzbefore the increase. The duration of the dipolarization tends to be decreasing with increasing veloc-ity of the plasma flows. The thickness of the dipolarization front is on average 1.8 plasma inertial lengths, independent of the plasma velocity. We find that the events fall into two categories: Earthward and tailward moving dipolarizations. The dipolarization fronts can be assumed to be tangential discontinuities and the currents on the front have mainly a perpendicular component.
Keywords. Electromagnetics (Plasmas) – Magnetospheric physics (Magnetotail; Storms and substorms)
1 Introduction
Magnetotail dipolarizations are usually associated with sub-storms (e.g. Baumjohann et al., 1999), after reconnection has taken place on the stretched field lines, the newly connected field lines will move towards the Earth, releasing the mag-netic tension. This creates fast earthward flows (see e.g. An-gelopoulos et al., 1992; Baumjohann et al., 2002) and a turn-ing of the magnetic field from the x-direction along the tail axis into the z-direction perpendicular to the current sheet in the tail, making it look like a more dipole-like field, hence the name dipolarization.
Note that, although true dipolarization only occurs around geosynchronous distances, this term has been expanded in
Correspondence to:D. Schmid
meaning to include processes that occur in the Earth’s mag-netotial. In order to keep nomenclature consistent with the many magnetotail papers that have been published over the last years (cited further below) we use terms dipolariza-tion and dipolarizadipolariza-tion front for the (reconnecdipolariza-tion) flow-associated magnetic field turnings.
These dipolarizations still leave a lot of questions open, with respect to the details of their structure like: What is the thickness of the dipolarization front, defined as the quick turning fromBx toBz?; Are there currents flowing on the front, and if so, what is the nature of these currents?; Is the structure of the dipolarization front dependent on its veloc-ity?; Why canBzdecrease to become negative before it starts to increase? In this paper we will try to answer some of these open questions after a short discussion on what has been done before.
Single-spacecraft statistical studies and overall character-istics of fast flows and dipolarizations were obtained, using observations by Geotail (Ohtani et al., 2004) and data from Wind (Sigsbee et al., 2005). The important characteristics obtained in these two papers for this present study are:
1. The magnetic field becomes dipolar in the course of the fast earthward flow;
2. Sharp dipolarization tends to be preceded by a transient decrease inBz, which starts along with the fast flow and is accompanied by an increase in the plasma density; 3. The plasma and total pressures decrease in the course of
the fast flow.
front (at∼77 km s−1) had an estimated size of∼2000 km. A study on the propagation of dipolarizations has been done by Takada et al. (2006), where both Cluster and Double Star data were used. It was found that flow-associated activity disi-pates within a limited spatial scale (4–8RE) and that the ini-tial topology of the inner magnetosphere contributes strongly to how far fast flows can penetrate towards the Earth (see e.g. Dubyagin et al., 2011).
The THEMIS mission (Angelopoulos, 2002), designed to look at the time-history of substorms was used to show the Earthward flowing of a dipolarization front from∼20RE to
∼11RE at a velocity of ∼300 km s−1. Using the passage-time of the front over the spacecraft it was estimated that the thickness of the front was∼400–500 km, i.e. at the size of the ion inertial length, with the larger size found closer to the Earth (Runov et al., 2009).
Li et al. (2011) studied the force balance around dipolar-ization fronts within bursty bulk flows by comparing curva-ture force densities and total pressure gradient force den-sities ahead of and behind the dipolarization fronts. In-deed plasma acceleration immediatiely after the dipolariza-tion front can be explained by the resultant increased curva-ture force density.
Dipolarization-associated currents in the magnetotail were studied in a variaty of ways: concerning the substorm current wedge in the near-Earth region (Lui et al., 2008) and fur-ther down the tail (Nakai and Kamide, 2000; Volwerk et al., 2008). However, determination of the current specifically as-sociated with the dipolarization front has been done by Zhou et al. (2009), who found a current layer with a thickness of the ion inertial length. Zhang et al. (2011) studied current carriers observed within thin current sheets ahead of and dur-ing the passage of earthward-movdur-ing dipolarization fronts in the near-Earth plasma sheet using THEMIS measurements. Contributions by both diamagnetic and polarization currents were found.
However, in this paper we will use the data from Cluster and use multi-spacecraft analysis to obtain the characteristics of the dipolarization fronts such as thickness and associated currents. The special set-up of the Cluster spacecraft, i.e. in a tetrahedron-shape in regions of interest (e.g. the magnetotail) gives the possiblity of determining the currents through the gradients in the magnetic field (Harvey, 1998).
2 Data set and selection criteria
For the event selection, we used the 4-s averaged magnetic field data obtained by the Flux Gate Magnetometer (FGM, Balogh et al., 2001) and plasma data from the Composi-tion Ion Spectrometer (CIS, R`eme et al., 2001) on Clus-ter 1, and throughout the paper the Geocentric Solar Mag-netospheric (GSM) coordinate system is used. To survey the dipolarization events in the nightside magnetotail, we used the dataset from Cluster between July and October for the
years 2001 to 2007, when the spacecraft were located be-tween−20RE≤XGSM≤ −10REand|YGSM| ≤15RE.
To find the dipolarization events, we used similar selection criteria as Takada et al. (2006) and Sigsbee et al. (2005). In contrast to these selection criteria we used a 3-min long slid-ing window instead of a 5-min window. This could result in only “short” dipolarization events, however, it will be shown that there is little effect by the window size. We put on the following requirements on the events:
– The spacecraft is located in the plasma sheet, i.e. plasma-β≥0.5 (Baumjohann et al., 1990).
– The observed earthward plasma flow (perpendicular ve-locityV⊥in XY plane) is at least in one data point (out
of 45 data points in the 3-min window) greater than V⊥,x≥150 km s−1.
– The difference in elevation angleθ between minimum and maximumBzduring the window exceeds1θ≥10◦ and1Bzalso exceeds 4 nT.
– The elevation angle is at least in one data point greater thanθ≥45◦(Baumjohann et al., 1999).
We have found 355 dipolarization events using Cluster 1 data. Here we restrict the events for mainly earthward domi-nant flow. That is, we exclude those events for which the flow turns tailward, faster than −100 km s−1 within the 3-min window. From the 355 events 219 events were categorized as earthward dominant flow. This means that there is a large percentage (38 %) of tailward flows withVx<−100 km s−1 when one compares this number with what is cited by An-gelopoulos et al. (1994) for tailward BBFs in the same re-gion (7 %). However Angelopoulos et al. (1994) set a higher velocity limit for tailward BBFs (|V|>400 km s−1). Naka-mura et al. (2004) found that 22 % of the fast flows, with
|V|>300 km s−1, observed in their study were tailward. From these 219 events 160 events had only positive veloc-ity values and 59 events were categorized as tailward-mixed earthward flow events. That means that these 59 events have a slight tailward flow (0> V⊥,x>−100 km s−1) within the 3-min interval. As the majority of flows in the dataset is cat-egorized as earthward dominant flow, only these 219 events will be investigated further.
To maintain that the spacecraft remains near the center of the plasma sheet, close to the neutral sheet, we require ad-ditionally: |Bx|<5 nT during the 3-min window. We also set the condition:|YGSM| ≤12RE. Consequently 107 events remained for further analysis.
minimumBzvalues during the dipolarization (marked by cir-cles in Fig. 1) and 38 events had negative minimumBz val-ues (marked by stars in Fig. 1). In the following we examine these 107 events that took place close to the neutral sheet.
3 Observations
In this section the changes in the magnetic fieldBz associ-ated with the plasma flow are investigassoci-ated. Superposed epoch analyses are conducted, where the median and the upper and lower quartiles are used to get the general shape of the dipo-larizations and the variation therein.
3.1 Event view
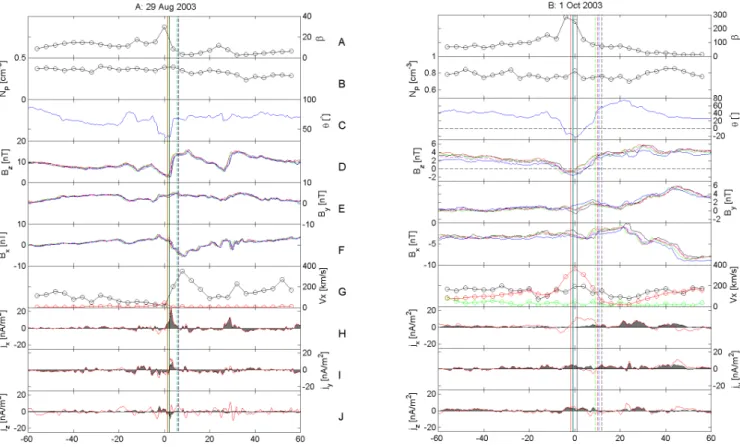
Figure 2 shows dipolarization events on 29 August 2003 at 13:53 UT and 1 October 2003 at 21:00 UT. The horizontal axis in Fig. 2 covers a 2-min interval centered att=0. This reference time, t=0, corresponds to the start time of the sharpest increase inBz within the 2-min interval. We will discuss two specific events first, before starting the super-posed epoch analysis of all events chosen for this study.
The event on 29 August 2003 (Fig. 2a) shows a sharp dipo-larization front where it took about 4 s to go fromBz,minto Bz,max(panel d). The magnetic field elevation angle (panel c) to the equatorial plane at Cluster 1 was about∼60◦before
the start of the magnetic dipolarization. There seems to be some oscillations in front of the dipolarization, increasing the elevation angle, after which it decreases to a minimum of
∼40◦att=0. The elevation angle then increased to a value
of∼70◦att=4 s and then decreases to∼65◦. The
perpen-dicular plasma flow is shown in panel (g). The maximum perpendicular earthward flow in x-direction of∼300 km s−1 was observed 8 s after the sharp change ofBz and decayed gradually 28 s after the dipolarization. The plasma flow in y-and z-direction was barely existing.
The event on 1 October 2003 (Fig. 2b) shows a dipo-larization, where it took about 12 s to go from Bz,min to Bz,max(panel d). The magnetic field elevation angle to the equatorial plane (panel c) at Cluster 1 was ∼50◦. The
elevation angle first decreased to a minimum of ∼ −20◦
and then increased back to a value of ∼70◦ at t=20 s.
The maximum perpendicular earthward flow (panel g) in x-direction was∼200 km s−1 during the dipolarization. The maximum plasma flow in y-direction was significant higher at∼400 km s−1at the dipolarization and decayed gradually
∼20 s after the dipolarization. The plasma flow in z-direction was negligible.
The plasma-β, shown in panel (a), for both events was 20 and 250, respectively during the dipolarization, indicat-ing that the spacecraft was well situated in the plasma sheet. The increase in plasma-βis caused by increasing the plasma density,NP(shown in panel b), in front of the dipolarization flow due to the compression of the plasma.
−20
−15
−10
−12
−9
−6
−3 0 3 6 9 12
X
GSM [RE]
YGSM
[R
E
]
A: XY location of C1 during events
−10 −5 0 5−12
−9
−6
−3 0 3 6 9 12
Z
GSM [RE]
YGSM
[R
E
]
B: YZ location of C1 during events
pos Bz neg Bz
Fig. 1.Cluster spacecraft position in the XY and YZ plane for the 107 earthward flow events observed during the years 2001-2007. The 69 events with positive minimumBzvalues are marked by
cir-cles. The 38 events with negative minimumBzvalues during the
dipolarization are marked by stars.
Panels (h)–(j) in Fig. 2 shows the electric currents deter-mined by the curlometer technique with the currents perpen-dicular to the magnetic field (shown as filled region under the red curves). However this will be discussed in Sect. 5. 3.2 Superposed epoch study of dipolarizations
Figure 3a shows the Z-component of the magnetic field for the 107 dipolarization events (Bz, black lines) and the median over plotted (Bz, red line). The green lines are the upper and lower quartiles ofBz. As one can see, for the median of all these events the Bz drops to a minimum before it starts to increase.
To examine howBzchanges in association with the plasma flow we have divided the dataset into 2 subsets accord-ing to the maximum speed of the horizontal perpendicu-lar earthward plasma flow: 150< V⊥,xy<400 km s−1 and 400 km s−1< V
Fig. 2.Data for 29 August 2003 from 13:52 UT till 13:54 UT (left panel) and for 1 October 2003 from 20:59 UT till 21:01 UT (right panel). Panel(A)the proton density; Panel(B)the plasma-β; Panel(C)the magnetic field inclination angle for C1; Panels(D)–(F)the three magnetic field components for all Cluster spacecraft; Panel G: The perpendicular plasma flow velocityVx(black),Vy(red) andVz(green); Panels(H)–
(J)the three components of the electric currents determined by the curlometer technique with the current perpendicular to the magnetic field shown as the filled region under the red curves. The two specific times for the ’timing-method’ (marked by the horizontal colored solid lines forBz,minand the dashed lines forBz,maxare also shown.
XY plane and the medians of the two superposedBzis plot-ted. The result of the superposed epoch analysis shows that the gradient of the dipolarization increases with enhanced velocity. For the low velocity set we find1Bz≈3.5 nT in 1t=12 s, whereas for the high velocity set1Bz≈6 nT in the same time interval. This observational result suggests that the duration of the dipolarization is anti-correlated with the plasma velocity. Also, the variation inBzis much greater for the fast flow, a deeper decrease before the dipolarization and a larger end value after the dipolarization. To obtain in-formation about the temporal and spatial scale seperately, it is necessary to use the data not only form Cluster 1 (as up to now) but also from other Cluster spacecraft.
From the 107 dipolarization events, 38 events have an neg-ativeBz,minvalue, see the negative values att=0 in Fig. 3a. There can be various possible reasons for a negativeBz,min value, with the spacecraft close to the center of the plasma sheet. Amongst possible others, there are:
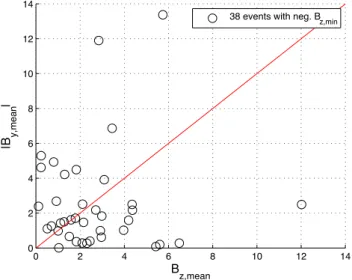
1. The magnetotail can be tilted in the YZ plane during the observed event and theBzundershoot becomes negative because of a non-zeroBycomponent in the tail. In
or-der to test this first explanation, the relation between the mean of the magnetic field in y-direction,|By,mean|and z-direction,Bz,meanof the 38 dipolarization events with a negativeBz,min(black circles) is shown in Fig. 4. The mean average ofBy,By,meanandBz,Bz,meanwere eval-uated during the steady state before the dipolarization occurs.
2. Strong (diamagnetic) currents on the dipolarization front can generate enough disturbance thatBz can be-come negative durring the event.
3. A negativeBz,minundershoot can also arise from mag-netic flux passing over the SC.
−60 −40 −20 0 20 40 60 −10
0 10 20 30 40 50 60 70
A: Median and Quartil of the Bz in 2001 − 2007
Bz
[nT]
Time [s]
−600 −40 −20 0 20 40 60
1 2 3 4 5 6 7 8 9
B: Correlation of Vxy and Bz in 2001 − 2007
B z
[nT]
Time [s] 400km/s > V
xy,max 60
400km/s < Vxy,max 47
Fig. 3.The left figure shows theBzof the 107 dipolarization events (black line) and the median over these events (red line). The green lines
are the upper and lower quartile of the median ofBz. The right figure shows the relation between the maximum perpendicular plasma flow
velocity in XY plane and the median of the superposedBzfor the 107 events. From these 107 events 60 events had a maximum velocity in
horizontal XY planeV⊥,xy<400 km s−1and 47 events a maximum velocityV⊥,xy>400 km s−1during the dipolarization.
0 2 4 6 8 10 12 14
0 2 4 6 8 10 12 14
Bz,mean |B y,mean
|
38 events with neg. Bz,min
Fig. 4. The relation between the mean of the magnetic field in y-direction,|By,mean|and z-direction,Bz,meanof the 38
dipolariza-tion events with a negativeBz,min(black circles). The mean
magni-tudes are evaluated during the steady state before the dipolarization is about to occur.
4 Multi-satellite observations
With the Cluster quartet it is possible to obtain time series at different locations, which can be used to distinguish between the temporal and spatial behavior of the magnetic fields (see e.g. Paschmann and Daly, 1998; Volwerk, 2006). Harvey (1998) showed a simple method to obtain the normal velocity of a plane boundary passing by the Cluster spacecraft, the so
called timing-method. Using the spatial configuration of the Cluster spacecraft, one can e.g. cross-correlate the magnetic field data between the spacecraft to obtain the normal veloc-ity of the magnetic structure from which the thickness of the boundary can be inferred.
The timing-method is very sensitive to the resolution of the data. Hence we used 5-Hz resolution data for all 107 dipo-larization events which were identified with the 4-s dataset. The high-resolution data are lowpass-filtered to smooth the data and to conserve the profile of the 4-s resolution mag-netic field data. The best results was obtained by the use of a lowpass with a cutoff frequency offcut−off=2 Hz. In-deed the profile of the high-resolution magnetic field data had roughly the same profile as the spin resolution magnetic field data, which means that the “high” frequency noise cannot influence the deformation ofBz,minandBz,max.
0 1 2 3 4 5 6 7 8 0
0.1 0.2 0.3 0.4 0.5 0.6 0.7
boundary size rp,gyro
normalized counts
A: Histogram: boundary size − proton gyroradius
α < 90°
α > 90°
0 1 2 3 4 5 6 7 8
0 0.1 0.2 0.3 0.4 0.5
boundary size inertial length
normalized counts
B: Histogram: boundary size − inertial length
α < 90°
α > 90°
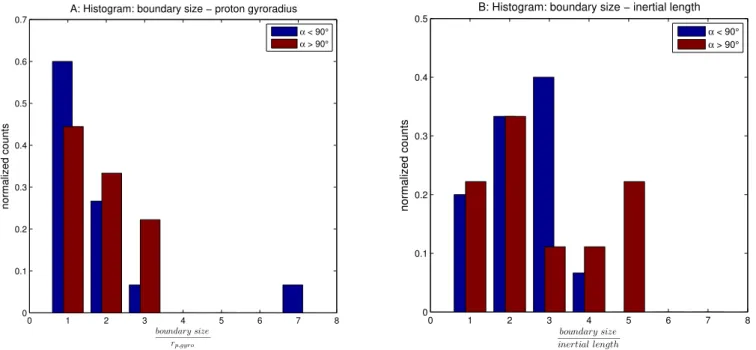
Fig. 5. The left panel (panelA) shows the histogram of the boundary size normalized by the proton gyro radius of the 24 dipolarization events and the right panel (panelB) shows the the histogram of the boundary size normalized by the ion inertial length. 15 events have an angleα <90◦(marked blue), and 9 events have an angleα >90◦(marked red). The vertical axis in both plots shows the counts normalized with the total number of events of each group.
The two estimated timing velocities (Vtiming,min and Vtiming,max) are compared and only events with a veloc-ity difference smaller than 25 % are selected, which we will call “steady” dipolarizations. For further analysis the average of these timing velocities (Vtiming=(Vtiming,min+ Vtiming,max)/2) was obtained. From the 107 events 66 re-mained. Another 42 events had a different profile among the four spacecraft based on visual examination ofBz. This in-dicates that there are, indeed, both temporal and spatial vari-ations in the structures associated with the dipolarizvari-ations. Therefore, for only 24 events “steady” structure timing ve-locity could be found. We also obtained the angleαbetween the estimated normal velocity of the magnetic structure and the maximum perpendicular plasma flow in XY plane within the 3-min-long time window. From the 24 events 15 events have an angle α <90◦ (marked by stars in Fig. 6) and 9
events have an angleα >90◦(marked by triangles in Fig. 6).
The estimated angle for the event from 29 August 2003 (Fig. 2a) isα≈30◦and from the event on 1 October 2003
(Fig. 2b)α≈150◦. We will discuss the difference between
these two flow directions in the discussion section. However, in the following we examine these 24 “steady” dipolarization events.
4.1 Thickness
The result of the timing-method for the 24 “steady” dipo-larization events confirmed the assumption that the temporal duration of the dipolarization is anti-correlated with the
hor-izontal perpendiclular earthward plasma flow velocityV⊥,xy as shown in Fig. 3. However, there is no systematic be-haviour between the thickness of the magnetic boundaryδD and theV⊥,xy.δDwas obtained from the time difference be-tween the minimum ofBz (ttiming,min) and the maximum of Bz (ttiming,max), and the estimated average normal velocity of the magnetic structure from the timing-method (Vtiming): δD=(ttiming,max−ttiming,min)Vtiming. Like in Sect. 3.2 we split the data into 2 bins based on the maximumV⊥,xy: 150– 400 km s−1 and >400 km s−1. From the 24 dipolarization events 11 events have a maximumV⊥,xy<400 km s−1 and 13 events have a maximum V⊥,xy>400 km s−1. The ob-tained average thickness δD of the dipolarization front is
∼460±350 km and∼430±350 km respectively. So the av-erage size of the boundary (∼450±350 km) seems to be in-dependent of the plasma flow velocity and on the order of the evaluated average proton gyro radius of∼590±150 km. We also estimated the inertial length of the protons in the mag-netic structure: lint=ωp/c≈228pNpkm, whereωp is the plasma frequency,Npis the proton density in cm−3. In ad-diton the relationship between the estimated boundary size and the observed distance from Earth were considered, but no clear correlation was found. Also between the temporal duration of the dipolarization and the observed distance from Earth no clear pattern is found.
Vxy,plasma[km/s]
bo
u
n
d
a
r
y
si
z
e
in
er
ti
a
l
le
n
g
th
0 200 400 600 800 1000 1200
0 0.5 1 1.5 2 2.5 3 3.5 4 4.5 5
α < 90°
α > 90°
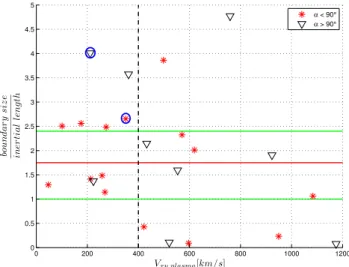
Fig. 6.Ratio of the estimated boundary size of the magnetic struc-ture and the inertial length of the protons in the magnetic strucstruc-ture for the evaluated 24 events. αis the angle between the estimated normal velocity of the magnetic structure and the maximum per-pendicular plasma flow in XY plane. The 15 dipolarization events with an angleα <90◦ are marked by stars. The 9 dipolarization events with an angleα >90◦are marked by triangles. The vertical doted line indicate the 2 velocity bins. The horizontal line is the median of the ratio boundary size and inertial length of the 24 dipo-larization events and is about∼1.8. The horizontal green lines are the upper and lower quartiles of the median. The event from 8 Au-gust 2003 is the star, marked by a circle. The event from 1 October 2003 is the triangle, marked by a circle.
length. From the 24 dipolarization events 15 events have an angle α <90◦ (marked blue), and 9 events have an angle
α >90◦ (marked red). Since the total number of events of
these two groups is quite different, the vertical axis in both plots has been normalized with the total number of events. For most of the events the estimated thickness of the front is between 1–3 proton gyro radius and independent ofα. On the other hand the front thickness for most of the events with α <90◦is less than 3 ion inertial lengths and for the events
withα >90◦no significant information can be obtained.
In Fig. 6 the estimated thicknesses of the dipolarization fronts are scaled to the plasma inertial length. For the 15 events with an angleα <90◦, the ratioδ
D/ lintis not exceed-ing a factor of 4. The median of the ratio of these 15 events is∼1.5. For the 9 events with an angleα >90◦three events
have a much higherδD/ lintratio but do not exceed a factor of 5. The median of the ratio for these 9 events is∼1.9. The dashed vertical line is the boundary between the two veloc-ity bins. The horizontal red line is the median of the ratio δD/ lintof all 24 dipolarization events and is∼1.8. The hor-izontal green lines are the upper and lower quartiles (∼2.5 and∼1.0). The circles mark the two events from Fig. 2. The event from 29 August 2003 has a magnetic boundary size of
∼970±240 km, a inertial length of∼370±60 km and hence
0 100 200 300 400 500
0 50 100 150 200 250 300 350 400 450 500
! V n [km/s]
!
V t
[km/s]
! V
t−! Vn with respect to the dipolarization front
Fig. 7.Relationship between the perpendicular plasma velocity, the estimated timing velocity of the 24 dipolarization events. First we
obtained the mean average perpendicular plasma velocityV⊥
dur-ing the dipolarization (betweenBz,minandBz,max). Then the
ve-locity difference between the estimated mean plasma veve-locity and the estimated timing velocityVtimingwas determined. Then the ve-locity difference was projected onto the timing veve-locity vector and the parallel1Vtand perpendicular components1Vnwere evaluated
and plotted.
a factor of∼2.5. The event from 1 October 2003 has a mag-netic boundary size of∼1060±270 km, an inertial length of
∼260±60 km and hence a factor of∼4 (see Fig. 6). Since past studies used the plasma flow velocity in single spacecraft observations to estimate such boundary size (e.g. Runov et al., 2009), a scattered plot of the relationship be-tween the perpendicular plasma velocity, the estimated tim-ing velocity of the 24 events is given in Fig. 7. First we ob-tained the mean average perpendicular plasma velocity V⊥
during the dipolarization (betweenBz,minandBz,max). Then the velocity difference between the estimated mean plasma velocity and the estimated timing velocityVtimingwas deter-mined. Then the velocity difference was projected onto the timing velocity vector and the parallel1Vtand perpendicu-lar components1Vnwere evaluated and plotted. It is often assumed that the dipolarization is a tangential dicontinuity (see e.g. Sergeev et al., 1996), which would mean that1V mainly have tangential component, which is indeed the case for most of the events.
5 Dipolarization-associated currents
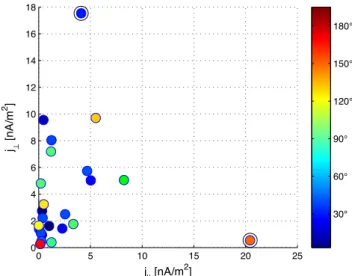
0 5 10 15 20 25 0
2 4 6 8 10 12 14 16 18
j
|| [nA/m
2]
j !
[nA/m
2 ]
30° 60° 90° 120° 150° 180°
Fig. 8. Scatter plot between the estimatedj⊥andj||, each calcu-lated atBz,min, with a color scale showing the angleαof the 24 dipolarization events. The event from 29 August 2003 is the blue dot (α≈30◦) marked by a black circle and the event from 1 October 2003 is the orange dot (α≈150◦) marked by a black circle.
scales. Using the curlometer technique (Harvey, 1998) we can deduce the currents from the magnetic fields measured by Cluster.
Figure 2 (left panel) shows the magnetic field data (pan-els d–f) for 29 August 2003, where the separation of the spacecraft was∼500 km, and the components of the current are shown too (panels h–j), with the perpendicular part (with respect to the magnetic field at the barycenter of the four spacecraft) shown as a filled region under the curve. On the small scale it can be seen that there is strong perpendicular current in the the x- and y-direction after the minimim inBz, and basically in the dipolarization front. This current is re-sponsible for the decrease inBzpreceding the dipolarization front. The estimated thickness of the dipolarization front is δD≈970 km (or∼2.5 intertial lengths). This means that we are sampling the current on a scale smaller than the structure itself and at near the inertial length.
There is a plasma pressure drop over the dipolarization front from Ppl≈0.4 nPa before to Ppl≈0.2 nPa after the dipolarization front has passed (not shown). This pressure gradient can drive a diamagnetic current through:
jdia=B× ∇⊥P⊥
B2 . (1)
We can estitmate the diamagnetic current assuming:
∇⊥p⊥ ≈ 1Ppl/δD along the front normal (see e.g. Runov et al., 2011a; Zhang et al., 2011); the nor-mal of the front is determined by timing analysis n≈
(0.13,−0.71,0.68); the magnetic field at dipolarization max-imumB≈(−2,5,14)nT. Using Eq. (1) we find for the dia-magnetic currentjdia≈(11,3,1)nA m−2. This is in the right
direction, as can be seen in Fig. 2a, however, the result is off by a factor of∼2.
Similarly, we investigate the dipolarization for 1 October 2003, shown in Fig. 2b. This event shows a much slower dipolarization over ∼12 s, with a plasma velocity mainly from the z-direction to the y-direction and a timing veloc-ityVtiming≈(−48,−65,55)km s−1, i.e. in the tailward di-rection, corresponding to a physical size of∼1070 km. The magnetic field at theBz peak isB≈(−2,2,4)nT. The as-sociated diamagnetic current in this case would be jdia= (44,−10,28)nA m−2much higher than measured. However, this is a different kind of diplarization as in the previous event asα >90◦. We will investigate this further in the discussion
section.
For each of the 24 events we have used the curlome-ter technique to estimate the current. We have then decurlome-ter- deter-mined the current parallel and perpendicular to the magnetic field and have produced a scatter plot j|| and j⊥, taken at
the dipolarization front. In Fig. 8 the scatter plot between the estimatedj⊥ andj||, each calculated at the front, with
a color scale showing the angle α is shown. The event from 29 August 2003 is the blue dot (α≈30◦) marked by
a black circle and the event from 1 October 2003 is the or-ange dot (α≈150◦) marked by a black circle. This shows
that the main current on the dipolarization front is perpen-dicular to the magnetic field and there seems to be no corre-lation withα. Interestingly the 1 October 2003 event shows a strong deviation from the main characteristic of the rest of the currents.
In a recent paper, Runov et al. (2011b) discussed the re-sults of a superposed epoch analysis of dipolarization fronts observed from THEMIS. It was found that the current den-sites associated with theBzincrease are on average 5-7 times larger than the current density in the crosstail. This is in good agreement with our results since the estimatedj⊥for half of
the events is greater than 4 nA m−2and therefore greater than the nominal crosstail current.
6 Summary and discussion
In this paper we studied dipolarization fronts observed by the Cluster satellite at−20RE≤XGSM≤ −10REand|YGSM| ≤ 12RE. Our event selection is based on the perpendicular Earthward plasma flow velocity in x-directionV⊥x, the el-evation angleθ, and it also requires that the spacecraft is in the plasma sheet close to the neutral sheet.
Superposed epoch analysis was performed to examine the duration of the dipolarization front based on 107 dipolariza-tion events. Utilizing high resoludipolariza-tion data from all four Clus-ter spacecraft, we also evaluated the thickness of the dipo-larization based on the four spacecraft timing velocity for 24 diplarization events.
1. The duration of the dipolarization front is found to show a tendency to decrease with increasing velocity of the plasma flow.
2. The thickness of the dipolarization front, is found to be independent of the plasma flow velocity and is on aver-age∼450±350 km.
3. The average size of the dipolarization front is in the or-der of the evaluated ion gyro radius of∼590±150 km. 4. The estimated average inertial length of the ions in the magnetic structure is∼340±60 km and hence corre-sponds to the size of the dipolarization front with a fac-tor of∼1.8.
5. The angle between the Earthward plasma flow direction and dipolarization front motion can either be smaller or greater than 90◦, distinguishing between flux transport
and flux pile up events.
6. The dipolarization fronts tend to be tangential disconti-nuities.
7. The currents flowing on the fronts have mainly a per-pendicular component to the magnetic field.
The average size for the thickness of the dipolarization front, 450 km, just below the average ion gyro radius and just above the ion inertial length, agrees well with estimates made for case studies by various other authors: Apatenkov et al. (2007) showed a thickness of 400–500 km, whereas Runov et al. (2009) found that the thickness was on the order of the ion inertial length. However, Nakamura et al. (2002) showed a thickness of 2000 km for one event. The variation in thick-ness of the events in this paper vary between 0.2 and 4 ion inertial lengths, and it may well be that it depends on parame-ters that have not yet been taken into account, e.g. the current sheet composition and the current sheet thickness.
Two dipolarization events (out of the 24) were looked at in more detail. These events showed that for one, the Earthward moving dipolarization withα≈30◦, the magnetic structure
could be well described by the diamagnetic currents flow-ing on the front. However, for the other event, with tailward moving dipolarization atα≈150◦, the estimated
diamag-netic current did not fit the data. Indeed the current during this dipolarization is more parallel than perpendicular to the magnetic field. This seems to be a special case in the 24 events that were looked at, as all other events much smaller parallel currents.
The dipolarizations in this study can be divided into two groups, according to the angle between the plasma flow di-rection and the magnetic field motion didi-rection, with the an-gleαeither smaller or larger than 90◦. There is the expected
category, in which the plasma and the magnetic field move in the same direction, and the dipolarization that is observed comes from the relaxation of the magnetic tension in the
stretched field lines as they move Earthward. These dipo-larizations occur when there is unimpeded flow.
The other category is when the plasma flow is Earthward but the dipolarization motion is tailward. This means that there is a pileup of the magnetic field in the tail. One would expect that the plasma flow would be deflected by the barrier which causes the pileup. Indeed, in the event on 1 October 2003 (see Fig. 2b) shows that the plasma flow is indeed de-flected towards the dawn side of the tail (largeVy).
The diamagnetic current that was found for the 29 Au-gust event (see Fig. 2a), was in good agreement with theory, and it flows over an interval of∼4 s, which corresponds to a physical size of∼1000 km, just over 2 times the ion in-ertial length (see Fig. 6). Zhou et al. (2009) found that the thickness of the current layer was just below one ion iner-tial length, however, their event happened much closer to the Earth atX≥ −10RE, where the conditions may be different because of the more dipolar like magnetic field structure.
Further investigation of these structures is necessary and planned to investigate the dependences of the thickness of the dipolarization on various parameters in the Earth’s mag-netotail and to study the large scale development of these structures in the tail and their possible role in the braking of the associated flow.
Acknowledgements. We would like to acknowledge the Cluster Sci-ence Data System (CSDS) and the Cluster Active Archive (CAA).
Guest Editor A. Masson thanks two anonymous referees for their help in evaluating this paper.
References
Angelopoulos, V.: The THEMIS mission, Space Sci. Rev., 141, 5– 34, 2002.
Angelopoulos, V., Baumjohann, W., Kennel, C. F., Coroniti, R. V., Kivelson, M. G., Pellat, R., Walker, R. J., L¨uhr, H., and Paschmann, G.: Bursty bulk flows in the inner central plasma sheet, J. Geophys. Res., 97, 4027–4039, 1992.
Angelopoulos, V., Kennel, C. F., Coroniti, F. V., Pellat, R., Kivel-son, M. G., Walker, R. J., Russell, C. T., Baumjohann, W., Feldman, W. C., and Gosling, J. T.: Statistical characteristics of bursty bulk flow events, J. Geophys. Res., 99, 21257–21280, 1994.
Apatenkov, S. V., Sergeev, V. A., Kubyshkina, M. V., Nakamura, R., Baumjohann, W., Runov, A., Alexeev, I., Fazakerley, A., Frey, H., Muhlbachler, S., Daly, P. W., Sauvaud, J.-A., Ganushk-ina, N., Pulkkinen, T., Reeves, G. D., and Khotyaintsev, Y.: Multi-spacecraft observation of plasma dipolarization/injection in the inner magnetosphere, Ann. Geophys., 25, 801–814, doi:10.5194/angeo-25-801-2007, 2007.
Baumjohann, W., Paschmann, G., and L¨uhr, H.: Characteristics of high-speed flows in the plasma sheet, J. Geophys. Res., 95, 3801–3809, 1990.
Baumjohann, W., Hesse, M., Kokubun, S., Mukai, T., Nagai, T., and Petrukovich, A. A.: Substorm dipolarization and recovery, J. Geophys. Res., 104, 24995–25000, 1999.
Baumjohann, W., Sch¨odel, R., and Nakamura, R.: Bursts of fast magnetotail flux transport, Adv. Space Res., 30, 2241–2246, 2002.
Dubyagin, S., Sergeev, V., Apatenkov, S., Angelopoulos, V., Runov, A., Nakamura, R., Baumjohann, W., McFadden, J., and Larson, D.: Can flow bursts penetrate into the inner magnetosphere?, Geophys. Res. Lett., 38, L08102, doi:10.1029/2011GL047016, 2011.
Harvey, C. C.: Spatial gradients and volumetric tensor, in: Analysis Methods for Multi-Spacecraft Data, edited by: Paschmann, G. and Daly, P., pp. 307–322, ESA, Noordwijk, 1998.
Kiehas, S. A., Semenow, V. S., Kubyshkina, M., Angelopoulos, V., Nakamura, R., Keika, K., Ivanova, V. V., Biernat, H. K., Baumjo-hann, W., Mende, S., Magnes, W., Auster, U., Fornacon, K. H., Larson, D., Carlson, C. W., Bonnell, J., and McFadden, J.: First application of a Petschek-type reconnection model with time-varying reconnection rate to THEMIS observations, J. Geophys. Res., 114, A00C20, doi:10.1029/2008JA013528, 2009. Li, S., Angelopoulos, V., Runov, A., X.-Z-Zhou, McFadden, J.,
Lar-son, D., Bonnell, J., and Auster, U.: On the force balance around dipolarization fronts within bursty bulk flows, J. Geophys. Res., 116, A00I35, doi:10.1029/2010JA015884, 2011.
Lui, A. T. Y., Volwerk, M., Dunlop, M. W., Alexeev, I. V., Faza-kerley, A. N., Walsh, A. P., Lester, M., Grocott, A., Mouikis, C., Henderson, M. G., Kistler, L. M., Shen, C., Shi, J. K., Zhang, T. L., and R`eme, H.: Near-Earth substorm features from multiple satellite observations, J. Geophys. Res., 113, A07S26, doi:10.1029/2007JA012738, 2008.
Nakai, H. and Kamide, Y.: Substorm currents associated with mag-netotail magnetic dipolarization: Geotail observations, J. Geo-phys. Res., 105, 18781–18792, 2000.
Nakamura, R., Baumjohann, W., Klecker, B., Bogdanova, Y., Balogh, A., R`eme, H., Bosqued, J. M., Dandouras, I., Sauvaud, J.-A., Glassmeier, K.-H., Kistler, L., Mouikis, C., Zhang, T. L., Eichelberger, H., and Runov, A.: Motion of the dipolarization front during a flow burst event observed by Cluster, Geophys. Res. Lett., 29, 1942, doi:10.1029/2002GL015763, 2002. Nakamura, R., Baumjohann, W., Mouikis, C., Kistler, L. M., Runov,
A., Volwerk, M., Asano, Y., V¨or¨os, Z., Zhang, T. L., Klecker, B., R`eme, H., and Balogh, A.: Spatial scale of high-speed flows in the plasma sheet observed by Cluster, Geophys. Res. Lett., 31, L09894, doi:10.1029/2004GL019558, 2004.
Ohtani, S., Shay, M. A., and Mukai, T.: Temporal structure of the fast convective flow in the plasma sheet: Comparison between observations and two-fluid simulations, J. Geophys. Res., 109, 3–8, doi:10.1029/2003JA010002, 2004.
Paschmann, G. and Daly, P.: Analysis Methods for
Multi-Spacecraft Data, ESA, Noordwijk, 1998.
R`eme, H., Aoustin, C., Bosqued, J. M., Dandouras, I., Lavraud, B., Sauvaud, J. A., Barthe, A., Bouyssou, J., Camus, Th., Coeur-Joly, O., Cros, A., Cuvilo, J., Ducay, F., Garbarowitz, Y., Medale, J. L., Penou, E., Perrier, H., Romefort, D., Rouzaud, J., Vallat, C., Alcayd´e, D., Jacquey, C., Mazelle, C., d’Uston, C., M¨obius, E.,
Kistler, L. M., Crocker, K., Granoff, M., Mouikis, C., Popecki, M., Vosbury, M., Klecker, B., Hovestadt, D., Kucharek, H., Kuenneth, E., Paschmann, G., Scholer, M., Sckopke, N., Seiden-schwang, E., Carlson, C. W., Curtis, D. W., Ingraham, C., Lin, R. P., McFadden, J. P., Parks, G. K., Phan, T., Formisano, V., Amata, E., Bavassano-Cattaneo, M. B., Baldetti, P., Bruno, R., Chion-chio, G., Di Lellis, A., Marcucci, M. F., Pallocchia, G., Korth, A., Daly, P. W., Graeve, B., Rosenbauer, H., Vasyliunas, V., Mc-Carthy, M., Wilber, M., Eliasson, L., Lundin, R., Olsen, S., Shel-ley, E. G., Fuselier, S., Ghielmetti, A. G., Lennartsson, W., Es-coubet, C. P., Balsiger, H., Friedel, R., Cao, J.-B., Kovrazhkin, R. A., Papamastorakis, I., Pellat, R., Scudder, J., and Sonnerup, B.: First multispacecraft ion measurements in and near the Earth’s magnetosphere with the identical Cluster ion spectrometry (CIS) experiment, Ann. Geophys., 19, 1303–1354, doi:10.5194/angeo-19-1303-2001, 2001.
Runov, A., Angelopoulos, V., Sitnov, M. I., Sergeev, V. A., Bonnell, J., McFadden, J. P., Larson, D., Glassmeier, K.-H., and Auster, U.: THEMIS observations of an earthward-propagating dipolarization front, Geophys. Res. Lett., 36, L14106, doi:10.1029/2009GL038980, 2009.
Runov, A., Angelopoulos, V., Sitnov, M., Sergeev, V., Nakamura, R., Nishimura, Y., Frey, H., McFadden, J., Larson, D., Bonnell, J., Glassmeier, K.-H., Auster, U., Connors, M., Russell, C., and Singer, H.: Dipolarization fronts in the magnetotail plasma sheet, Planet. Space Sci., 59, 517–525, doi:10.1016/j.pss.2010.06.006, 2011a.
Runov, A., Angelopoulos, V., Zhou, X.-Z., Zhang, X.-J., Li, S., Plaschke, F., and Bonnell, J.: A THEMIS multicase study of dipolarization fronts in the magnetotail plasma sheet, J. Geophys. Res., 116, A05216, doi:10.1029/2010JA016316, 2011b. Sergeev, V. A., Angelopoulos, V., Gosling, J. T., Cattell, C. A., and
Russell, C. T.: Detection of localized, plasma-depleted flux tubes or bubbles in the midtail plasma sheet, J. Geophys. Res., 101, 10817–10826, 1996.
Sigsbee, K., Slavin, J. A., Lepping, R. P., Szabo, A., Øieroset, M., Kaiser, M. L., Reiner, M. J., and Singer, H. J.: Statisti-cal and superposed epoch study of dipolarization events using data from Wind perigee passes, Ann. Geophys., 23, 831–851, doi:10.5194/angeo-23-831-2005, 2005.
Takada, T., Nakamura, R., Baumjohann, W., Asano, Y., Volwerk, M., Zhang, T. L., Klecker, B., R`eme, H., Lucek, E. A., and Carr, C.: Do BBFs contribute to inner magnetosphere dipolarizations: Concurrent Cluster and Double Star observations, Geophys. Res. Lett., 33, L21109, doi:10.1029/2006GL027440, 2006.
Volwerk, M.: Multi-Satellite observations of ULF waves, in: Mag-netospheric ULF waves: Synthesis and new directions, edited by: Takahashi, K., Chi, P. J., Denton, R. E., and Lysak, R. L., pp. 109–135, AGU, Washingtong, 2006.
Volwerk, M., Lui, A. T. Y., Lester, M., Walsh, A. P., Alexeev, I., Cao, X., Dunlop, M. W., Fazakerley, A. N., Grocott, A., Kistler, L., Lun, X., Mouikis, C., Pu, Z., Shen, C., Shi, J. K., Taylor, M. G. G. T., Baumjohann, W., Nakamura, R., Runov, A., V¨or¨os, Z., Zhang, T. L., Takada, T., R`eme, H., Klecker, B., and Carr, C. M.: Magnetotail dipolarization and associated current sys-tems observed by Cluster and Double Star, J. Geophys. Res., 113, A08S90, doi:10.1029/2007JA012729, 2008.
Current-carriers near dipolarization fronts in the magnetotail: A THEMIS event study, J. Geophys. Res., 116, A00I20, doi:10.1029/2010JA015885, 2011.