www.atmos-chem-phys.net/15/2489/2015/ doi:10.5194/acp-15-2489-2015
© Author(s) 2015. CC Attribution 3.0 License.
A comprehensive laboratory study on the immersion freezing
behavior of illite NX particles: a comparison of 17 ice nucleation
measurement techniques
N. Hiranuma1, S. Augustin-Bauditz2, H. Bingemer3, C. Budke4, J. Curtius3, A. Danielczok3, K. Diehl5,
K. Dreischmeier4, M. Ebert6, F. Frank3, N. Hoffmann1, K. Kandler6, A. Kiselev1, T. Koop4, T. Leisner1, O. Möhler1, B. Nillius3,*, A. Peckhaus1, D. Rose3, S. Weinbruch6, H. Wex2, Y. Boose7, P. J. DeMott8, J. D. Hader9, T. C. J. Hill8, Z. A. Kanji7, G. Kulkarni10, E. J. T. Levin8, C. S. McCluskey8, M. Murakami11, B. J. Murray12, D. Niedermeier2,**, M. D. Petters9, D. O’Sullivan12, A. Saito11, G. P. Schill13, T. Tajiri11, M. A. Tolbert13, A. Welti7, T. F. Whale12, T. P. Wright9, and K. Yamashita11,***
1Institute for Meteorology and Climate Research – Atmospheric Aerosol Research,
Karlsruhe Institute of Technology, Karlsruhe, Germany
2Leibniz Institute for Tropospheric Research, Leipzig, Germany
3Institute for Atmospheric and Environmental Science, Goethe University of Frankfurt, Frankfurt, Germany 4Faculty of Chemistry, Bielefeld University, Bielefeld, Germany
5Institute for Atmospheric Physics, University of Mainz, Mainz, Germany
6Institute of Applied Geosciences, Technical University Darmstadt, Darmstadt, Germany 7Institute for Atmosphere and Climate Science, ETH, Zurich, Switzerland
8Department of Atmospheric Science, Colorado State University, Fort Collins, CO, USA
9Department of Marine Earth and Atmospheric Sciences, North Carolina State University, Raleigh, NC, USA 10Atmospheric Science and Global Change Division, Pacific Northwest National Laboratory, Richland, WA, USA 11Meteorological Research Institute (MRI), Tsukuba, Japan
12Institute for Climate and Atmospheric Science, School of Earth and Environment, University of Leeds, Leeds, UK 13Cooperative Institute for Research in Environmental Sciences and Department of Chemistry and Biochemistry,
University of Colorado, Boulder, CO, USA
*now at: Max-Planck-Institut für Chemie, Mainz, Germany
**now at: Department of Physics, Michigan Technological University, Houghton, MI, USA ***now at: Snow and Ice Research Center, Nagaoka, Japan
Correspondence to:N. Hiranuma ([email protected])
Received: 19 August 2014 – Published in Atmos. Chem. Phys. Discuss.: 28 August 2014 Revised: 24 December 2014 – Accepted: 27 January 2015 – Published: 6 March 2015
Abstract. Immersion freezing is the most relevant hetero-geneous ice nucleation mechanism through which ice crys-tals are formed in mixed-phase clouds. In recent years, an in-creasing number of laboratory experiments utilizing a variety of instruments have examined immersion freezing activity of atmospherically relevant ice-nucleating particles. However, an intercomparison of these laboratory results is a difficult task because investigators have used different ice nucleation (IN) measurement methods to produce these results. A
re-maining challenge is to explore the sensitivity and accuracy of these techniques and to understand how the IN results are potentially influenced or biased by experimental parameters associated with these techniques.
IN data as a function of particle concentration, temperature (T ), cooling rate and nucleation time. A total of 17 measure-ment methods were involved in the data intercomparison. Ex-periments with seven instruments started with the test sam-ple pre-suspended in water before cooling, while 10 other instruments employed water vapor condensation onto dry-dispersed particles followed by immersion freezing. The re-sulting comprehensive immersion freezing data set was eval-uated using the ice nucleation active surface-site density,ns,
to develop a representativens(T )spectrum that spans a wide
temperature range (−37◦C <T<−11◦C) and covers 9 or-ders of magnitude inns.
In general, the 17 immersion freezing measurement tech-niques deviate, within a range of about 8◦C in terms of tem-perature, by 3 orders of magnitude with respect tons. In
ad-dition, we show evidence that the immersion freezing effi-ciency expressed inns of illite NX particles is relatively
in-dependent of droplet size, particle mass in suspension, par-ticle size and cooling rate during freezing. A strong tem-perature dependence and weak time and size dependence of the immersion freezing efficiency of illite-rich clay mineral particles enabled the ns parameterization solely as a
func-tion of temperature. We also characterized the ns(T )
spec-tra and identified a section with a steep slope between−20 and−27◦C, where a large fraction of active sites of our test dust may trigger immersion freezing. This slope was fol-lowed by a region with a gentler slope at temperatures below
−27◦C. While the agreement between different instruments was reasonable below∼ −27◦C, there seemed to be a differ-ent trend in the temperature-dependdiffer-ent ice nucleation activ-ity from the suspension and dry-dispersed particle measure-ments for this mineral dust, in particular at higher tempera-tures. For instance, the ice nucleation activity expressed in nswas smaller for the average of the wet suspended samples
and higher for the average of the dry-dispersed aerosol sam-ples between about−27 and−18◦C. Only instruments mak-ing measurements with wet suspended samples were able to measure ice nucleation above −18◦C. A possible explana-tion for the deviaexplana-tion between−27 and−18◦C is discussed. Multiple exponential distribution fits in both linear and log space for both specific surface area-basedns(T )and
geomet-ric surface area-based ns(T ) are provided. These new fits,
constrained by using identical reference samples, will help to compare IN measurement methods that are not included in the present study and IN data from future IN instruments.
1 Introduction 1.1 Background
Primary ice formation by atmospheric ice-nucleating parti-cles (INPs) markedly influences the formation and life cycle of mixed-phase clouds and very often also initiates
precipita-tion formaprecipita-tion. Therefore, ice-containing clouds play a sig-nificant role in the energy balance of the climate system and the hydrological cycle on Earth (Chapter 7 of IPCC 2013; Boucher et al., 2013). Currently, quantitative predictions for the impact of these clouds on the Earth’s radiative budget and thereby the climate are highly uncertain. This uncertainty arises primarily from a lack of fundamental understanding of ice microphysical processes, the representation of these processes in cloud models and knowledge of the abundance of INPs (Hoose and Möhler, 2012; Murray et al., 2012). In particular, yearly emission rates of soil dust are 1000 to 4000 teragrams, accounting for a major proportion of both the dust component and the total particle loading in the atmo-sphere (Boucher et al., 2013). The resulting radiative forcing directly exerted by mineral dust is estimated to range from
−0.3 to+0.1 W m−2. Therefore, dust slightly contributes to
the direct cooling effect of aerosols. However, our under-standing of the influence of the dust burden upon overall cli-mate forcing, including its secondary effect on cloud albedo, remains highly uncertain, in part due to the absence of ac-curate INP representations in atmospheric models. Thus, the effective radiative forcing effect of airborne dust on current climate predictions remains unresolved.
A small subset of all particles acts as INPs across a range of subzero temperatures, triggering ice formation in clouds via the process of heterogeneous ice nucleation. Previous laboratory experiments have taken diverse approaches in an attempt to mimic ice nucleation and freezing processes. These heterogeneous ice formation processes include deposi-tion nucleadeposi-tion, immersion freezing, condensadeposi-tion freezing, and contact freezing (Vali, 1985), inside-out contact freezing (i.e., freezing of an immersed INP in contact with the droplet surface from the inside; Durant and Shaw, 2005; Fornea et al., 2009) and surface condensation freezing (i.e., freezing of supercooled water or residual aqueous solution trapped on particle surfaces, e.g., by the inverse Kelvin effect; Christen-son, 2013; Hiranuma et al., 2014a; Marcolli, 2014; Welti et al., 2014; Wex et al., 2014). Without INPs, pure cloud wa-ter droplets or solution within particles can be supercooled to below−37◦C before freezing (Koop et al., 2000; Murray et al., 2010; Rosenfeld and Woodley, 2000).
investigations and understanding of heterogeneous ice nu-cleation processes in supercooled clouds (as well as mixed-phase clouds) is of particular importance.
1.2 State of the art of IN measurement techniques The concept of condensation nuclei contributing to ice for-mation was first introduced by Alfred Wegener in 1911 (We-gener, 1911). Since then, various instruments and methods have been developed to investigate the composition of at-mospherically relevant INPs as well as their abundance; for example, the rapid expansion cloud-simulation chamber (RECC) was first introduced as a detector of ionizing par-ticles. Such instruments have been used in many ice nucle-ation studies since the 1940s (e.g., Cwilong, 1947; Fournier d’Albe, 1949; Palmer, 1949; Bigg, 1957; Kline and Brier, 1961). Supersaturated conditions with respect to water and ice, as a function of temperature, are created in the RECC vessel by a rapid pressure drop caused by mechanical ex-pansion and concomitant cooling. Subsequently, water vapor in the supersaturated air can either deposit or condense on sample particles, leading to the formation of water droplets and/or ice.
A different type of instrument widely used to measure abundance and efficiency of INPs is the continuous flow dif-fusion chamber (CFDC). The need for portable instruments capable of obtaining continuous measurements for aircraft applications emerged in discussions during the 1970s was a main driver of CFDC development. In CFDCs, particles are sampled into a region between two ice-coated concen-tric cylinders (or dual parallel plates) maintained at different temperatures, which generates a region of ice supersatura-tion between ice-coated walls. As the particles experience ice supersaturation conditions for a few seconds, INPs can be activated and diffusively grow to supermicron ice crys-tals. Typically, these large ice crystals can be detected and counted by an optical particle counter (OPC) downstream of the instrument while the chamber temperature and humid-ity conditions are continuously recorded. Since its first ap-pearance in the 1980s with horizontal parallel plates (Hus-sain and Saunders, 1984; Tomlinson and Fukuta, 1985), sev-eral new designs and operational principles have been intro-duced (e.g., vertically oriented cylinders; Rogers et al., 1988, horizontally oriented parallel plates; Kanji and Abbatt, 2009, vertically oriented parallel plates; Stetzer et al., 2008; Chou et al., 2011; Friedman et al., 2011). An alternative configu-ration is the continuous flow mixing chamber (e.g., Fast Ice Nucleus Chamber or FINCH; Bundke et al., 2008). The oper-ation principle of this type of chamber does not involve water vapor diffusion from the ice walls, as in CFDC, but water va-por is available for ice growth from the humidified air within the chamber flow. This leads to an upper limit on INP con-centrations that are observable with this methodology (De-Mott et al., 2011). A flow tube (e.g., Leipzig Aerosol Cloud Interaction Simulator or LACIS, Hartmann et al., 2011) has
also been developed in which a humidified stream contain-ing aerosol particles is first cooled to activate droplets on the particles, which upon further cooling may then freeze.
In addition to chamber techniques, the mode-specific con-ditions for heterogeneous ice nucleation of a known INP placed on a substrate surface have been studied using opti-cal microscope techniques. For example, by immersing ice nuclei in water droplets placed on a hydrophobic substrate surface and collecting a series of images at controlled cool-ing rates, the change in reflectivity and opacity followcool-ing ice formation can be characterized, and the associated freez-ing conditions can be identified (e.g., Knopf and Alpert, 2013; Murray et al., 2011). More recently, other optical mi-croscopy techniques coupled with a unique method of en-capsulating particles into droplets followed by cooling (Ian-none et al., 2011) or using the hydrophobic squalene/water emulsion (Wright and Petters, 2013) were introduced to the community. Using a similar approach, substrate-supported cooling studies have been applied to determine the freezing temperature in the contact mode (e.g., Fornea et al., 2009; Niehaus et al., 2014), or of deposition nucleation (e.g., Kanji and Abbatt, 2006; Bingemer et al., 2012; Dymarska et al., 2006). The microscopy-coupled substrate-supported freezing devices are advantageous for visualizing the consequences of specific ice nucleation modes in controlled and simulated environments. In some studies, immersion freezing of micro-liter scale droplet volumes was analyzed at temperatures (Ts) higher than−10◦C with a sensitivity of INP concentration as good as∼10−5L−1(Ardon-Dreyer et al., 2011).
The freezing temperature of INPs either immersed in or in contact with levitated supercooled water droplets suspended in the air can also be determined by the change in light scat-tering with a charge-coupled device (CCD) camera using an electrodynamic balance (EDB; Hoffmann et al., 2013), an acoustic levitator (Diehl et al., 2014) or in a vertical wind tun-nel (Szakáll et al., 2009). The advantage of these methods is the ability to provide, via high-resolution images, substrate-free information for statistically representative ice nucleation processes on a single droplet basis. This advantage is shared with all of the above-mentioned chamber and flow tube de-vices.
al., 2011; Riechers et al., 2013). A better understanding of the sensitivity of multiple techniques and the role of associ-ated experimental parameters upon INP measurements will also help in transferring the laboratory-based measurements of INPs of various atmospheric constituents to their reliable parameterizations in models of atmospheric processes.
Since the 1960s, four international workshops have been organized to compare the performance of IN measuring in-struments that were emerging or available at the time (De-Mott et al., 2011). In particular, effort was made during the fourth international ice nucleation workshop in 2007 (ICIS-2007) to assemble a total of nine laboratory and field IN in-struments at the AIDA (Aerosol Interaction and Dynamics in the Atmosphere) facility and compare them using identi-cal test dust samples (e.g., Arizona Test Dust, or ATD, and Saharan dust) over similar thermodynamic conditions. State-of-the-art knowledge was obtained from each workshop ac-tivity, and such measurement understanding was further in-corporated to develop the next generation of IN instruments. 1.3 Objectives
The major aim of this study, and concurrent studies within the framework of the INUIT (Ice Nuclei Research Unit) project, is to investigate the immersion freezing behavior of reference particles (e.g., Snomax for bacterial IN processes and potassium-rich feldspar, K-feldspar, for mineral dust IN processes). In this work, we distributed illite NX samples from the same batch [with the exceptions of the samples used for Leeds-NIPI, ZINC and IMCA-ZINC (acronyms are defined in the Supplement Sect. S4); Broadley et al., 2012; Welti et al., 2009] among the INUIT project and associated partners. With a total of 17 different IN measuring instru-ments, we intercompared IN data from each instrument in order to obtain a comprehensive data set for evaluating im-mersion freezing properties of illite NX particles. The data set captures the functional dependence of various experimen-tal parameter variables, such as particle concentration, parti-cle size, droplet size, temperature, cooling rate and nuparti-cle- nucle-ation time, on the immersion freezing properties of illite NX particles. Further, some instruments used test samples sus-pended in water prior to experiments, while others used dry-dispersed particles. The basic experimental methods and pa-rameterization approaches used to interpret the overall results and perform the intercomparison are discussed.
Results of freezing efficiencies at specific temperatures are presented using the ice nucleation active surface-site den-sity (ns)parameterization (e.g., Connolly et al., 2009;
Nie-mand et al., 2012; Hoose and Möhler, 2012) developed on the basis of suggestions by DeMott et al. (1995). For in-stance, Niemand et al. (2012) showed that the singular pa-rameterization approach of immersion freezing (i.e., freezing along water saturation conditions while cooling) of various desert dust particles derived from AIDA experiments con-verge upon one representative fit as a function of
tempera-ture, which is valid across a temperature range from−12 to
−36◦C. The time-independentn
s parameterization has also
been used in describing INP activation by several different constituents of clay minerals, e.g., microcline and kaolin-ite, using the cold stage droplet freezing technique (Atkin-son et al., 2013; Murray et al., 2010, 2011). Hence, compar-ison of IN efficiencies can be readily performed for multiple types of instruments usingns parameterizations. Moreover,
such time-independent and surface-area-scaledns
formula-tions can be further adapted to comprehensively assess ice nucleation in a wide range of atmospherically relevant tem-peratures and relative humidities with respect to ice (RHice),
as was recently presented in Hiranuma et al. (2014a). Thens
parameterization for both immersion freezing and deposition nucleation can be directly implemented in cloud, weather and climate models to calculate the temperature-dependent abun-dance of INPs as a function of the aerosol surface area con-centration.
2 Methods
2.1 Illite NX characterization
In this study, we have chosen illite NX (Arginotec, NX Nanopowder) as a surrogate for natural desert dusts. This choice of an illite-rich material is based on a comparison of its mineralogical composition to that of desert dusts, which are also rich in illite but are also mixed with a range of other minerals (Broadley et al., 2012). The present work gives an overview of laboratory experiments for immersion freezing of particles of illite NX, used as a surrogate for at-mospheric desert dust particles. Illite NX bulk powder was previously characterized for its physicochemical properties, such as mineralogy and specific surface area (SSA orθ for brevity). It was observed that illite NX samples contained more than 74 weight percent (wt %) illite (Broadley et al., 2012; Friedrich et al., 2008) along with other components [kaolinite, quartz, calcite and feldspars (most likely ortho-clase/sanidine), see Sect. 3.1 for more detail] which is simi-lar to the X-ray diffraction (XRD) data specified by the man-ufacturer. These test particles typically have aggregates of many nanometer-sized grains, yielding an order of magni-tude greater SSA (104.2 m2g−1; Broadley et al., 2012). The aspherical and elongated nature of illite NX particles (aspect ratio up to∼4.8; Veghte and Freedman, 2014) emphasizes the importance of considering its irregular shape. The manu-facturer reports the particle density, after mechanical granu-lation, as 2.65 g cm−3.
in-dividual particles. The illite NX particles were sampled di-rectly from the AIDA chamber using a 47 mm Nuclepore® filter (Whatman, 0.2 µm pore-size, filter Cat. No. 111106) and used in the EDX analysis.
The N2-adsorption-based SSA (or BET surface, Brunauer
et al., 1938) of the illite NX sample was also measured. BET is a gas adsorption technique where the quantity of various gases required to form a monolayer over the entire available surface of dry particles, including internal surfaces, is mea-sured (Gregg and Sing, 1982; Bickmore et al., 2002). From the knowledge of the size of a molecule on the surface, it is possible to determine the total surface area (Stotal). In this
work, BET surface areas were determined using two differ-ent gas adsorbates: N2and H2O (resulting inθN2 andθH2O), with the latter being the surface area exposed to water. BET measurements with H2O were limited to 28 % relative
hu-midity with respect to water (RHw)to correctly account for
a monolayer of H2O (Quantachrome Instruments, 2013).
The effect of particle processing, such as removal of hy-drophilic ions by water, in a water suspension was examined by ion chromatography (IC). The influence of dust wash-ing and discharge of soluble materials on IN propensity has been previously proposed (Welti et al., 2014). More specif-ically, the authors postulated two different scenarios at dif-ferent temperatures based on their observations. At tempera-tures below∼ −38◦C, the washed dust component may have enhanced water condensation below water saturation, and a formed liquid layer presumably may have stabilized the sub-critical ice embryo entrapped inside the liquid. The authors proposed this capillary condensation process as a part of con-densation freezing or homogeneous nucleation based on the previous observation (Christenson, 2013) and the theoretical framework (Marcolli, 2014). Above∼ −38◦C, on the other
hand, heterogeneous nucleation might have been suppressed because the liquid layer derived from the deliquescence of soluble impurities from individual particles may have dimin-ished accessibility of water vapor to active sites (e.g., local-ized surface features such as cracks and edges), originally proposed by Koehler et al. (2010), preventing the ice embryo formation. In this study, suspended samples were prepared by stirring illite NX powders (0.1 g in 10 mL of 18.2 Mcm nanopure water) over 3 weeks. IC (Dionex DX-500 IC Sys-tem equipped with Dionex CD20 Conductivity Detector) was used to determine the concentrations of washed out cations (K+, Ca2+and Mg2+)as a function of time. A weak
solu-tion of sulfuric acid [5 mL H2SO4 (96 wt %) diluted in 2 L
of Nanopure water] was used as the eluent. The measure-ments were conducted in three series: every 5 to 10 s (sec-onds) within the first 2 min (minutes) (ultra-short time se-ries, USTS), then every 10 min within the first hour after immersion (short time series, STS) followed by a long time series (LTS) with cation concentration measurements con-ducted every 2 days thereafter for a 3-week period.
2.2 Particle size distribution
Size distributions and the Stotal (in m2cm−3) of both
sus-pended and dry-dispersed illite NX particles were charac-terized using four size measurement techniques (i.e., aerosol size spectrometers and light scattering instruments). In par-ticular, the dynamic light scattering (DLS) size of suspended illite NX particles (0.05 to 1 mg bulk illite NX sample in 1 mL of double-distilled water) was determined using the StabiSizer® (Microtrac Europe GmbH, PMX 200CS) over the range of 0.0008 to 6.5 µm hydrodynamic diameter. A more detailed description of this instrument and its applica-tion for studying the size of particles in suspension are ad-dressed in Hiranuma et al. (2014b), and only a brief discus-sion is given here. The DLS measurements were carried out with negligible contribution of multiple scattering due to the utilized 180◦backscattering mode. The hydrodynamic
eter, which was comparable to the volume equivalent diam-eter, is determined using a refractive index of 1.55 to 1.58 for illite and of 1.333 for water, and a viscosity of water of 1.002 and 0.797 mPa s at 20 and 30◦C, respectively. From this metric, the surface area was calculated assuming spheri-cal particles.
Size distributions of dry polydisperse illite NX parti-cles were measured at AIDA controlled expansion cloud-simulation chamber (CECC) and Meteorological Research Institute (MRI) dynamic CECC (DCECC) prior to the expan-sion experiments. For AIDA-CECC, de-agglomerated illite NX particles from a rotating brush disperser (PALAS, RGB 1000) were passed through a series of inertial cyclone im-pactor stages (D50∼1 and 5 µm) and introduced to the 84 m3
volume AIDA vessel. Subsequently, a scanning mobility par-ticle sizer (SMPS, TSI Inc., Model 3081 differential mobil-ity analyzer, DMA, and Model 3010 condensation particle counter, CPC) and an aerodynamic particle sizer (APS, TSI Inc., Model 3321) were used to measure particle size distri-butions over the range of 0.01 to 15.4 µm volume equivalent diameter. The assumption of particle sphericity, a dynamic shape factor (DSF orχ in equations) of 1.49±0.12 (aver-age of 10 measurements±standard deviation) and a particle density of 2.65 g cm−3 were used to obtain the geometric-based (volume equivalent) diameter from an APS (Hiranuma et al., 2014b). At MRI-DCECC, a combination of an SMPS (TSI Inc., Model 3936) and a welas®optical particle counter (welas-OPC, PALAS, Sensor series 2500) was used to ac-quire a size distribution for the size range of 0.01 to 47.2 µm volume equivalent diameter directly from the 1.4 m3volume vessel. The same disperser type was used at both chambers for particle generation, and the upstream cyclone impactors (D50 ∼1 and 2.5 µm) were similarly deployed to filter out
di-ameter in several studies (Wagner et al., 2011; Hiranuma et al., 2014a).
The particle number size distribution of dry particles in the 0.3–10 µm diameter range was also measured by a TSI 3330 optical particle sizer (OPS, TSI Inc.; TSI-OPS hereafter). For particle generation, the illite NX sample was dispersed using a magnetic stirrer in a 100 mL glass vessel that was purged with 200 mL min−1of dry particle-free compressed laboratory air, and then diluted further in two stages by ap-proximately 1 : 100 with dry air. Subsequently, the backward scattering intensity of scattered light from a particle illumi-nated by a laser (λ=660 nm) was measured. The instrument estimated the particle size distribution, assuming spherical particles, using Mie theory. As a result, the reported size is a volume equivalent spherical diameter. Additionally, these dry-dispersed particles were used for the immersion mode experiments of FRIDGE as described in the supplementary methods.
2.3 Ice nucleation measurements
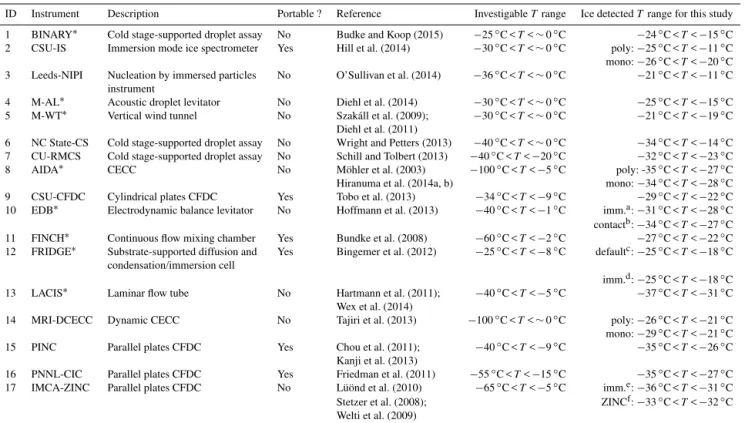
The ice nucleation measurement techniques contributing to this collaborative effort are listed in Table 1. Descriptions of each measurement technique and their acronyms are available in Sect. S4. Briefly, four CFDC-type instruments, one continuous flow mixing chamber, two cloud simula-tion chambers, one diffusion cell, two levitators, one vertical wind tunnel, one laminar flow tube and five cold stage-type systems were employed in the intercomparison. As seen in Table 1, measurement techniques with the first seven instru-ments (i.e., ID 1 to 7) and the immersion mode measure-ments of FRIDGE (ID 12) examined droplets produced from bulk illite NX samples in suspension, while the rest used dry-dispersed illite NX powder, sometimes followed by size se-lection with a DMA. Methods working with suspensions and those using dry particles employed different ways to deter-mine the particle surface area, and the influence of these dif-ferences on the determination ofnswas investigated. For
in-stance, CSU-IS was used to investigate the freezing activity of both bulk suspension and size-segregated particles in sus-pension. Two cloud expansion chambers, AIDA-CECC and MRI-DCECC, examined both polydisperse and size-selected dry illite NX particles. LACIS and IMCA-ZINC measured immersion freezing of droplets, where each droplet con-tained a single particle, and examined differently sized dry particles. The role of IN modes upon the estimation of ns
was also examined across various temperature ranges. The EDB-based method was used to measure the contact and im-mersion mode efficiencies of size segregated dry illite NX particles around −30◦C. Immersion freezing results from IMCA-ZINC were compared to previously reported ZINC data (Welti et al., 2009) at temperatures below −31◦C and to PINC data for temperatures below−26◦C. In the present study, we derived ZINC’snsvalues from the results reported
in Welti et al. (2009). Specifically, ice formation above 105 %
RHwup to the water drop survival line was used to calculate
ns based on given illite NX particle sizes. We note that the
latent heat of condensation has minimal impact on droplet temperature, such that RHw> 105 % maintains a water
su-persaturating condition for droplet freezing.
FRIDGE investigated ice nucleation of both dry-dispersed particles on a substrate at fixed temperatures (−25◦C <T<−18◦C) with increasing humidity (“default” deposition mode nucleation) as well as immersed parti-cles. In the case of immersion freezing experiments with suspended samples, the cell temperature was lowered by 1◦C min−1.
The range of mass concentrations of the bulk illite NX sample in suspension varied from 3.1×10⁻⁶wt % (CSU-IS) to 2.6 wt % (M-WT). For dry-dispersed particle mea-surements, particle concentrations varied from ∼10 cm−3
(AIDA) up to ∼9000 cm−3 (MRI-DCECC). Experiments
with M-AL, M-WT, EDB, and IMCA-ZINC were performed on a single drop basis. The shortest residence time of roughly 1.6 s was used for the laminar flow tube, LACIS, and the slowest cooling rate of 0.3◦C min−1 (time-average cooling rate over an expansion, which translates to the equivalent up-draft rate of∼0.5 m s−1)was used in AIDA-CECC. Alto-gether, immersion freezing was examined across the temper-ature range from∼ −10 to∼ −38◦C, and over a varied range of cooling rates, nucleation times and particle concentrations (summarized in publically accessible data base available at http://imk-aaf-s1.imk-aaf.kit.edu/inuit/).
2.4 Ice nucleation parameterization
We now describe a method to parameterize surface area-scaled immersion freezing activities using the size equivalent ice nucleation active surface-site density based on geomet-ric size (ns,geo; Connolly et al., 2009; Niemand et al., 2012; Hoose and Möhler, 2012). In short, this surface-site density approach approximates ice crystal formation observed in an experiment as a function of temperature, thus not accounting for time dependence. Accordingly,ns,geocan be expressed by
ns,geo(T )= −ln
1−Nice(T )
Ntotal
1 Sve
, (1)
in whichNiceis the number concentration of formed ice
crys-tals (cm−3),Ntotal is the total number concentration of
par-ticles prior to any freezing event (cm−3), andSveis the
vol-ume equivalent surface area of an individual particle (m2). As demonstrated in Niemand et al. (2012), if the activated ice fraction is small (< 0.1), the Taylor series approximation can be applied to Eq. (1). Assuming a uniform distribution of ns,geoover a givenStotaland a size independency ofns,geo, we can approximatens,geoas
ns,geo(T )≈
Nice(T )
NtotalSve
=Nice(T )
Stotal
Table 1.Summary of INUIT measurement techniques and instruments. All acronyms are available in Sect. S4. Note “poly” and “mono” denote polydisperse and quasi-monodisperse size-selected particle distributions, respectively.
ID Instrument Description Portable ? Reference InvestigableTrange Ice detectedTrange for this study
1 BINARY∗ Cold stage-supported droplet assay No Budke and Koop (2015) −25◦C <T<∼0◦C −24◦C <T<−15◦C
2 CSU-IS Immersion mode ice spectrometer Yes Hill et al. (2014) −30◦C <T<∼0◦C poly:−25◦C <T<−11◦C mono:−26◦C <T<−20◦C 3 Leeds-NIPI Nucleation by immersed particles No O’Sullivan et al. (2014) −36◦C <T<∼0◦C −21◦C <T<−11◦C
instrument
4 M-AL∗ Acoustic droplet levitator No Diehl et al. (2014) −30◦C <T<∼0◦C −25◦C <T<−15◦C
5 M-WT∗ Vertical wind tunnel No Szakáll et al. (2009); −30◦C <T<∼0◦C −21◦C <T<−19◦C
Diehl et al. (2011)
6 NC State-CS Cold stage-supported droplet assay No Wright and Petters (2013) −40◦C <T<∼0◦C −34◦C <T<−14◦C 7 CU-RMCS Cold stage-supported droplet assay No Schill and Tolbert (2013) −40◦C <T<−20◦C −32◦C <T<−23◦C 8 AIDA∗ CECC No Möhler et al. (2003) −100◦C <T<−5◦C poly: -35◦C <T<−27◦C Hiranuma et al. (2014a, b) mono:−34◦C <T<−28◦C
9 CSU-CFDC Cylindrical plates CFDC Yes Tobo et al. (2013) −34◦C <T<−9◦C −29◦C <T<−22◦C
10 EDB∗ Electrodynamic balance levitator No Hoffmann et al. (2013) −40◦C <T<−1◦C imm.a:−31◦C <T<−28◦C
contactb:−34◦C <T<−27◦C
11 FINCH∗ Continuous flow mixing chamber Yes Bundke et al. (2008) −60◦C <T<−2◦C −27◦C <T<−22◦C 12 FRIDGE∗ Substrate-supported diffusion and Yes Bingemer et al. (2012) −25◦C <T<−8◦C defaultc:−25◦C <T<−18◦C
condensation/immersion cell
imm.d:−25◦C <T<−18◦C 13 LACIS∗ Laminar flow tube No Hartmann et al. (2011); −40◦C <T<−5◦C −37◦C <T<−31◦C
Wex et al. (2014)
14 MRI-DCECC Dynamic CECC No Tajiri et al. (2013) −100◦C <T<∼0◦C poly:−26◦C <T<−21◦C
mono:−29◦C <T<−21◦C
15 PINC Parallel plates CFDC Yes Chou et al. (2011); −40◦C <T<−9◦C −35◦C <T<−26◦C Kanji et al. (2013)
16 PNNL-CIC Parallel plates CFDC Yes Friedman et al. (2011) −55◦C <T<−15◦C −35◦C <T<−27◦C 17 IMCA-ZINC Parallel plates CFDC No Lüönd et al. (2010) −65◦C <T<−5◦C imm.e:−36◦C <T<−31◦C Stetzer et al. (2008); ZINCf:−33◦C <T<−32◦C
Welti et al. (2009)
∗Instruments of INUIT project partners,aimmersion freezing,bcontact freezing,cdefault deposition nucleation,dimmersion freezing with suspended particles,eimmersion freezing with IMCA,fZINC alone.
In addition, the IN efficiency can be related to the BET-SSA to estimate BET-inferred ice nucleation surface-site density, ns,BET. A description of the procedures used to estimate both nsmetrics is given in Hiranuma et al. (2014b). The advantage
of usingns,geo is its applicability to both measurements and modeling activities due to the assumption of particle spheric-ity. Conversely, ns,geo cannot be directly obtained through suspension experiments because the size distribution of a suspended sample for each experiment is not available; there-fore,Stotalis determined from BET and the sample mass
sus-pended in water.
In order to convertns,geo values of all dry-dispersed parti-cle measurements into ns,BET, the geometric size-based ice-nucleating mass, nm,geo (g−
1), is first calculated from the
IN active surface using either the surface-to-mass conver-sion factor (in m2g−1) of 6/Dveρ (size-selected case) or
Stotal/Mtotal(polydisperse case) by
nm,geo(T )=
Nice(T )
NtotalMve
= 6
Dveρ
ns,geo(T )
≈
S
total
Mtotal
ns,geo(T ) , (3)
where Mve is the mass of a spherical particle of
volume-equivalent diameter (g), Dveis the volume equivalent
mid-point diameter of particles (m), ρ is the particle den-sity of illite NX (2.65×10⁶g m−3), and Mtotal is the
to-tal particle mass concentration (g cm−3). We note that the
DLS size distribution-derivedStotal/Mtotal (i.e., DLS-SSA)
is 6.54 m2g−1and use for the measurements with suspended particles. We also note that the conversion factor ranges from 11.3 to 2.26 m2g−1for size-selected particle diameters from 200 to 1000 nm, respectively, where these sizes denote the range of particle diameters used in the size-selected cases in the present study. Therefore, ice-nucleating mass can be scaled to the BET-SSA (θ, 124.4 m2g−1)to derivens,BETas
ns,BET(T )=
nm,geo(T )
θ ≈
nm,sus(T )
θ =
α Mveθ
, (4)
in whichnm,sus is the IN active mass for suspension measure-ments,αrepresents the ice activated fraction (=Nice/Ntotal),
which is the direct measurement of suspension experiments and some of the dry-dispersed particle methods. With an as-sumption of a uniform BET-SSA, the resultingns,BETmay be representative of measurements with suspended samples be-cause minimal corrections (onlyαandθ )are involved when compared to that with dry-dispersed particles. Owing to in-ternal surface area and surface roughness, BET-SSA may be greater than DLS-SSA (O’Sullivan et al., 2014).
re-quires one more step than when using ns,BET (with an ad-ditional assumption of constant size distribution for all sus-pensions) and two more steps than when using nm. For our
intercomparison study, we used both ns,BET and ns,geo. Be-cause fewer conversion factors are involved, ns,BET may be best suited for suspension measurements, and ns,geo may be best suited for dry-dispersed particle measurements (Eq. 3 to 4 or vice versa).
The usage of DLS-SSA for the calculation ofStotal/Mtotal
of suspension measurements appears to be reasonable, as this leads to ns,geo for suspension measurements nearly equiva-lent to ns,geo for dry-dispersed particles. WhenStotal/Mtotal is derived based on TSI-OPS measurements, a value of 0.49 m2g−1is obtained, which is smaller by a factor of about 13 compared to DLS-SSA. This difference may be mainly due to the fact that dry-dispersed particles are typically prone to agglomeration (discussed below, i.e., Sect. 3.1) compared to the measurements with suspended particles. The presence of fewer agglomerates in suspended particles is shown in Fig. 1 of Hiranuma et al. (2014b). Since the size distribu-tion of a suspended sample for each experiment was not mea-sured, DLS-SSA was used for the data evaluation for suspen-sion measurements throughout this study.
3 Results
3.1 Illite NX characterization
XRD results from the present and previous studies (Friedrich et al., 2008; Broadley et al., 2012) of the major minerals in bulk samples of illite NX are presented in Table 2. The results show that the bulk illite NX powder is composed of various minerals: illite, kaolinite, quartz, calcite and feldspar, but the relative mass of these minerals for this study differs from previous studies. For example, our measurement shows that the illite NX sample is composed of∼69 wt % illite mineral, whereas others report a larger amount of illite from 74 to 86 wt %. Similarly, we observed a somewhat different con-tent of other minerals compared to previous studies as listed in Table 2 (see also the Supplement Fig. S1). We note that the fractional values in compositional fingerprints may devi-ate even within the same batch, as all three XRD measure-ments deviated from the manufacturer’s data (Table 2). Fur-thermore, our XRD result indicates that the illite NX sample contains a smaller quartz fraction (3 %) than illite IMt1 from the Clay Minerals Society (10 to 15 % quartz according to the official XRF data and 20 % based on our own measure-ments).
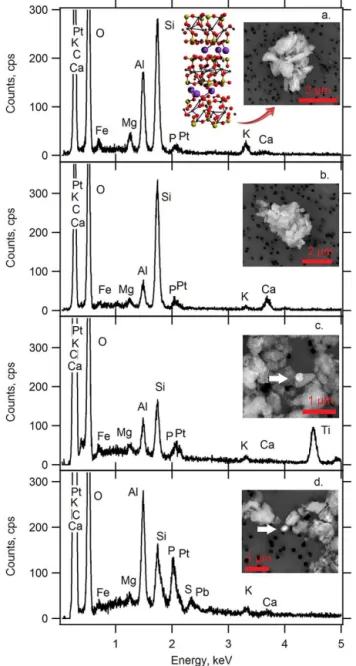
To complement bulk XRD analysis, the abundances of 13 elements (Pt, K, C, Ca, O, Fe, Mg, Al, Si, P, S, Pb and Ti), which are commonly identified in illite-rich samples, were measured by EDX spectroscopy on a single particle basis. Four representative EDX spectra are presented in Fig. 1. The presence of Fe and Mg is typical and characteristic for
il-Figure 1.EDX spectra of representative illite NX particles.(a)
Typ-ical illite,(b)calcite-rich mineral,(c)titanium-oxide-rich mineral, and(d)lead-rich mineral. Scanning electron microscopy images of characterized particles are shown in subpanels. A schematic repre-sentation of the illite’s crystal structure (silicon in yellow, aluminum in black, oxygen in red and potassium in purple) is also shown.
lite NX particles. The observed large amounts of Si and Al are due to the presence of layered aluminosilicate structures (i.e., layer of SiO2and Al2O3). The observed dominant
plat-inum (Pt) signals in all spectra originate from the sputter coating conducted prior to EDX analyses. Figure 1a shows the typical illite spectrum, which is similar to the one previ-ously published in Welton (1984). Illite-rich minerals, which included impurities of calcite, TiO2and Pb-P, were located
Table 2.X-ray diffraction analyses of the bulk composition of illite NX powder.
Weight Percentage (wt %)
Mineral This Manufacturer Broadley Friedrich study Data et al. (2012) et al. (2008)∗
Illite 69 86 74 76
Kaolinite 10 10 7 5
Quartz 3 4 7 < 1
Calcite/Carbonate 3 N/A 2 2
Feldspar 14 N/A 10 4
(Orthoclase/Sanidine)
∗Friedrich et al. (2008) noted 11 wt % additional impurities, including phlogopite (7.8 wt %), anhydrite
(1.4 wt %), plagioclase (1.1 wt %), and apatite (0.7 wt %).
c and d (inclusion of calcite, TiO2and Pb-P, respectively).
However, the EDX technique is not automated to detect these impurities present within the illite NX particles because of their very small weight fraction. Therefore, the possible ef-fect of these observed impurities in illite NX upon the ice nu-cleation activity cannot be evaluated on the basis of its bulk analysis of the chemical composition. Nonetheless, detection of non-illite mineral components may reflect the complexi-ties of natural dust particles, which typically contain multi-ple sites with differing nucleation abilities. Thus, illite-rich clay minerals can be used as reference material to mimic the ice nucleation activity of physically and chemically complex natural dusts (Murray et al., 2012).
The measured BET-SSA are 124.4 and 123.7 m2g−1with N2and H2O vapor, respectively, as the adsorbing gas on illite
NX particle surfaces. The similar BET surface areas for both N2 and H2O vapor gas adsorption suggest that the
forma-tion of a few monolayers of H2O does not alter the surface
morphology or the mineralogical phase of illite NX parti-cles. For comparison, our measurements ofθN2 for illite NX particles agreed with previously reported data within 20 % (104.2 m2g−1; Broadley et al., 2012). Since illite NX parti-cles have significant internal surface area, BET-derived sur-face areas can be expected to be larger than those derived from the laser diffraction technique. Supporting this notion, an SEM (scanning electron microscopy) image of an illite NX particle from Broadley et al. (2012) shows how micron-sized particles are made up of many nanometer-micron-sized grains. Normalized surface area distributions to the total surface area concentration measured by four different techniques are shown in Fig. 2. According to the manufacturer, 95 % (by mass) of the dry and mechanically de-agglomerated illite NX particles have a diameter smaller than 650 nm (i.e., D95).
This mass-based particle size is substantially smaller than that of another type of Arginotec illite (Arginotec, SE-illite, D95=5 µm). Interestingly, all mass size distributions
mea-sured in this study (not shown here) indicate a substantial mass fraction above 650 nm which is, in all cases, larger than 5 % (18, 24, 77 and 99.9 % for DLS, AIDA, MRI-DCECC and TSI-OPS for the FRIDGE immersion exper-iments, respectively), indicating the presence of
agglomer-Figure 2. Surface area distributions of (a) suspended and (b–
d)dry illite NX particles. Hydrodynamic size-based surface area distributions are measured in suspension using DLS. The aver-age (±standard error) of five measurements with different con-centrations of suspended illite NX powder (0.05, 0.1, 0.25, 0.5 and 1 mg mL−1)is presented in(a). Volume equivalent diameter-based dry-dispersed particle surface area distributions measured in the AIDA chamber (mean of 10 measurements±standard error) and MRI-DCECC (two individual measurements) are shown in(b) and(c), respectively. Panel(d)shows optical diameter-based parti-cle surface area distributions measured by a TSI-OPS used for the FRIDGE immersion mode experiments. Dotted lines represent log-normal fittings, and corresponding mode diameters are(a)0.32 µm, (b)0.36 µm,(c)0.62 µm and(d)4.75 µm. The width-parameters of log-normal fittings are(a)0.55,(b)0.65,(c)0.95 and(d)1.10.
particles during AIDA experiments were similar to those of suspension measurements. This observation is consistent with results presented in Hiranuma et al. (2014b). Briefly, the authors found agreement between the DLS-based hydro-dynamic diameter and the AIDA-derived volume equivalent diameter of hematite particles. As opposed to the AIDA ob-servation, the wider distributions and the shift in the mode di-ameters in the MRI-DCECC measurements towards a larger size (0.62 µm, Fig. 2c) when compared to Fig. 2a and b may indicate a higher degree of particle agglomeration as a result of different degrees of pulverization during the particle gen-eration processes or particle coagulation at the high aerosol number concentration used for these measurements. A more pronounced agglomeration effect was observed by the TSI-OPS measurements (Fig. 2d), such that a surface area dis-tribution of supermicron-sized particles was obtained. Thus, different types of dry particle dispersion methods can con-tribute to varying degrees of agglomeration and the observed differences in surface area distributions. Though all size seg-regating instruments used in the present study are well cal-ibrated, we cannot rule out the effect of measurement tech-niques themselves on the observed differences in particle size distribution. In Sect. 4.4 we discuss whether agglomeration has an effect on the IN activity.
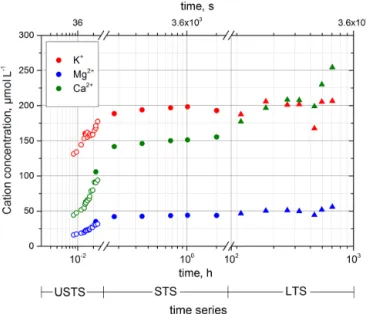
The cation release by illite NX in the aqueous suspension was measured with IC as a function of time. The suspension was kept mechanically agitated for 3 weeks. The following cations were identified in the samples: K+, Ca2+and Mg2+. As seen in Fig. 3, IC data clearly demonstrates that roughly all cations were released into the aqueous environment by illite NX almost instantaneously. The concentration of the cations increased rapidly and reached equilibrium within the first 2 min after immersion of sample into water. Of all the cations measured, only Ca2+exhibited a slow concentration raise on the longer time scales.
3.2 Immersion freezing measurements and intercomparisons
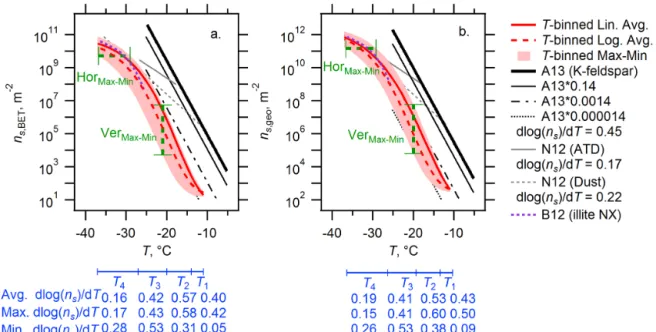
All ice nucleation spectra with ns,BET(T ) andns,geo(T ) are shown in Figs. 4 and 5, respectively. A similar figure with nm(T )is also shown in Fig. S2. Furthermore, we compare
thensdata from 17 instruments to 4 literature results.
Specifi-cally, IN spectra reference curves of previously reported illite NX particles (Broadley et al., 2012, hereafter B12), micro-cline particles (Atkinson et al., 2013, hereafter A13), ATD and desert dusts (Niemand et al., 2012, hereafter N12) are also expressed as both ns,BET(T )andns,geo(T ). The conver-sion betweenns,geo(T )andns,BET(T )was performed accord-ing to (Eqs. 3 and 4). Thens(T )(m−2as a function of ◦C)
fits from the reference literature are
Figure 3.Evolution of the cation concentration in aqueous
suspen-sion of 0.1 g illite in 10 mL deionized water with time. The scaling of the time-axis is different for three different subsections of the time series (USTS, STS and LTS).
nA13s,BET=104×exp(−1.038(T+273.150)+275.260), (5) nB12s,BET=104×exp
6.530×10⁴
+−8.215×10²×(T+273.150)
+3.447×(T+273.150)2
+−4.822×10⁻³×(T+273.150)3
, (6)
nN12s,geo(ATD)=exp(−0.380T+13.918), (7) nN12s,geo(Dust)=exp(−0.517T+8.934) . (8) For microcline (K-feldspar), thens,geo to ns,BET conversion was performed using a laser diffraction-based surface-to-mass conversion factor of 0.89 m2g−1and an N2BET-SSA
of 3.2 m2g−1 (Atkinson et al., 2013). For ATD and nat-ural dust, we used a surface-to-mass conversion factor of 3.6 m2g−1, assuming a monodisperse particle size at the
log-normal fit mode diameter of 0.64 µm (Niemand et al., 2012) and the measured N2 BET-SSA of 34.4 m2g−1 (this
study). We note that the ATD parameterization is valid only for−26.7◦C <T <−17.7◦C. In addition, we also present 14, 0.14 and 0.0014 % scaled A13nscurves to see if K-feldspar
(microcline) can be used as a scaling factor to determine the ns(T )of illite NX.
Figure 4.Intercomparison of 17 instruments usingns,BET. Black or red cross markers are interpolatedns(T )used forT-binned averaging.
Note that M-AL and M-WT results are presented in(d). In(k), FRIDGE results of default (solid square) and imm.mode (open diamond) measurements are presented. Both ZINC (solid square) and IMCA-ZINC (open diamond) data are shown in (p). Reference immersion freezingns(T )spectra for illite NX (B12; Broadley et al., 2012), K-feldspar (A13; Atkinson et al., 2013), ATD and desert dusts (Dust) (N12; Niemand et al., 2012) are also shown (See Sect. 3.2).
method are summarized below. The detailed discussion of the methods intercomparison follows in Sect. 3.3.
3.2.1 BINARY
This recently developed microliter droplet assay technique demonstrated its capability of measuring immersion freezing of clay minerals in the temperature range of−15 to−24◦C.
Similar to most of the other suspension-based techniques, BI-NARY identified a steep ns(T )increase, which started just
below −20◦C. The BINARYns(T ) spectrum was derived
by compiling measurements with varied illite NX mass con-centrations over 2 orders of magnitude (0.1 to 10 mg mL−1, see the supplementary methods). Immersion freezing effi-ciency of illite NX particles collapsed into a single ns(T )
spectrum, i.e., IN efficiency does not depend on suspended particle mass for the concentration range studied here. This
observation is a check for consistency and it implies that ice nucleation is indeed triggered by suspended illite NX parti-cles, and neither by impurities contained in the water used for dilution nor at the glass surface supporting the droplets. If IN efficiency did depend on suspended particle mass, dif-ferentns(T )spectra would result from the various illite NX
concentrations, which are shifted by the respective dilution factor.
3.2.2 CSU-IS
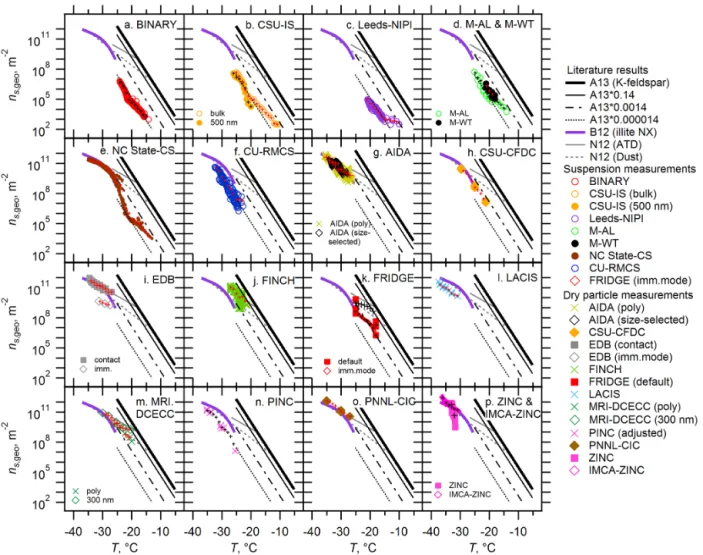
freez-Figure 5.Geometric size-based ice nucleation active surface-site density,ns,geo, of 17 measurement techniques. Black or red cross markers
are interpolatedns(T )used forT-binned averaging. Note that M-AL and M-WT results are presented in(d). In(k), FRIDGE results of default (solid square) and imm.mode (open diamond) are presented. Both ZINC (solid square) and IMCA-ZINC (open diamond) data are shown in(p). Reference immersion freezingns(T )spectra are provided as in Fig. 4.
ing measurements. The results suggest size independence of ns within the experimental uncertainties (a combination of
binomial sampling error and the uncertainty of conversion of aerodynamic particle diameter to mass) for the range of examined size (500 nm vs. bulk) and mass concentrations of bulk illite NX powder in suspensions from 3.1×10⁻⁶to 0.5 wt %, for non-size-segregated particles, and 2.2×10⁻⁵ to 4.4×10⁻⁴wt % for size-segregated particles.
3.2.3 Leeds-NIPI
This suite of cold stage instruments has the capacity to operate using droplets with volumes in the microliter to picoliter range. This enables high resolution immer-sion freezing analysis for a wide range of temperatures from higher (−22◦C <T<−11◦C) to lower temperatures (−37◦C <T <−26◦C). The highest freezing temperatures are attained with the largest droplets, which contain the
largest surface area of illite NX. Combined with the previ-ous parameterization reported in Broadley et al. (2012), the Leeds-NIPI data follows the overallns(T )spectrum defined
by the bulk of the instruments. This suggests that immersion freezing efficiency, inferred byns(T ), of illite NX particles
is dependent on neither droplet volume nor mass of illite NX particles in suspension (i.e., wt % 0.1 or 1 %); instead the freezing efficiency only depends on the surface area per droplet. Together with CSU-IS, these two instruments pro-vided data points for temperature as high as∼ −11◦C,
esti-mating a similar lower-limit ofns,BETvalues of∼10 m−
2.
3.2.4 M-AL and M-WT
transfer are similar to those of droplets falling through the atmosphere. Both M-AL and M-WT techniques analyzed the freezing efficiency of drops containing polydisperse illite NX particles in the temperature range between−14 and−26◦C. Thensvalues agree reasonably well with substrate-supported
suspension experiments (with the exception of FRIDGE ex-periments), implying that the surface making contact with the substrate has a negligible effect on immersion freezing for our experimental conditions.
3.2.5 NC State-CS
Extensive experimental conditions were realized by NC State-CS (Wright and Petters, 2013; Hader et al., 2014). Unique aspects of this instrument are the sampling of drops within a squalene oil matrix that allows for experiments using cooling rates as slow as 0.01 K min−1 and an
auto-mated freeze detection algorithm that allows for the rapid processing of more than 1000 possible drops per experiment to improve sample statistics. Drops containing ∼0.0001 to 1.0 wt % of the illite NX test sample were studied at a cooling rate of 1 K min−1to find the immersion freezing ability. A to-tal of nine immersion mode freezing experiments, spanning a range of drop volumes from∼400 picoliter to 150 nanoliter, were performed. Using this instrument a wide range of tem-peratures was investigated (−34◦C <T<−14◦C) yielding ns(T )values ranging from 102 to 1010m−2. The data from
the nine individual runs collapsed into a singlens(T )
spec-trum suggesting that the mass loading of dust in the drop did not affect the measurements for the wt % values investigated. At the highT end (T>−20◦C), the data are in reasonable
quantitative agreement with the CSU-IS measurements. At the lowT end (T<−20◦C), the data are in agreement with
the B12 reference spectrum. 3.2.6 CU-RMCS
The University of Colorado (CU)-RMCS examined the freezing abilities of droplets containing 1.0 wt % illite NX. CU-RMCS detected the warmest immersion freezing of illite NX particles at about−23◦C under the experimental condi-tions used in the present work (see the Supplement for fur-ther details). Results for−32◦C <T <−23◦C are from six different experiments using four different droplet size bins: 10–20, 20–60, 60–120, and 120–200 µm (lateral diameter). These droplet sizes correspond to a variation in droplet vol-ume from∼0.3 picoliter to 2.5 nanoliter.
3.2.7 AIDA
The AIDA cloud simulation chamber generates atmospher-ically relevant droplet sizes (several µm in diameter, vary-ing with coolvary-ing rates), and therefore closely simulates mixed-phase cloud conditions. Ice-nucleating efficiencies of both polydisperse and quasi-monodisperse illite NX particles were investigated in this study.ns of DMA size-selected
il-lite NX particles (200, 300 and 500 nm mobility diameter) agreed well with that of the polydisperse population for im-mersion freezing experiments, within previously reported un-certainties (T±0.3 ◦C andns±35 %; Steinke et al., 2011).
Thus, a negligible size dependency of ns for “submicron”
dry illite NX particles for temperatures below−27◦C was found. Previously, Hiranuma et al. (2014a) demonstrated the size independence of thens value using two different sizes
of submicron hematite particles (200 and 1000 nm volume equivalent diameter) based on AIDA deposition mode nucle-ation experiments. Such a similarity might remain true for the immersion mode freezing of mineral dust particles that are smaller than 1 µm diameter.
3.2.8 CSU-CFDC
This CFDC provided data for condensation/immersion freez-ing at around−21.2,−25.1 and−29.7◦C (a total of eight
data points with two, two and four points at around each temperature, respectively), which extends to a warmer region than the AIDA measurements. As demonstrated in DeMott et al. (2015), higher RHw values were required for full
ex-pression of immersion freezing in CSU-CFDC. The use of 105 % RHwin the CFDC has been shown to underestimate
INP activity for natural dusts by up to a factor of 3, but is a necessary compromise. Comparably, the CSU-CFDC results agreed well with the AIDA measurements within a factor of 3 inns,geoestimation (AIDAns> CSU-CFDCns; DeMott et al., 2015). All the CFDC measurements were conducted with 500 nm mobility diameter size-selected particles, as dis-cussed in the supplementary methods.
3.2.9 EDB
With EDB, both the contact and immersion mode freezing efficiencies of illite NX particles were investigated. The con-tact nucleation modenswere clearly higher than the
immer-sion modens (by more than 1 order of magnitude in terms
ofns,geo, Fig. 5i). This was in part due to the fact that immer-sion freezing experiments were conducted only when illite NX particles were not frozen via contact nucleation but re-mained immersed in a supercooled droplet in the EDB cell (see the Supplement).
3.2.10 FINCH
The immersion freezing results from FINCH showed the highestns values in the−22 to−27◦C temperature range
out of all of the other instrument results. All the FINCH measurements were conducted with 500 nm mobility diam-eter size-selected particles. Two possible reasons for high ns values when compared to the other measurements are:
(1) an overestimation of nsdue to excess Nice and/or
un-derestimatedStotal or (2) a large temperature-uncertainty. It
a high number of growing ice crystals (DeMott et al., 2011). A constant total concentration of particles continuously pass-ing through the chamber was maintained at 1.07±0.17 cm−3
(average±standard deviation). 3.2.11 FRIDGE
FRIDGE data, which cover both measurements of dry and immersed particles with the same instrument but with differ-ent sample processing, lie within the upper edge of the bulk of other ns data points. There are a few important
implica-tions from the FRIDGE results. First, on average, the mea-surements with dry particles in the “default” setting showed more than an order of magnitude highernsin comparison to
the immersed particles in FRIDGE experiments (bothns,BET and ns,geo, Figs. 4 and 5) at −25◦C <T<−18◦C. For in-stance, FRIDGE experiments in the pure immersion mode showed much lower ns than that with the default setting
(i.e., combined deposition and immersion mode), but agreed with other immersion data sets. Second, a sudden increase in ns(T )was found for the measurements with immersed
par-ticles at∼ −20◦C, suggesting a dominant activation around
−20◦C. This transition is a unique behavior only found with the FRIDGE’s IN detecting sensitivity. A temperature shift (i.e., shifting the data∼7◦C lower) results in FRIDGE data overlapping with the bulk of other data and may offset dis-crepancies. However, other mechanistic interpretations (e.g., contribution of agglomeration) are also plausible causes of this discrepancy. More detailed discussions of the role of ag-glomerates uponns and sample processing are available in
Sects. 4.4 and 4.5. 3.2.12 LACIS
With the shortest instrument residence time (∼1.6 s), LACIS measured immersion mode freezing of illite NX particles for three different mobility diameters (300, 500 and 700 nm) from −31◦C down to the homogeneous freezing tempera-ture. Similar to AIDA results, a size independence ofns of
submicron illite NX particles was observed within defined experimental uncertainties (see the supplementary methods). Further, without any data corrections, the results of LACIS reasonably agreed with AIDA measurements. Furthermore, though there is no overlapping temperature range for LACIS and CSU-CFDC in the present study, consistency between data from LACIS and CSU-CFDC for other clay minerals (i.e., different kaolinite samples) has been described previ-ously (Wex et al., 2014). The results from both instruments agreed well with each other from a data evaluation based on ns, and this agreement was even improved when the
differ-ent residence times in LACIS and the CSU-CFDC were ac-counted for (i.e., when nucleation rate coefficients were com-pared). Furthermore, a size independence of the immersion mode freezing was seen for Fluka-kaolinite particles with mobility diameters of 300 and 700 nm in Wex et al. (2014),
and for illite NX particles when comparing particles with mobility diameters of 500 nm to bulk material (Augustin-Bauditz et al., 2014).
3.2.13 MRI-DCECC
Comparison between polydisperse and size-selected (300 nm mobility diameter) measurements in this cloud simulation chamber demonstrated the size independency of ns for
submicron illite NX particles for slightly higher tempera-tures (up to−21◦C) than AIDA results. Interestingly, MRI-DCECC data exhibited at least an order of magnitude higher ns values than most other suspension measurements. We
note that only negligible freezing events were detected above
−21◦C even with a∼9000 cm−3number concentration of
polydisperse illite NX particles in part due to the detection limit of the welas®optical counter ofNice= 0.1 cm−3.
3.2.14 PINC
PINC provided data for immersion freezing at around−25.4,
−30.2 and −34.6◦C (a total of nine data points with one, four and four points at around each temperature, respec-tively). The estimatednsvalues are in agreement with other
measurements for the test range of−35◦C <T<−25◦C af-ter applying a residence time correction of about a factor of 3. The data are for ice nucleation onto 500 and 1000 nm mo-bility diameter illite NX particles; therefore, an OPC thresh-old size of 2 µm for ice detection is used. The impactor used for sampling particles into PINC was characterized for size-resolved particle losses and was found to have a cutoff (D50)
of 725 nm mobility diameter. As such, when determining ns,geothe particles losses (25 to 60 %, see the Supplement for more details) were taken into account for calculating acti-vated fractions. We note thatns,geoincreased after correcting the data for particle losses, resulting in agreement between the data from PINC and data from LACIS, AIDA and UC-RMCS in the temperature range from−25 to−35◦C. 3.2.15 PNNL-CIC
The IN efficiency of illite NX particles in the immersion mode in the temperature range of−35◦C <T<−27◦C was observed to increase at lower temperatures. Estimatedns
val-ues were somewhat higher in this temperature range when compared to those from most of the other measurements. Data were obtained at conditions where PNNL-CIC was op-erated at 105 % RHw at three different temperatures. Dust
3.2.16 IMCA-ZINC
Coupled with IMCA, ZINC showed reasonable agreement with AIDA and PNNL-CIC. This reproducibility verified the performance of the IMCA-ZINC combination, which was not tested during ICIS-2007 (DeMott et al., 2011), perhaps due to the similarity in the experimental conditions (i.e., par-ticle generation) to the other two methods. We also note that the residence time in ZINC is about a factor of 3 longer than that in PINC. The IMCA-ZINC measurements in comparison to the measurements with ZINC alone (i.e., a combination of deposition nucleation, contact freezing, condensation freez-ing, surface condensation freezing and immersion freezing) is discussed in Sect. 4.5 in more detail.
Overall, as described above (Sects. 3.2.1 to 3.2.6), sus-pension experiments with cold stage devices and levita-tion techniques provide IN measurements under more con-trolled (with respect to droplet size, concentration and mass of particles) conditions and a wider temperature range (up to −11◦C) than comparable dry-dispersed particle experi-ments. The resultingnsvalues from these suspension
exper-iments are also independent of the total number of droplets and suspended dust particle mass.
The estimated nsvalues of dry test particles below −25.5◦C are in reasonable agreement with a previous study (Broadley et al., 2012) at temperatures below−25◦C.
Fur-thermore, the strong temperature dependence and size inde-pendence ofnsmay suggest a uniform distribution of
freez-ing sites over the total surface of illite NX particles in the im-mersion mode in this temperature range. Specifically, AIDA and MRI-DCECC have shown size-independentnsvalues for
submicron dry-dispersed particles. Overall, compared to sus-pension measurements, dry-dispersed particle measurements showed highernsvalues. For example, FINCH is the only
in-strument which showed highernsvalues than the
parameter-ization by Niemand et al. (2012) for ATD. Likewise, AIDA results indicated slightly highernsvalues than CSU-CFDC’s
results. The lowernsof CSU-CFDC may be a consequence
of underestimation of Nice, possibly due to its constrained
RHw(at 105 %) and/or the disturbance of aerosol lamina
be-tween two plates in a CFDC (DeMott et al., 2015). 3.3 Intercomparisons based on the slope parameter of
ns(T )spectra
A compilation of 17nsspectra from 17 instruments in a
tem-perature range between−10.1 and−37.5◦C is presented in
Fig. 6. For both the geometric based and the BET area-basedns, the differences among measurements can be more
than 1 order of magnitude at any given temperature. Diver-sity is especially pronounced for several orders of magnitude innsat−27◦C≤ T ≤ −18◦C, where the results from
sus-pension measurements and a majority of dry measurements coexist (see the investigated T range for each technique in Table 1). Another notable feature of this specific
tempera-ture range in Fig. 6 is the coincidence of the steepest slope in the spectrum (i.e., the absolute value of 1log(ns)/1T
or |1log(ns)/1T| in log (m−2)◦C−1, hereafter denoted as
1log(ns)/1T )when compared to other temperature ranges.
For instance,nsincreases sharply at temperatures colder than −18◦C to be nearly parallel to the A13 parameterization down to−27◦C, where it starts leveling off and is eventu-ally overlapping with the N12 parameterization at the low temperature segment.
Correspondingly, the overall trend of the spectrum is traced by the measurements from NC State-CS alone (Fig. 4e). Moreover, the slopes of the spectrum for three sub-segments (−34◦C <T<−27◦C,−27◦C <T<−20◦C, and−20◦C <T<−14◦C) can be calculated from interpo-lated data and compared to N12 and A13 parameterizations. As expected, the steepest slope in the spectrum (=0.66) of the NC State-CS data was found in the−27◦C <T <−20◦C
range, which was similar to that of the A13 parameteriza-tion (0.45 for T>−25◦C). However, smaller slope values are found for the other two segments (0.18 forT <−27◦C and 0.29 for T >−20◦C), which are comparable to the temperature-independent N12 slopes (0.17 for ATD and 0.22 for Dust) and the B12 slope (0.25 for−35◦C <T<−27◦C), suggesting that a dominant fraction of INP contained in our test dust becomes ice active in immersion freez-ing at −27◦C <T<−20◦C. In addition, FRIDGE immer-sion mode measurements also show a sharp decrease in 1log(ns)/1T (from 0.59 to 0.25, Figs. 4k and 5k) for the
measurements with immersed particles at∼ −20◦C. Simi-lar observations are made by most of the other suspension measurement techniques. In short, most suspension meth-ods capture the steepest segment of thens(T )spectral slopes
(1log(ns)/1T )at−27◦C <T<−20◦C, where the slope is
nearly parallel to the A13 parameterization. One exception is CU-RMCS (Fig. 4f). The highest possible freezing tem-perature investigated by this experimental system was about
−23◦C with∼2.5 nanoliter droplets containing 1.0 wt % il-lite NX (see the supplementary methods). Hence, CU-RMCS did not capture the transition in1log(ns,BET)/1T at around −20◦C, but the steep slope of the spectrum (=0.36) vali-dated the high density of IN active sites below−23◦C. The error in temperature for this technique is always ±0.5◦C, based on freezing experiments without any foreign sub-stances in supercooled drops (i.e., homogeneous freezing ex-periments).
Similarly, dry-dispersed particle measurements also ex-hibit scattered data for their measured temperature ranges. Both agreements and equally important disagreements were observed. First, the agreements are summarized. AIDA data show that the values of1log(ns,geo)/1T (=0.22, Fig. 5g) are identical for both polydisperse and size-selected mea-surements, perhaps suggesting a uniform distribution of ac-tive sites over the availableStotal of illite NX in this study.
vir-Figure 6.Immersion freezingns(T )spectra of illite NX particles from 17 instruments calculated as a function of the BET(a)and geometric (b)surface areas. Reference immersion freezingns(T )spectra are provided as in Figs. 4 and 5. Dry-dispersed particle (red markers) and suspension (blue markers) results forns,BETandns,geoare shown in(c)and(d), respectively, to highlight the difference between dry particle
and suspension subsets.
tually identical to the slope estimated from AIDA measure-ments. PINC estimated 1log(ns,geo)/1T (=0.26, Fig. 5n) values are in reasonable agreement with AIDA and IMCA-ZINC and N12 parameterizations at temperatures below
−25◦C. From the CSU-CFDC results,1log(ns,geo)/1T de-rived from interpolated data is 0.40 (Fig. 5h). Considering the AIDA and CSU-CFDC data, thens(T )spectrum depicts
sim-ilar trends (i.e.,nsor temperature deviation around−27◦C)


![Table 3. List of the Gumbel cumulative distribution fit parameters to the n s ,BET and n s ,geo for T -binned ensemble data set fitted in the linear space [All (lin)], ensemble data set fitted in the log space [All (log)], ensemble maximum values (All max](https://thumb-eu.123doks.com/thumbv2/123dok_br/18183752.331471/18.918.229.686.200.628/gumbel-cumulative-distribution-parameters-ensemble-ensemble-ensemble-maximum.webp)