19 http://biology.num.edu.mn
http://mjbs.100zero.org/ Volume 12(1-2), 2014
Mongolian Journal of Biological
Sciences
ISSN 2225-4994 (online edition)
MJBS
Original Ar• cle
http://dx.doi.org/10.22353/mjbs.2014.12.02
Community Structure and Productivity in Western
Mongolian Steppe
Kiyokazu Kawada
1*, Ayaka Yamashita
2, Tsagaanbandi Tsendeekhuu
3and Toru
Nakamura
11Faculty of Life and Environmental sciences, University of Tsukuba, 1-1-1, Tennodai, Tsukuba, Ibaraki,
305-8572, Japan, Tel. & Fax: +81-29-853-4794
2Ministry of Agriculture, Forestry and Fisheries, Tokyo, Japan
3Department of Biology, National University of Mongolia, Ulaanbaatar, Mongolia
Abstract
Key words: desert steppe, species composition, plant functional types, photosynthetic pathways, palatability
Article information: Received: 15 Oct. 2013 Accepted: 06 May 2014 Published: 15 Apr. 2015
Correspondence*: kawada.kiyokazu.gu@u. tsukuba.ac.jp
Cite this paper as:
The people of the Mongolian steppe have maintained a sustainable, nomadic lifestyle. However, several ecological processes are threatening their way of life. Ecological changan be detected through the analysis of quantitative and qualitative data. It is therefore, imperative to develop a sustainable rangeland management system aimed at combating desertifi cation. In this study we quantitatively and qualitatively describe several western Mongolian steppe plant communities by examining species composition, plant volume and community structure. Study sites were located in the Uvs and Khovd provinces and had all been affected by livestock grazing. A total of 48 species were found. Stipa krylovii, S. gobica, Cleistogenes songorica, Koeleria cristata and Ajania achilleoides were dominant. There was a signifi cant relationship between biomass and plant volume at all sites. Study sites were classifi ed into four groups using cluster analysis, based on the presence or absence of several species. More than 90% of plant volumes at all groups were perennial grasses and perennial forbs. The ratio of C3 to C4 plants at site 3 was reversed in comparison to the other sites. Species highly palatable to livestock were dominant at all sites. To ensure the sustainable use of biological resources in these arid areas, these fi ndings should be taken into account in designing land-use plans.
Kawada, K., Yamashita, A., Tsendeekhuu, Ts. & Nakamura, T. 2014. Community structure and productivity in western Mongolian steppe. Mong. J. Biol. Sci., 12(1-2): 19-26.
Introduction
In light of the current explosive global population increase, the sustainable use of biological resources has become an increasingly important issue (Davies et al., 2012). This is a particularly pressing problem in arid and semi-arid ecosystems such as steppe and desert steppe, which have low rates of biological resource production. In these ecosystems, unsustainable use of resources leads to increased risk of land degradation (Fujita & Amartuvshin, 2013).
Traditional nomadic pastoralism is commonly practiced in regions of the Mongolian steppe. Degradation of the steppe because of excessive use has become a growing concern over the last few years. The multiple stable state model is able to explain these changes (Westoby et al.,
episodic drought, precipitation, soil erosion, as well as grazing (Gibson, 2009). It is important to note that some ecological factors have triggered other states of change.
Ecological change can be detected through the analysis of quantitative and qualitative data. A number of studies conducted at the local level can describe these ecological changes. For example, change in qualitative parameters, such as species composition, species diversity, plant functional types, and photosynthetic pathway (C3, C4 or CAM) can indicate land degradation (Naveh & Whittaker, 1980; Fernandez-Gimenez & Allen-Diaz, 2001; Hayes & Holl, 2003). Observing an ecological change like this is diffi cult on a coarse spatial scale. In particular, increases in shrub biomass caused by intensive grazing (Tobler et al., 2003; Laliberte et al., 2004), increases in the biomass of unpalatable plants, such as thorny shrubs and plants with prostrate growth forms (Nakamura et al., 2000; Wuyunna et al., 2004), increases in the biomass of xerophytic or halophytic plants (Kawanabe et al., 1998), and increases in the proportion of C4 plants (Tsendeekhuu & Black, 2005) have been reported as signs of change.
On the other hand, the assessment of these changes continues to be an issue. When evaluating the potential productivity of a steppe ecosystem for pasturing, it is important to know the biomass of highly palatable plants that is available for livestock, as the quality of nutrition available in a pasture is strongly correlated with livestock productivity (Licitra et al., 1997). The hypothesis of this study is that ecologically valuable state is able to describe by comparison of several stable state of steppe. In addition, these state compositions are able to describe as indicator of state change for sustainable use of the steppe. This study therefore, constitutes important information for nomadic pastoralism in western Mongolia.
In order to restore the Mongolian steppe and prevent further damage, it is necessary to develop a scientifi cally based sustainable resource use system. The aim of our study was to quantify and describe the western Mongolian steppe in terms of species composition and biomass of plants, and to formulate ecological interpretations of the community structure of this ecosystem.
Material and Methods Study area
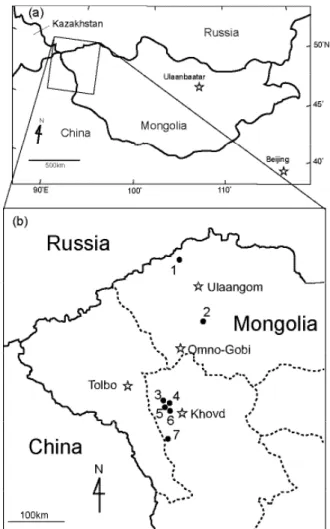
The study area was located in the Uvs and
Khovd provinces in western Mongolia. Two study sites were in Uvs (Dund Termes and Suujin Ekh) and fi ve were in Khovd (Northwestern Khovd-1, Northwestern Khovd-2, Northern Hatuu Hutul, Western Khovd, Southern Khovd; Fig. 1). The study area had an extent of c. 300 km (47°53′17.4″ – 50°36′36.0″N) from south to north and c. 75 km (91°16′52.9″ – 92°19′49.6″E) from east to west. Elevation ranged from 1403–1879 m a.s.l., and the slope angle ranged from 0–4° (Table 1).
While high mountain ranges such as the Khangai Mountains and Altai Mountains are present in western Mongolia, the Khovd and Uvs provinces are located in a wide low-altitude basin characterized by fl at land. The western region of Mongolia is susceptible to drought because of low precipitation (Mendsaikhan et al., 2010). In the Uvs province, annual precipitation is 138.4 mm
and mean temperature in July is 19.0°C. In the Khovd prefecture, annual precipitation is 127.4 mm and mean temperature in July is 18.5°C. The entire study area is therefore, semi-arid to semi-arid. It has also been affected by livestock grazing. Number of livestock in Mongolia has increased signifi cantly since 1991, which is largely attributable to increases in the numbers of sheep and goats. The majority of the livestock in the study area also consisted of these types of animals. While in Uvs there are more sheep than goats, goats have outnumbered sheep in Khovd since 1997.
Field survey
The fi eld survey was conducted in July 2010. At each study site, fi ve 1 m2 quadrats spaced at 10 m were set in a straight line. Total species composition within each quadrat was recorded. Plant canopy coverage and height was measured for each species. Coverage was measured using the Penfound-Howard method (Penfound & Howard, 1940). Coverage classes were defi ned as follows: “+”: < 1%; “1′”: 1–5%; “1”: 5–25%; “2”: 25–50%; “3”: 50–75%; and “4”: 75–100%. Aboveground biomass was collected from one randomly selected quadrat in each study site. Each species was collected separately and collected in a paper bag. Dry weight was measured after oven drying the samples at 80°C for 24 hours.
Data analysis
Plant functional type, photosynthetic pathway and palatability were classifi ed to attempt an assessment of western Mongolian steppe ecosystem condition. Classifi cation of plant functional type and photosynthetic pathway was based on previous studies (Wang, 2004a, b; Damiran, 2005; Liu & Wang, 2006). Plant functional type was classifi ed into four types as
perennial grass (PG), perennial forb (PF), annual forb (AF) and shrub (SHR). Photosynthetic pathway was classifi ed as C3 or C4. Palatability was classifi ed in accordance with the published preferences of sheep and goats (Damiran, 2005). As there were however, several species for which this information was not available, this parameter was classifi ed as follows: preferred, desirable, consumed, but undesirable, not consumable, no information. Species not listed were excluded from analysis.
The relationship between biomass and plant volume for each of the seven study sites was calculated for the quadrat from that site from which the aboveground biomass was collected. Correlation analysis was conducted between biomass and plant volume to determine the signifi cance of the relationship. If biomass and plant volume have a signifi cant relationship, the formula of relationship was used to estimate the aboveground biomass in all quadrats from that study site. Plant volume (v, cm3) was calculated by multiplying coverage (c, cm2) by maximum plant height (h, cm) for species i and summing the results for all the species in a quadrat (Nakamura
et al., 2000). Coverage classes were converted to areas as follows: “+”: 50 cm2; “1′”: 300 cm2; “1”: 1600 cm2; “2”: 3800 cm2; “3”: 6300 cm2; and “4”: 8800 cm2. Plant volume of each stand was thus calculated using the formula v = Σ (ci · hi).
Species diversity was analyzed using Shannon’s diversity index (Shannon, 1948), calculated as H′ = − Σ pi log2 pi; Simpson’s diversity index (Simpson, 1949), calculated as D
= 1 − Σ pi2; and Pielou’s equitability index (Pielou,
1969), calculated as J = H′ / log2 S. In the fi rst two equations, pi denotes the relative dominance of species i. It was calculated using the formula
pi = ci · hi / v. In the third equation, S denotes the total number of species.
Table 1. Geographical coordinates and altitude, slope and dominant plant species of the seven study sites.
Site Location Latitude Longitude Altitude (m) Slope (°) Dominant species
1 Dunt Termes 50°36’36.0” 91°52’39.6” 1403 0 Koeleria cristata
2 Suujin Ekh 49°38’49.6” 92°19’49.6” 1570 0 Stipa krylovii
3 Northwestern Khovd-1 48°22’01.4” 91°16’52.9” 1481 0 Cleistogenes songorica
4 Northwestern Khovd-2 48°15’10.6” 91°21’28.0” 1676 3 Stipa krylovii
5 Northern Hatuu Hotol 48°07’38.6” 91°32’16.3” 1526 0 Ajania achilleoides
6 Western Khovd 48°04’47.1” 91°21’35.8” 1879 4 Stipa krylovii
Cluster analysis using the TWINSPAN algorithm (Hill, 1979) was performed to analyze community composition differences between quadrats. These analyses were carried out using PC–ORD for Windows version 6.08 (MjM Software Design, Gleneden Beach, OR, USA). SPSS version 21 (IBM, NY, USA) was used for other statistical analyses. We conducted Kruskal-Wallis tests to test for differences between groups, and performed multiple comparisons using a Wilcoxon test with a Bonferroni correction.
Results
A total of 48 species (including two unidentifi ed species) was found in the study sites. The cluster analysis divided the 35 quadrats into four groups (Fig. 2). Division 1 (N = 35, eigenvalue = 0.4305) was characterized by Stipa krylovii, Koeleria cristata and Aster altaicus, Division 2 (N = 14, eigenvalue = 0.5325) was indicated by
Dontostemon elegans, and Division 3 (N = 21, eigenvalue = 0.4557) by Anabasis brevifolia. The four groups were closely associated with study sites. Group 1 comprised the quadrats from site 4;
group 2 included only quadrats from study sites 1 and 6; group 3 comprised the quadrats from study sites 2, 5 and 7, and one quadrat from study site 6; group 4 consisted of the quadrats from study site 3.
Species richness, Shannon’s diversity index, Simpson’s diversity index and Pielou’s equitability index were compared among the groups identifi ed by the cluster analysis (Table 2). Species richness (number of species) was 11.2 ± 0.8 (average ± S.D.) in group 1, 10.1 ± 4.8 in group 2, 10.9 ± 1.9 in group 3, and 4.2 ± 1.1 in group 4. The species richness of group 4 was signifi cantly lower than that of groups 1 and 3 (P < 0.05). The Shannon’s diversity indices were 1.9 ± 0.5 for group 1, 1.5 ± 0.6 for group 2, 2.3 ± 0.6 for group 3 and 1.4 ± 0.5 for group 4. The index for Group 3 was signifi cantly higher than that for groups 2 and 4 (P < 0.05). The Simpson’s diversity indices were 0.8 ± 0.2 for group 1, 0.7 ± 0.2 for group 2, 0.9 ± 0.1 for group 3 and 0.7 ± 0.2 for group 4. In this case the value for group 3 was signifi cantly higher than that for group 2 (P < 0.05). Pielou’s equitability indices were 0.2 ± 0.0 for group 1, 0.2 ± 0.1 for group 2, 0.2 ± 0.1 for group 3 and
Table 2. Comparison of species diversity parameters among the four groups identifi ed by cluster analysis (Fig. 2). Index values presented are average ± standard deviation. Superscripts within rows indicate groups that differed signifi cantly from each other (P < 0.05), based on multiple comparisons using a Wilcoxon test with a
Bonferroni correction.
Figure 2. Cluster analysis dendrogram of plant communities from 35 quadrats in seven study sites in western Mongolian steppe. The species names shown are the indicators for each division.
Group 1 2 3 4
Species richness (no. of species) 11.2 ± 0.8a 10.1 ± 4.8ab 10.9 ± 1.9a 4.2 ± 1.1b
Shannon’s diversity index (H’) 1.9 ± 0.5ab 1.5 ± 0.6a 2.3 ± 0.6b 1.4 ± 0.5a
Simpson’s diversity index (D) 0.8 ± 0.2ab 0.7 ± 0.2a 0.9 ± 0.1b 0.7 ± 0.2ab
Pielou’s equitability index (J) 0.2 ± 0.0a 0.2 ± 0.1a 0.2 ± 0.1ab 0.3 ± 0.1b
0.3 ± 0.1 for group 4. This index for group 4 was signifi cantly higher than that for groups 1 and 2 (P < 0.05).
Biomass and plant volume were signifi cantly correlated at all study sites (Table 3), allowing the estimation of biomass in each quadrat. Average estimated biomass was 42.2 ± 28.3 g m-2 at all study sites. Maximum estimated biomass was 122.0 g m-2 at site 5, and minimum estimated biomass was 5.9 g m-2 at site 4. Group-specifi c estimated biomass was 76.2 ± 33.3 g m-2 for group 1, 34.2 ± 20.7 g m-2 for group 2, 39.7 ± 27.4 g m-2 for group 3 and 30.2 ± 15.5 g m-2 for group 4 (Table 2). Estimated biomass was not signifi cantly
different among the four groups (P = 0.140). The relative dominance pi (based on plant volume) of the four plant functional types, two photosynthetic pathways and fi ve palatability classes for each of the cluster analysis groups is shown in Table 4. In total there were 32 species of perennial forbs, six species of perennial grasses, fi ve species of annual forbs, three species of shrubs, and two unidentifi ed species. In all four groups, more than 90% of plant volume comprised perennial grasses or perennial forbs. Perennial grasses constituted 81.4% of plant volume in group 1 quadrats, and perennial forbs constituted 10.8%.
S. krylovii (55.6%) and Agropyron cristatum
(20.1%) were the dominant perennial grasses. The percentages of perennial grasses and perennial forbs in group 2 quadrats were 85.4% and 13.4%, respectively. S. krylovii (37.0%) and K. cristata
(33.6%) were the dominant species for this group. For group 3, perennial grasses and perennial forbs made up 59.3% and 37.7% of the species, respectively. The dominant perennial grass species were S. gobica (23.7%) and S. krylovii
(16.5%). Artemisia frigida (13.5%), Gypsophila desertorum (6.6%) and Ajania achilleoides
(4.8%) were the dominant perennial forbs for this group. Perennial grasses and perennial forbs made up 74.8% and 25.2% of the species in the group 4 quadrats, respectively.The dominant species was
Cleistogenes songorica (57.52%).
In terms of photosynthetic pathways, there were 44 C3 species and four C4 species in the study sites. The C4 species were A. brevifolia, Kochia prostrata, Salsola collina and C. songorica. All four groups included both C3 and C4 species. C3 plants were dominant in groups 1–3, whereas C4 Table 3. Relationships between biomass (w) and plant
volume (v) at each study site (see Fig. 1 for site names and locations). These relationships were calculated using plant volume (estimated from plant cover and height measurements) and harvested aboveground biomass from one quadrat from each study site (see text for details). The n column gives the number of species used to estimate the relationship. The R2 column gives
the strength of the relationship. The p column gives the signifi cance level of the relationship.
Table 4. Relative dominance (% of plant volume) of plant functional types, photosynthetic pathway and palatability in each of the four groups identifi ed by cluster analysis (Fig. 2).
Site Relationship n R2 p
1 w = 2.22 Ln (v) + 0.09 10 0.643 < 0.01 2 w = 1.26 Ln (v) - 1.1 10 0.484 < 0.05
3 w = 0.01 v1.62 6 0.949 < 0.01
4 w = 0.17 v0.79 12 0.799 < 0.01
5 w = 0.11 v1.21 13 0.399 < 0.05
6 w = 0.04 v + 0.79 17 0.309 < 0.05
7 w = 0.84 Ln (v) + 1.21 13 0.352 < 0.05
Group 1 2 3 4
Plant functional type
Perennial grass 81.4 85.4 59.3 74.8
Perennial forb 10.8 13.4 37.7 25.2
Annual forb 0.2 1.0 0.1 0.0
Shrub 7.7 0.2 2.9 0.0
Photosynthetic pathway C3 98.3 94.7 95.9 19.6
C4 1.7 5.3 4.1 80.4
Palatability
Preferred 67.9 77.7 69.7 76.8
Desirable 22.9 14.3 17.6 4.5
Undesirable 8.8 0.5 5.7 18.7
Not consumable 0.0 0.0 0.2 0.0
plants were dominant in group 4 (Table 4). For groups 1, 2 and 3, C3 species made up 98.3%, 94.7% and 95.9% of species, respectively. However, they comprised only 19.6% of the species in group 4 quadrats. For this group, the most common C3 species was S. gobica (16.9%). The dominant C4 plants for group 4 were C. songorica (57.52%), A. brevifolia (18.0%) and K. prostrata (4.9%).
Palatability information was recorded for 31 species. Of these, ten were classifi ed as preferred, twelve as desirable, eight as undesirable and one as not consumable. The preferred species were mainly Poaceae and were dominant in all groups (Table 4). The ratio of desirable to undesirable species for group 4 was reversed in comparison to the other three groups, where desirable species comprised 22.9%, 14.3% and 17.6% of total species, respectively. The most dominant of these was A. cristatum (20.1%, 8.4% and 8.0% respectively). However, desirable species made up only 4.5% of species in group 4. For groups 1–3, undesirable species comprised 8.8%, 0.5% and 5.7% of the total species, respectively, and only 18.7% in group 4. The dominant undesirable species for group 4 was A. brevifolia.
Discussion
In this study, we defi ned plant communities in the western Mongolian steppe using several indicator species. The Poaceae family, which is highly palatable to livestock, was found to be dominant in this region. The Stipa genus in particular is common in Mongolia. In western Mongolia, we observed three Stipa species: S.
krylovii, S. gobica and S. glareosa. The latter two species occur in dry conditions (Grubov, 2001), but S. krylovii prefers a more humid environment (Ronnenberg et al., 2008). Their presence can therefore, be used as an indicator of the level of aridity at our study sites. S. krylovii was observed in quadrats of groups 1, 2 and 3, and one or both of
S. gobica or S. glareosa were observed in quadrats of groups 2, 3 and 4. This suggests that site 4 (group 1) is relatively humid, and site 3 (group 4) is relatively arid. C4 plants were dominant at site 3 (group 4), whereas the opposite was true for the other groups. The photosynthetic pathway used by C4 plants enables them to cope better with high temperatures than C3 plants. The ratio of C4 plants therefore, increases in arid areas such as desert steppe. In particular, Cleistogenes songorica
was dominant at site 3. This species has a high drought tolerance and is common in Mongolian desert steppe (Zhang et al., 2011). However, site 3 is close to sites 4, 5 and 6 (Fig. 1), each of which was allocated to a different group by the cluster analysis. This suggests that differences in species composition at these sites are not related to climatic conditions. Instead, they are more likely to be driven by local environmental factors. In the Inner Mongolian steppe, the genus Cleistogenes
is an indicator of overgrazing (Kawanabe et al., 1998; Liang et al., 2002). This implies that the dominance of Cleistogenes at site 3 is an effect of grazing intensity. In this study it was not possible to measure grazing intensity at the study sites. We have, however observed the effects of grazing elsewhere in western Mongolian steppe (unpubl. data).
Plant communities were assessed both quantitatively and qualitatively in this study. Quadrats at site 4 (group 1) had a relatively high estimated biomass, mainly composed of S. krylovii, which is highly palatable for livestock. This suggests that the plant community at site 4 has a relatively high rate of productivity and constitutes a good quality biological resource in the study area. The plant communities at sites 1 and 6 (group 2) were also dominated by S. krylovii, but the estimated biomass was lower than at site 4. Species diversity was lower than at other sites, and we considered the condition of the steppe to be poorer than at site 4. The majority of the biomass at sites 2, 5 and 7 (group 3) was contributed by
3 (group 4) had a low biomass, but this biomass was mainly composed of C. songorica, which is also highly palatable for livestock. There was, however, a low ratio of desirable species, and a relatively high ratio of undesirable species. This was mainly due to the high proportion of Anabasis brevifolia, which is relatively unpalatable for livestock, although it is a C4 plant and well adapted to arid environments. If overgrazing occurs at site 3, palatable species such as C. songorica and S. glareosa will decrease in abundance. Avoidance of overgrazing in this plant community is therefore recommended.
Conclusion
This study examined plant community structure and productivity in the western Mongolian steppe. Species composition was found to be determined by local environmental factors. Western Mongolian steppe plant communities are characterized by low productivity, which is caused by aridity. It is nevertheless possible to use these communities for livestock grazing, but the condition of some communities may deteriorate if subjected to overgrazing. Dominant species in the study area were S. krylovii, S. gobica and
C. songorica, all highly palatable for livestock. As a result, overgrazing is likely, which would lead to degradation of the steppe. To ensure the sustainable use of biological resources in arid areas, land-use plans should be based on these and similar results. Knowledge of potential productivity can enable local stakeholders will be able to design appropriate rangeland management plans.
Acknowledgements
This work was supported by JSPS KAKENHI Grant Number 19405045.
References
Bai, Y., Han X., Wu, J., Chen, Z. & Li, L. 2004. Ecosystem stability and compensatory effects in the Inner Mongolia grassland. Nature, 431:
181−184.
Davies, J., Poulsen, L., Schulte-Herbrüggen, B., Mackinnon, K., Crawhall, N., Henwood, W.D., Dudley, N., Smith, J. & Gudka, M. 2012. Conserving Dryland Biodiversity. IUCN
Publication Unit Nairobi, xii +84 pp.
Dai, A., Trenberth, K.E. & Qian, T. 2004. A global dataset of Palmer Drought Severity Index for 1870–2002: Relationship with soil moisture
and effects of surface warming. Journal of
Hydrometeorology, 5: 1117-1130.
Damiran, D. 2005. Palatability of Mongolian Rangeland Plants. Oregon State University Oregon.
Fernandez-Gimenez, M. & Allen-Diaz, B. 2001. Vegetation change along gradients from water sources in three grazed Mongolian ecosystems.
Plant Ecology, 157: 101-118.
Flombaum, P. & Sala, O. E. 2008. Higher effect of plant species diversity on productivity in
natural than artifi cial ecosystems. Proceedings
of the National Academy of Sciences, 105: 6087-6090.
Fujita, N. & Amartuvshin, N. 2013. Distribution pattern of vegetation as a fundamental factor
in Mongolian ecosystem. The Mongolian
Ecosystem Network (Yamamura, N., Fujita, N. & Maekawa, A. Eds.), pp. 23-32, Springer Tokyo.
Gibson, D. 2009. Grasses and Grassland Ecology. Oxford University Press, New York.
Grubov, V. I. 2001. Keys to the Vascular Plants of Mongolia. Science Publishers New Hampshire. Hayes, G. F. & Holl, K. D. 2003. Cattle grazing impacts on annual forbs and vegetation composition of mesic grasslands in California.
Conservation Biology, 17: 1694-1702.
Hill, M. O. 1979. TWINSPAN. a FORTRAN program for arranging multivariate data in an ordered two−way table by classifi cation of the individuals and atributes. Cornell University New York.
Hughes, J. B. & Roughgarden, J. 2000. Species
diversity and biomass stability. The American
Naturalist, 155: 618-627.
Kawanabe, S., Nan, Y., Oshida, T., Kou, Z., Jiang, D., Takada-Oikawa, N. & Mukaiyama, S.i. 1998. Degradation of grassland in Keerqin
sandland, Inner Mongolia, China. Grassland
Science, 44: 109−114.
Laliberte, A. S., Rango, A., Havstad, K. M., Paris, J. F., Beck, R. F., McNeely, R. & Gonzalez, A. L. 2004. Object-oriented image analysis for mapping shrub encroachment from 1937
to 2003 in southern New Mexico. Remote
Sensing of Environment, 93: 198-210.
ecology and growth patterns of Cleistogenes species in degraded grasslands of eastern Inner Mongolia, China. Journal of Applied Ecology,
39: 584−594.
Licitra, G., Carpino, S., Schadt, I., Avondo, M. & Barresi, S. 1997. Forage quality of native
pastures in a Mediterranean area. Animal Feed
Science and Technology, 69: 315-328.
Liu, X. Q. & Wang, R. Z. 2006. Photosynthetic pathway and morphological functional types in the vegetation from North-Beijing agro-pastoral ecotone, China. Photosynthetica, 44: 365-386.
Mendsaikhan, S., Gerelt-Od, G., Erdenesuren, B., Ganbat, B., Bajiikhuu, H. & Oidovdansan, R. 2010. Mongolian Statistical Yearbook. National Statistical Offi ce of Mongolia. Ulaabaatar.
Nakamura, T., Go, T., Wuyunna. & Hayashi, I. 2000. Effects of grazing on the fl oristic composition of grasslands in Baiyinxile,
Xilingole, Inner Mongolia. Grassland Science,
45: 342−350.
Naveh, Z. & Whittaker, R. H. 1980. Structural and fl oristic diversity of shrublands and woodlands in Northern Israel and other Mediterranean areas. Vegetatio, 41: 171-190.
Penfound, W. T. & Howard, J. A. 1940. A phytosociological study of an evergreen oak forest in the vicinity of New Orleans,
Louisiana. American Midland Naturalist, 23:
165-174.
Pielou, E. C. 1969. An Introduction to Mathematical Ecology. Wiley–Interscience, New York, NY.
Ronnenberg, K., Wesche, K. & Hensen, I. 2008. Germination ecology of Central Asian Stipa spp: differences among species, seed provenances, and the importance of fi eld
studies. Plant Ecology, 196: 269-280.
Shannon, C. E. 1948. A mathematical theory of
communication. Bell. Labs. Tech. J., 27: 379–
423.
Simpson, E. H. 1949. Measurement of diversity.
Nature, 163: 688.
Tobler, M. W., Cochard, R. & Edwards, P. J. 2003. The impact of cattle ranching on large-scale vegetation patterns in a coastal savanna in Tanzania. Journal of Applied Ecology, 40: 430-444.
Tsendeekhuu, T. & Black, C. C. 2005. Environmental adaptations of the Gobi desert plants in Mongolia - an axample of C4-plants. In Retzer, V. & Stubbe, M. (eds): Martin-Luther-Universit$t Halle, Wittenberg, pp. 193-198. Wang, R. Z. 2004a. Photosynthetic and
morphological functional types from different steppe communities in Inner Mongolia, North
China. Photosynthetica, 42: 493-503.
Wang, R. Z. 2004b. Photosynthetic pathways and life form types for native plant species from Hulunbeier Rangelands, Inner Mongolia,
North China. Photosynthetica, 42: 219-227.
Westoby, M. Walker, B. & Noy-meir, I. 1989. Opportunistic management for rangelands not
at equilibrium. Journal of Range Management,
42: 266-274.
Wuyunna., Cheng, Y., Okamoto, K. & Taniyama, I. 2004. Structural changes in steppe vegetation community according to grazing gradient in semiarid regions of Inner Mongolia, China.
Journal of Japanese Agricultural Systems Society, 20: 160-167.
Zhang, J. Y., John, U. P., Wang, Y. R., Li, X., Gunawardana, D., Polotnianka, R. M., Spangenberg, G. C. & Nan, Z. B. 2011. Targeted mining of drought stress-responsive genes from EST resources in Cleistogenes songorica. Journal of Plant Physiology, 168: 1844-1851.