HEALTH RISK ASSESSMENT BASED ON ANTHROPOMETRIC
INDICATORS IN MEN IN NEW BELGRADE
Stankovic Veroslava
,
1Nikolic Maja
2 1Higher Education School of Professional Health Studies in Belgrade, Belgrade, Serbia 2
Faculty of Medicine Nis, Serbia
Primljen/Received 8. 10. 2013. god. Prihva}en/Accepted 17. 11. 2013. god.
Abstract:Introduction:There is little data on the association of metabolic syndrome and health status in Serbian men, so our intention was to investigate the prevalence of the metabolic syndrome in men with no history of diabetes or cardiovascular disease in New Belgrade, Serbia; to determine which of the anthropo-metric parameters (body mass index — BMI and waist circumference — WC) is best for the evaluation of he-alth risks in primary care, especially the risk factors for metabolic syndrome.
Research Methods and Procedures: The study involved 132 healthy men ages 44.73 ± 9.37 years. An-thropometric values were measured in all the patients. Blood pressure, blood biochemistry (high-density li-poprotein-cholesterol, low-density lipoprotein-choles-terol, triglycerides, blood glucose) and analysis of their medical records were also done. Analysis of consis-tency has been used in testing hypothesis.
Results: The sample consisted of 132 patients with mean age 44.73 ± 9.37 years. The prevalence of the metabolic syndrome was 44.7%. Analysis of consi-stence showed differences in the combined predictive ability of anthropometric indicators and other factors of MetS.
Conclusions:BMI and WC are the simple measu-res of adiposity most strongly associated with metabo-lic abnormalities. Our findings suggest that WC can not be used as a complementary measurement to iden-tify health risks in any group of men.
Key words:Health Risk, Waist circumference, Body mass index, Metabolic syndrome.
INTRODUCTION
MetS is a group of related risk factors (metabolic factors) that lead to atherosclerotic cardiovascular dis-ease and type 2 diabetes. The dominant risk factors for
MetS are abdominal obesity and insulin resistance, ot-her conditions that affect are: physical inactivity, ag-ing, hormonal disorders (1, 2, 3).
It turned out that abdominal obesity accompany-ing metabolic and cardiovascular disorders in the MetS. This can be explained by varying the magnitude of the enzymes involved in lipolysis, triglyceride syn-thesis and secretion of adipokines in different parts of the body fat. In addition to fat, triglycerides, ectopic deposition in all tissues, especially the liver, muscle and pancreatic ß-cells, where they can express their li-potoxicity. This effect is manifested as hepatic steato-sis, dysfunction and apoptosis of pancreatic ß-cells. Besides lipotoxicity triglycerides lead to insulin resis-tance in hepato-and myocytes (1, 2, 3).
In recent years, there has been increasing specula-tion which measure of overweight and obesity is the best to discriminate those individuals who are at incre-ased cardiovascular and metabolic risk. Population-ba-sed, cross-sectional, and prospective studies clearly es-tablish that body mass index (BMI) and waist circum-ference (WC) are predictors of cardiovascular disease and type 2 diabetes (1–5). Body mass index (BMI) is used by the World Health Organization to define sever-ity of overweight and obessever-ity across populations (1, 2, 3). The latter observation is consistent with a large body of evidence implicating abdominal obesity, in particular visceral fat, in the pathogenesis of numerous metabolic risk factors. But increasingly, measure of central adiposity, waist circumference (WC), has been adopted as more accurate predictor of obesity-related cardiovascular risk and have replaced BMI in several definitions for clinical diagnosis of metabolic syndro-me (1, 2, 3).
prevalence of the metabolic abnormalities increased with increasing waist circumference. If a BMI ³ 30 kg/m2, it indicates the presence of central obesity and WC is not need to be measured (5, 6, 7).
There is no data on the prevalence of metabolic syndrome among middle aged Serbian men. It is very important to set up a study on the health men with a risk of metabolic syndrome. The present study aimed to as-sess the metabolic syndrome among men in New Bel-grade, Serbia and to determine which of the anthropo-metric parameters (body mass index and waist circum-ference) is best for the evaluation of the risk factors for metabolic syndrome in men in primary care.
The null hypothesis is that the waist circumferen-ce is not the best anthropometric predictor of metabolic syndrome in men.
MATERIAL AND METHODS
This cross-sectional study was performed in the Preventive center “New Belgrade”, in period Septem-ber–October 2007. The study was conducted on 132 men, mean age 44.73 ± 9.37 years, who were on a regu-lar systematic review. After the analysis of medical re-cords, we excluded examinees with diabetes and CVD. The participants gave informed consent before ta-king part and the authors followed the World Medical Association’s Declaration of Helsinki.
In the examined groups clinical examinations we-re performed including blood pwe-ressuwe-re measuwe-rement, as well as blood biochemistry, and evaluation of an-thropometric parameters, nutritional status, and meta-bolic risk factors.
Anthropometric measurement of waist circumfer-ence was taken for each subject as half way between costal arch and iliac crest on the median axillary line. A ribbon made of non-stretching plastic was used, placed parallel to the base, with a patient in an upright posi-tion, with arms by the body. The measurements were recorded in centimeters.
Height and weight were measured by anthropo-metry and medical scales with sliding weight accord-ing to standard procedure Š8¹. From these values, BMI was calculated as recommended by the World Health Organization (WHO). According to the nutritional sta-tus the subjects were divided into three groups: group 1 — optimally nourished (BMI = 18.5 to 24.9 kg/m2), group 2 — overweight (BMI = 25.0 to 29.9 kg/m2); group 3 — obese (BMI³30.0 kg/m2).
Blood pressure was measured in a sitting position on patient’s left hand, taking the average of three mea-surements, according to the standard procedure recom-mended by the AHA (American Heart Association) (8).
Evaluation of metabolic risk factors included the determination of fasting blood glucose, total
choleste-rol, LDL-C, HDL-C and triglycerides. A venous blood sample was collected from each respondent who came in the morning after 8 to 12 hours an overnight fasting. Blood glucose concentration was determined by the oxidation of glucose (glucose analyzer Beckman Coul-ter). Triglycerides, total cholesterol, HDL-C and LDL-C were determined by chromatography (accessories Bo-eringher Mannheim). Reference values for serum lipid profile and fasting glucose were determined on the ba-sis of IDF diagnostic criteria for MetS (1, 2, 3).
Definition of metabolic syndrome
The International Diabetes Federation (IDF) diag-nostic criteria for metabolic syndrome (1, 2, 3) are li-sted as following:
WC higher than 80 cm in women or WC higher than 94 cm in men plus 2 or more of the following:
a. Low HDL cholesterol with values equaling or lower than 1.03 mmol/L for men and 1.29 mmol/L for women or under treatment;
b. Hypertriglyceridemia with values higher than 1.7 mmol/L or under treatment;
c. Arterial hypertension with values equaling or higher than 130/85 mm Hg, or under treatment;
d. Fasting hyperglycemia with values equaling or higher than 5.6 mmol/L, or under treatment.
inclu-ded in multivariate regression models. Using the met-hod step by step backwards (Backward Wald) from the multivariate model were excluded all those factors who-se impact was not statistically significant.
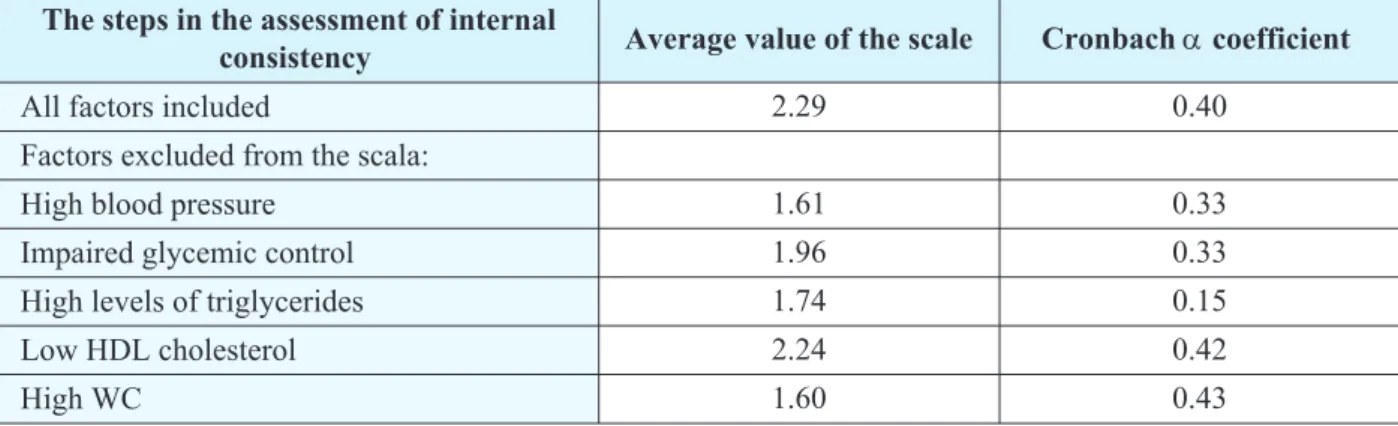
All factors of the metabolic syndrome may be ob-served as a dichotomous variable and we can form an additive scale The analysis of the value of this scale can be determined, what factors, in addition to an increased waist circumference, contribute most to the occurrence of metabolic syndrome, based on the calculation of Cronbach’s alpha coefficient of internal consistency.
All P values were based on two-sided tests with a significance level of 0.05.
RESULTS
Characteristics of examinees
The study included 132 men, who were on a regu-lar systematic review. The mean age was 44.73 ± 9.37 years (range 35–54 years, median 44.5 years). Basic characteristics of study group and the level of metabo-lic risk components are shown in Table 1.
The prevalence of the metabolic syndrome in study group, according to the IDF was 44.7%. Of all men, most were overweight; 68.9% had a waist cir-cumference equaling or higher than 94 cm, 67.4% had high blood pressure; 55.3% had high value of triglycer-ides. Less than 50% of study subjects had abnormal va-lues of another metabolic risk factors (Table 2).
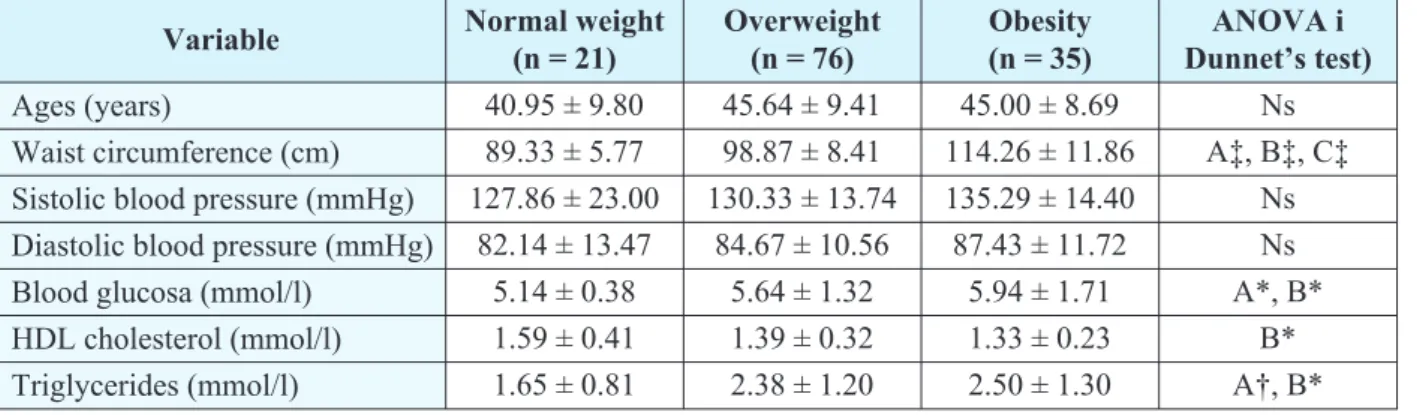
Normal-weight subjects were younger; had signi-ficantly lower blood glucose and triglycerides, than over-weight and obese men (p < 0.05). HDL-C in normal--weight men was higher than in other patients (p < 0.05). WC was significantly increased in parallel with increa-sing BMI (p < 0.001) (Table 3).
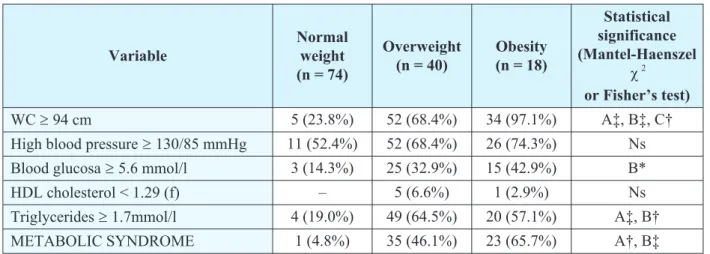
Among subjects with normal BMI, only 5 men had WC³94 cm, but 97.1 % obese men had WC³94 cm. Only one male (4.8%) with normal weight had
metabo-lic syndrome, while the number of people with this syndrome significantly increases with increasing BMI. MetS had 35 (46.1%) overweight and 23 (65.7%) obe-se subjects. If we look at the prevalence of all compo-nents of metabolic syndrome by BMI categories, it is evident that the only statistically significant increase were in WC and triglycerides (Tables 4).
Variable Mean ± SD Ages (years) 44.73 ± 9.37 Waist circumference (cm) 101.43 ± 12.38 Body mass index (kg/m2) 27.79 ± 3.63 Sistolic blood pressure (mmHg) 131.25 ± 15.79 Diastolic blood pressure (mmHg) 85.00 ± 11.41 Blood glucosa (mmol/l) 5.64 ± 1.36 HDL cholesterol (mmol/l) 1.40 ± 0.32 Triglycerides (mmol/l) 2.30 ± 1.20 Table 1.Anthropometric indices, blood pressure, blood glucose and serum lipid levels in study subjects
(Mean ± SD)
Table 2.Prevalence of MetS and the components of MetS in study subjects
Variable n (%)
BMI < 25 kg/m2 21 (15.9%) BMI = 25–29.9 kg/m2 76 (57.6%) BMI³30 kg/m2 35 (26.5%)
WC³94 cm 91 (68.9%)
High blood presure³130/85 mmHg 89 (67.4%) Blood glucosa³5.6 mmol/l 43 (32.6%) HDL cholesterol < 1.04 mmol/l 6 (4.5%) Triglycerides³1.7 mmol/l 73 (55.3%) METABOLIC SYNDROME 59 (44.7%)
Variable Normal weight (n = 21)
Overweight (n = 76)
Obesity (n = 35)
ANOVA i Dunnet’s test) Ages (years) 40.95 ± 9.80 45.64 ± 9.41 45.00 ± 8.69 Ns Waist circumference (cm) 89.33 ± 5.77 98.87 ± 8.41 114.26 ± 11.86 A‡, B‡, C‡ Sistolic blood pressure (mmHg) 127.86 ± 23.00 130.33 ± 13.74 135.29 ± 14.40 Ns Diastolic blood pressure (mmHg) 82.14 ± 13.47 84.67 ± 10.56 87.43 ± 11.72 Ns Blood glucosa (mmol/l) 5.14 ± 0.38 5.64 ± 1.32 5.94 ± 1.71 A*, B* HDL cholesterol (mmol/l) 1.59 ± 0.41 1.39 ± 0.32 1.33 ± 0.23 B* Triglycerides (mmol/l) 1.65 ± 0.81 2.38 ± 1.20 2.50 ± 1.30 A†, B*
A — optimal weight vs overweight; B — optimal weight vs obese; C — overweight vs obese; * — p < 0.05; † — p < 0.01; ‡ — p < 0.001; ns — no significant difference
Relationship between
anthropometric indices and non
adipose metabolic risk factors
The linear correlation coefficients were estimated between anthropometric indices and components of MetS according to the criteria of IDF (Table 5). BMI was showed a significant correlation with body weight, blood pressure, blood glucose and triglyceride levels, while negatively correlated with HDL cholesterol. WC values were significantly associated only with the valu-es of body weight (r = 0.58, p < 0.01) and BMI (r = 0.78, p < 0.01) (Table5).
The influence
of certain factors on the MetS
Changes in the value of the coefficient Cronbach-a were showen that the most important factors of
meta-bolic syndrome in men were higher levels of triglyceri-des (from 0.40 to 0.15), the presence of hypertension (form 0.40 to 033) and abnormal glucose regulation (form 0.40 to 033); whereas increased waist circumfer-ence and lower levels of HDL cholesterol were of less importance (no changes in the value of the coefficient Cronbach-a) (Table 6).
Univariate logistic regression analysis showed that with each year of age the risk of metabolic syndro-me significantly increased by 6% (OR = 1.06, 95% CI). Increasing values of body weight and BMI for one me-asurement units also lead to increased risk. Other fac-tors did not show a significant influence on the devel-opment of the metabolic syndrome in the sample (Ta-ble 7).
When in the regression model as independent va-riables were included all the factors, which in the uni-variate logistic regression analysis were shown a signi-ficant effect on the level of error margin of less than Variable
Normal weight (n = 74)
Overweight (n = 40)
Obesity (n = 18)
Statistical significance (Mantel-Haenszel
c2 or Fisher’s test) WC³94 cm 5 (23.8%) 52 (68.4%) 34 (97.1%) A‡, B‡, C† High blood pressure³130/85 mmHg 11 (52.4%) 52 (68.4%) 26 (74.3%) Ns Blood glucosa³5.6 mmol/l 3 (14.3%) 25 (32.9%) 15 (42.9%) B* HDL cholesterol < 1.29 (f) – 5 (6.6%) 1 (2.9%) Ns Triglycerides³1.7mmol/l 4 (19.0%) 49 (64.5%) 20 (57.1%) A‡, B† METABOLIC SYNDROME 1 (4.8%) 35 (46.1%) 23 (65.7%) A†, B‡
A — optimal weight vs overweight; B — optimal weight vs obese; C — overweight vs obese; * — p < 0.05; † — p < 0.01; ‡ — p < 0.001; ns — no significant difference
Table 4. Prevalence of MetS and it’s individual features stratified by BMI category
Table 5.Correlation coefficients between anthropometric indices and other components for MetS in study subjects
Variable Body height
Body
mass WC BMI SBP DBP
Blood
glucose HDL-C
Trigly-cerides
Ages –0.39† –0.12 0.17 0.12 0.05 –0.01 0.29† 0.05 0.02 Body height 0.57† –0.07 0.07 0.08 0.12 0.01 –0.08 0.05 Body mass 0.58† 0.83† 0.19* 0.23* 0.20* –0.25† 0.24†
WC 0.78† 0.03 0.01 0.11 –0.17 0.13
BMI 0.19* 0.20* 0.26† –0.25† 0.26†
SBP 0.80† 0.08 –0.05 0.30†
DBP 0.07 –0.13 0.30†
Blood glucose –0.06 0.09
HDL-C –0.24†
10% (p < 0.1), the risk of metabolic syndrome was in-creased significantly with each year of age and increas-ing BMI values of 1. Table 8 shows how to modify the risk of metabolic syndrome with each year of age and increasing BMI values.
DISCUSSION
This study comprising 132 adult men aged 35 years and over aimed prevalence of MetS and to com-parative which of the anthropometric parameters (body mass index and/or waist circumference) is best for the evaluation of the risk factors for metabolic syndrome.
Prevalence of MetS
It has been estimated that 20–25% of the world population has MetS (1). In our study, metabolic syn-drome was diagnosed in 59 men (44.7%). Ardern et al. showed that 17% of men in Canada have MetS, while the prevalence MetS in the U.S. among men adults is 24,0% (5, 9). The Sofia Metabolic Syndrome (SMS) study reported preliminary data on high prevalence of
the components of MetS among the citizens of Sofia in both sexes, and a very high percentage of unknown type 2 diabetes, hypertension and hyperlipidemia, and in some countries, like Greece and USA similar preva-lence was also observed for both sexes; in Turkey, In-dia, Iran, African Americans and Mexican Americans women were reported to be much more frequently af-fected, whereas in France and Australia the MetS was found to be more common among men (10). It was re-ported that non-diabetic subjects under 40 years of age had an MetS prevalence of 14–41% (11).
Association of MetS
components and MetS
Distribution of body fat has a direct impact on the occurrence of metabolic disorders that lead to the met-abolic syndrome (1, 2, 3). WC is always the main com-ponent of the diagnostic criteria for the metabolic syn-drome, and also increasingly being proposed as a better predictor of cardiovascular risk than BMI (1, 5).
In people who are optimally nourished and overwe-ight prevalence of metabolic syndrome increases with in-creasing waist circumference. If BMI³30 kg/m2, it po-ints to the existence of central obesity (3, 5, 6, 7). The pre-valence of abdominal obesity in our study was 68.9%. In the group of optimal weight men the prevalence of abdo-minal obesity was 23.8%. In the obese group, 68.4% of men had increased WC, while the abdominal obesity oc-curs in 97.1% of men. In a study conducted by Ardren and colleagues 65% of obese men had values greater than the WC limit values; in the group of overweight 13% of men had high levels of WC (5). Janssen et al have obtai-ned similar findings: increased levels of WC in the opti-mal weight category had 1.0% of men, in the overweight group 27.6% of men, while the prevalence of abdominal obesity in the obese group was 84.8% (12). These data confirm previous studies and show that WC does not need to be measured if BMI³30 kg/m2(5, 6, 7, 13).
The analysis of the frequency of certain compo-nents of MetS, according to the degree of obesity in the Table 6.Analysis of the consistency factor of the metabolic syndrome in study group (Cronbach-acoefficient)
The steps in the assessment of internal
consistency Average value of the scale Cronbachacoefficient
All factors included 2.29 0.40
Factors excluded from the scala:
High blood pressure 1.61 0.33
Impaired glycemic control 1.96 0.33
High levels of triglycerides 1.74 0.15
Low HDL cholesterol 2.24 0.42
High WC 1.60 0.43
Table 7. The influence of certain factors on the development of the metabolic syndrome in men
(Univariate logistic regression analysis)
Factors p OR 95% CI
Ages 0.002 1.06 1.02–1.10 Body height ns 1.01 0.96–1.05 Body mass < 0.001 1.07 1.03–1.11 BMI < 0.001 1.46 1.25–1.71
Table 8.The influence of certain factors on the development of the metabolic syndrome in men
(Multivariate logistic regression analysis)
factors p OR 95% CI
examined men, found that individuals with normal we-ight commonly occurring hypertension (52.4%); in the overweight were OS³94 cm (68.4%), elevated serum triglycerides (64.5%) and high blood pressure (68.4%); while in the group of obese were waist circumference (97.1%), hypertension (74.3%) and elevated serum triglycerides (57.1%). Those results are in agreement with previously reported data (14).
Analysis consistency factor of metabolic syndro-me found that different components influence the oc-currence of MetS in men: high blood pressure; high tri-glycerides, high blood glucose, which is consistent with the expected sexual characteristics, and data from the literature (5).
Ardern et al., in their study showed that the most important factors of MetS in men are high levels of tri-glycerides, high blood pressure and low HDL choleste-rol (6). It is now well established that WC remains a ignificant predictor of type 2 diabetes and cardiovas -cular disease after control for BMI in both men and women. It is often suggested that the ability of WC to predict health risk beyond that predicted by BMI alone is explained by the ability of WC to act as a surrogate for abdominal fat (4). However, it is also observed that the values of WC and BMI as predictors of metabolic abnormalities and clinical manifestations of MetS vary in different populations (ethnic groups) (15).
Correlation between WC, BMI and MetS
In the examined men WC values show a signifi-cant correlation with values of body weight and BMI, while BMI was showed a significant correlation with body weight, blood pressure, blood glucose andtri-glyceride levels, and negatively correlated with HDL. Increasing values of BMI for one measurement units lead to increased risk for MetS and cardiovascular dis-ease. However, studies have shown that both anthropo-metric factors correlated with all 10 risk factors for car-diovascular disease in young adults of both sexes, and in the elderly men these anthropometric factors are cor-related with 8 of 10 risk factors, but whether BMI or WC is a better predictor of cardiovascular (metabolic) risk factors depend on age, as metabolic syndrome de-pends on the age range as showed in our and other stud-ies (1–3, 5, 11,16).
CONCLUSION
Results of our study show that high WC (68.9%) and MetS (44.7%) are present in a high percentage in the study group. According to the coefficient Cron-bach-a, WC is not the best indicator of metabolic he-alth risk in men. But, based on other our results and da-ta from the literature, measurement of waist circumfer-ence by BMI categories can point to men with an incre-ased risk of development of metabolic disorder.
List of abbreviations:
BMI— body mass index CVD— cardio-vascular disease DM 2— type 2 diabetes mellitus
IDF— International Diabetes Federation LDL— low density lipoproteins
HDL— high density lipoproteins MetS— metabolic syndrome WC— waist circumferences
Sa`etak
PROCENA ZDRAVSTVENOG RIZIKA NA OSNOVU ANTROPOMETRIJSKIH
POKAZATELJA KOD MU[KARACA U NOVOM BEOGRADU
Stankovi} Veroslava1, Nikoli} Maja2
1
Visoka zdravstvena {kola strukovnih studija u Beogradu, Beograd, Srbija
2
Medicinski fakultet u Ni{u, Univerzitet u Ni{u, Srbija
Uvod: Veoma mali broj istra`ivanja je ra|eno u Srbiji u cilju povezivanja zdravstvenog statusa i meta-boli~kog sindroma kod mu{karaca, tako da je na{ cilj bio da se ispita u~estalost metaboli~kog sindroma kod mu{karaca bez istoriju dijabetesa ili kardiovaskularnih bolesti u Novom Beogradu, u Srbiji, da se utvrdi koji od antropometrijskih parametara (indeks telesne mase — ITM i obim struka — OS) je najbolje za procena ri-zika po zdravlje u primarnoj zdravstvenoj za{titi, po-sebno faktora rizika za metaboli~ki sindrom.
Istra`iva~ke metode i postupci :Studija je obu-hvatila 132 zdravih mu{karaca uzrasta 44,73 ± 9,37 go-dina. Radjena su antropometrijska merenja, kao i me-renja krvnog pritiska, biohemijske analize (HDL, LDL, trigliceridi, {e}er u krvi) i analiza njihovih zdrav-stvenih kartona. Analiza konzistentnosti je kori{}ena za testiranje hipoteze.
konzistentno-REFERENCES
1. Alberti KG, Zimmet P, Shaw J. The metabolic syndrome a new worldwide definition. Lancet. 2005; 366: 1059–62.
2. Alberti KG, Zimmet P, Shaw J. Metabolic syndrome-a new world-wide definition. A Consensus Statement from the Inter-national Diabetes Federation. Diabet Med. 2006; 23(5): 469–80.
3. Mohan V, Deepa M. The metabolic syndrome in develo-ping countries. Diabetes Voice. 2006; 51(Special Issue): 15–7.
4. Janssen I, Heymsfield BS, Allison BD, KotlerPD, Ross R. Body mass index and waist circumference independently contribute to the prediction of non abdominal, abdominal subcu-taneous, and visceral fat. Am J Clin Nutr. 2002; 75(4): 683–8.
5. Wannamethee SG, Shaper AG, Morris WR, Whincup HP. Measures of adiposity in the identification of metabolic abnorma-lities in elderly men. Am J Clin Nutr. 2005; 81(6): 1313–21.
6. Ardern CI, Katzmarzyk PT, Janssen I, Ross R. Discrimi-nation of Health Risk by Combined Body Mass Index and Waist Circumference. Obes Res. 2003; 11: 135–42.
7. Tamsma J, Jazet I, Beishuizen E, Fogteloo A, Meinders A, Huisman M. The metabolic syindrome: A vascular perspecti-ve. Eur J Intern Med. 2005; 16: 314–20.
8. Lee DR, Neiman CD. Nutritional assessment. 4th ed. Singapore: Mc-Graw-Hill Education; 2007.
9. Ford ES, Giles WH, Dietz WH. Prevalence of metabolic syndrome among U.S.: findings from the Third National Health and Nutrition Examination Survey. JAMA. 2002; 287: 356–9.
10. Kurktschiev TT, Kurktschiev D, Kitova VL, Vaklinova I, Bonov P. High prevalence of metabolic syndrome in populati-ons at high and low cardiovascular risk in Bulgaria. Journal of Diabetology. 2010; 1:2.
11. Isordia-Salas I, Santiago-Germán D, Rodrìguez-Na-varro H, Almaráz-Delgado M, Leaños-Miranda A, Anaya-Gómez F, Borrayo-Sánchez G, Majluf-Cruz A. Prevalence of Metabolic Syndrome Components in an Urban Mexican Sample: Compari-son between Two Classifications. Exp Diabetes Res. 2012; 212: 2025–40.
12. Janssen I, Katzmarzyk P, Ross R. Body mass index, waist circumference and health risk. Arch Intern Med. 2002; 162: 2074–9.
13. Lean ME, Han TS, Morrison CE. Waist circumference as a mesure for indicating need for weight managment. BMJ. 1995; 311: 158–65.
14. Haslam D. Gender specific aspects of obesity. National Obesity Forum. 2005; 2: 179–85.
15. Dobbeisteyn CJ, Joffres MR, MacLean DR, Flower-dew G. A comperativ evaluation of waist circumference, we-ist-to-hip ratio and body mass index as indicator of cardiovascu-lar risk factors. Int J Obes Relat Metab Disord. 2001; 25: 652–61.
16. Ardern CI, Katzmarzyk PT, Janssen I, Ross R. Discri-mination of Health Risk by Combined Body Mass Index and Waist Circumference. Obes Res. 2003; 11: 135–42.
sti je pokazala razlike u mogu}nostima predvi|anja na osnovu antropometrijskih pokazatelja i ostalih faktora MetS.
Zaklju~ci: ITM i OS su jednostavne metode za procenu gojaznosti koje su povezane sa metaboli~kim
poreme}ajima. rizika. Na{i rezultati ukazuju da se OS ne mo`e koristiti kao komplementarno merenje u iden-tifikaciji zdravstvenih za bilo koju grupu mu{karaca.
Klju~ne re~i:zdravstveni rizik, obim struka, in-deks telesne mase, metaboli~ki sindrom.
Correspondence to/Autor za korespondenciju Mr. sc. med. dr Veroslava Stankovi},
spec. ishrane zdravih i bolesnih ljudi Adress: Ul. Pedje Milosavljevi}a 10/14, 11077 Novi Beograd
Tel.: + 381 62 250 675