UDC: 3.33 ISSN: 0013-3264
* University of Belgrade, Faculty of Economics, Serbia, E-mail: [email protected] ** University of Belgrade, Faculty of Economics, Serbia, E-mail: [email protected]. JEL CLASSIFICATION: M41, M48
ABSTRACT: Experts and economic
policy creators debate various economic-growth rates without a direct insight into the capabilities of the diferent economic sectors motivated us to devote this paper to the research of key infrasctructure sector capabilities, both in terms of the economic prosperity of the Serbian national economy and as a support for the development of other sectors. his paper examines the energy, transportation, and telecommunications sectors’ exposure
to short-term and long-term risks, and assesses their inancial strength, investment possibilities, and long-term proitability. We believe that the following results will be a valuable information input for making better strategic decisions and more expedient planning of economic sustainable growth.
KEY WORDS: infrastructure, economic
growth, inancial risks, investments, proitability.
DOI:10.2298/EKA1295007M
Dejan Malinić*
Vlade Milićević**
THE FINANCIAL AND STRUCTURAL
1. INTRODUCTION
Overcoming the economic crisis, and the economic growth to achieve this, imply the presence of a solid foundation for the functioning of the market economy. Creating a legally regulated and favourable business climate is the key prerequisite not only for attracting new investors but also for keeping the old ones. At the same time the stimulation of economic growth should be based on inancially healthy economic segments able to bear part of the load while functioning according to market principles. herefore not all economic sectors will have the same role in achieving economic growth. Economic policy creators oten label certain sectors, such as the processing industry, agriculture, water management, mining, and the construction industry, as crucial to national economic development. hus they oten neglect the signiicance of the infrastructure sectors in the promotion of economic growth. he experience of the countries which have had the highest economic growth rates in recent years shows that the energy, transportation, and telecommunications sectors are, strategically speaking, just as important. hese countries’ strategy to revive their economies has been to promote investment in energy, transportation, and the telecommunications sectors. hese sectors provide energy, logistic, and information support to all the other industries, and favouring them caused a chain reaction, boosting the entire economy and multiplying GDP growth. here are other not so obvious beneits, like the improvement of business processes, increased employment and decreased poverty, a growth in work productivity and consumption, better availability of social services, improved state eiciency, growing concern for the environment, and so on.
the economic policy creators to make proper strategic decisions on a sound and timely basis that will improve economic performance.
2. IMPORTANCE OF INFRASTRUCTURE SECTORS
Infrastructure is usually deined as the combination of services and capacities needed for the undisturbed functioning of the economy and society as a whole. In a broad sense, infrastructure constitutes a set of mutually related structural elements which are both the framework for national economic development and an important factor in evaluating the level of development in countries and/or regions. hese structural elements are usually divided into ‘hard’ and ‘sot’ elements. ‘Hard’ infrastructure elements include the physical components of mutually related systems of goods production and services, which enable, maintain, and improve living conditions in a society. hey include the road network, railways, ports, airports, water supply network, energy sources, sewage system, telecommunication service network, and so on. ‘Sot’ infrastrucure comprises all the institutions responsible for establishing the economic, health, cultural, and social standards in a society. Primarily these include inancial, education, and health-care systems, state governing systems, law enforcement, and emergency service systems. he main goals of encouraging infrastructure development are improved access to services, employment growth, higher productivity, higher mobility of goods and services, facilitated economic cooperation, and environmental protection (specially emphasized at present). herefore adequate investment in infrastructure represents an important assumption of sustainable economic development. Infrastructure investment has a huge inluence on the economic and social indicators of a society’s well being, and therefore is much more evident in undeveloped countries than in developed ones. It is not surprising that there is much international research into the efects of infrastructure and its elements on economic growth and social development. Accordingly, in this paper we chose to deal with the inancial and structural capabilities of key infrastuctural sectors in the economy of the RS. Due to space limitations we opted for the energy, transportation, and telecommunications sectors, recognizing them as key propellers in the stumbling economic activity of the RS. However, before focusing on the RS, it is necessary to be familiar with these sectors’ position in developed economies.
Hence availability, use of existent energy sources and inding of new ones, rational transformation into inal consumption forms, supply stability and use safety, are all crucial to the dynamics of economic growth, society, and the world as a whole. Generally, the economic importance of the energy sector is twofold (World Economic Forum, 2012, pp. 6-10). Firstly, this sector is a modiier of the economic structure in terms of bringing not only faster development to the existent sectors but also enabling the development of new sectors and activities. Secondly, the energy sector is the accelerator of general economic improvement since it encourages large capital investment, eicient and cheap production, employment and consumption growth, and improvement of social standards. However the relative limitation of classical energy sources (oil, gas, coal) on the one hand, and the possibilities of energy supply from renewable sources (water, wind, sun) on the other hand have had a double impact on economic development, promoting the use of alternative energy sources and stimulating the saving and rational management of available energy. Today the achievement of both stated requirements is unimaginable without continuous environmental concern. Bearing all this in mind, energy both stimulates and limits economic growth and social development.
Transportation infrastructure is crucial for economic growth, as well as for the development and wealth of a society. Its importance comes from providing a wide range of necessary intermediary business services. Because transport is essential to almost all economic sectors, developed economies establish safe, widely available, and eicient transportation systems, which facilitate access to existent and new markets, creating added value, employment growth, and labour force mobility and promoting new investment (Garcia, et al., 2008, pp. 3-5) A network of high-quality roads, reliable railways, functional ports, harbours, and airports, by means of saving time and transportation costs, directly encourages the development and improvement of sectors such as agriculture, industry, mining, commerce, and tourism. An eicient transportation infrastructure also has a wider social role. It improves access to and delivery of vital social services like health care and education and thus reduces poverty levels, enabling easier integration into the global economy, especially in undeveloped and developing countries. When transportation infrastructure is limited in capacity and/or less reliable, it causes costs proportional to reduced or missed opportunities in all the ields mentioned above.
he importance of telecommunications in the modern economy is that it is the infrastructure sector which afects other sectors more than any other, afecting GDP growth, total economic prosperity, and development of society as a whole (Zhen-Wei et al., 2009). Nowadays wide access to telecommunication services in most countries increases the level of business-process eiciency and management-process creativity, optimizes management-processes within the energy sector, facilitates access to diferent markets, increases business transparency, enables real-time information exchange, and so on. At the same time new technologies improve health care procedures, increase justice system productivity, enable higher quality education, promote eiciency and economy in the state apparatus, accelerate rural development, etc. Telecommunications is another infrastructure sector strategically important to the development of the national economy and society. herefore providing a stable and growing telecommunications sector is essential to the national interest. With the beginning of the global economic crisis many countries which now have the highest economic growth rates - India, China, Brazil, South Korea, Mexico and Japan - recognized that their strategic path to economic revival lay in investment in the Information and Communication Technology (ICT) sector and in the development of a broadband network to access telecommunication services (International Teleccomunication Union, 2009). From their experience we can learn very important lessons regarding the long-term efects of prompt opportunity recognition in the telecommunications ield, not only for this sector, but for national economy and society as a whole.
3. METHODOLOGICAL FRAMEWORK OF THE ANALYSIS
he fact that infrastructure sector potential has a big impact on GDP growth, both directly and indirectly by afecting the success of other sectors, leads to the conclusion that it is the driving force of national economic development. he evaluation of inancial strength, investment capabilities, and long-term proitability should be an important information input for economic policy creators. Detecting inancial, structural, and other problems limiting growth and future proitability could, by means of raising the quality of strategic decisions, contribute to the improvement of economic performance.
sectors we took only the companies dealing with telecommunication activities, setting aside publishing, ilm and TV production, and radio and TV broadcasting (Uredba o klasiikaciji delatnosti, 54/2010). Henceforth we will refer to this limited range of telecommunication activities as the telecommunications sector, as it deserves the status of an independent sector regarding its parameters. Summary inancial statements for each individual sector (abridged and structured a little diferently from the oicial form) are created from summary inancial statements of the Serbian Business Registers Agency. hese reports are shown on the next page. hey represent the information base for the creation of further reports and numerous indicators. All further statements, calculations, indicators, and graphical reviews were generated by the authors.
hese sectors are very heterogenous, and in addition each of them has a very heterogenous structure. he energy sector includes branches and companies dealingwith production, transport, distribution and trade of electrical power; production, distribution and trade of gas; as well as production and distribution of steam, hot and cold water, and cold air. Within the transportation sector there are companies dealing with passenger services and goods transport by rail, road, waterway, and air, as well as storage services. Finally, the telecommunications sector includes branches and companies dealing with cable, wireless, satellite, and other telecommunication activities. Beside their role as infrastructure support to other sectors, the importance of the energy, telecommunications, and transportation sectors is represented by the fact that in Serbia in 2011 5,812 companies did business in these areas (428 in energy, 4,932 in transportation, and 452 in telecommunications), empoying 140,309 people (Serbian Business Registres Agency).
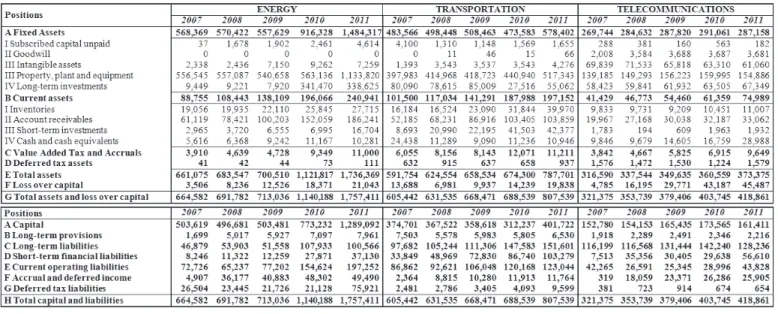
IN F R A S T R U C T U R E S E C T O R S : F IN A NC IA L A N D S T R U C T U R A L C A P A B IL IT IE S 13 in millions
Table 2: Abridged Income Statement
4. ANALYSIS OF SHORT-TERM RISK
To analyse and evaluate the inancial and structural capabilities of key infrastructure sectors it is necessary to know their liquidity positions, i.e., the short-term inancial safety of this economic segment. A thorough understanding of this phenomenon means discussing structural liquidity position and analysing cash low compatibility.
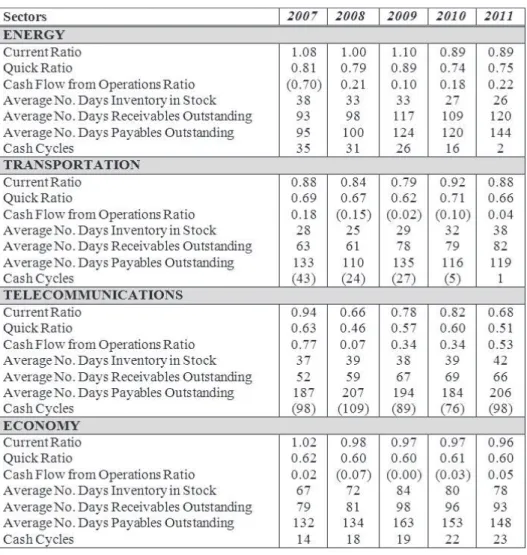
In order to understand the structural liquidity position of the most important infrastructure sectors we will mainly rely on liquidity indicators, turnover indicators, and indicators showing length of cash cycle (Malinić et al., 2013, pp. 83-126). he results of certain indicators are also given for the economy as a whole in order to establish the relative liquidity positon of the key infrastructure sectors (Table 3).
If we irst consider the values of the irst two liquidity ratios we can see that the infrastructure segment of the economy shows no signiicant achievements. he achieved values of the liquidity ratio are declining steadily and, if we compare the shown values to the orientational norms of business practice in developed countries, we will see that they lag far behind. he reported values of current ratio and quick ratio in the entire analysed period are practically half what is necessary to ensure a structural liquidity position. he telecommunications sector is in the worst position. In the transportation sector the situation is slightly better, and it is best in the energy sector, although still far from being considered acceptable in normal circumstances.
Table 3: Indicators of short-term risks
Source: Author’s calculation
Some other details also spoil the picture of an acceptable structural liquidity position. First of all, in the analysed period for all sectors we report faster short-term (current) liability growth compared to growth of investments in current assets. Furthermore, except in energy, and only in the irst few years, the analysed sectors do not manage to provide long-term inancing for any part of current assets. his is why the entire infrastructure segment of the economy is characterized by negative Net Working Capital (NWC) and inancial imbalance, raising the risk of both long-term and short-term inancial instability.
Finally, we should also pay attention to the fact that the average number of days of receivables outstanding to suppliers is steadily growing (Boer, 1999). In the last analysed year it unexpectedly reached almost seven months in the telecommunications sector, almost ive months in the energy sector, and ‘only’ four months in the transportation sector. he epilogue of this story is a negative cash cycle in the transportation and telecommunications sectors, while energy does better owing to a longer number of days of receivables outstanding. At this point we may conclude that the infrastructure sectors follow the achievements of the rest of the economy: along with growing short-term liabilities the transportation and energy sectors transfer the inancing cash cycle, and thus most of the load of maintaining liquidity, to their suppliers. Since in such circumstances many suppliers will not be able to close their cash cycle by usual (mostly short-term) borrowing, the illiquidity problem in our economy creates the efect of a spiral, taking downwards all the companies in the business chain. It is transferred from buyer companies to suppliers, and then from suppliers to subcontractors, and so on, with the illiquidity problem usually most apparent in the last one in the sequence (Malinić & Milićević, 2011).
he current structural liquidity position is not a bright feature of the key infrastructure sectors. However this fact still does not mean that these sectors are basically illiquid. We cannot grasp the inal liquidity position of this economic segment before the analysis of cash inlow and outlow compatibility. To this end we give a brief comparative review of cash lows in Table 4.
coverage of current and total liabilities on the one hand, and coverage of interest costs by realised net cash low from operations on the other hand. Regarding all parameters, the transportation sector lags behind. Only in the irst and last examined years did it manage to achieve a cash excess from business operations; inbetween the transportation sector reported net outlow, which, combined with the damaged structural liquidity position previously discussed, distinguishes this sector in terms of a slightly higher burden of short-term risk.
Table 4: Statements of cash flow
Source: Author’s calculation
future. However, not all sectors are doomed. Energy and telecommunications are among those rare sectors which can boast of harmony regarding operational cash inlow and outlow.
A deeper analysis of the structure of operational cash inlow and outlow provides more facts important to drawing inal conclusions. Firstly, most of the cash low from operations in the energy and telecommunications sectors derives from income statements, i.e., it is mostly realized by selling products and services in the market. Although at irst it may seem that these two sectors are equally successful in this ield, we should underline that the telecommunications sector achieves these results in a fairly liberalized market, while the energy sector works in a closed state-controlled market. he transportation sector lags behind energy and telecommunications in this ield as well. he transportation sector did not manage to achieve a positive cash low from income statements during 2008 when the economic crisis struck hardest. It was similar in 2010, but there was a certain recovery in 2011. However, our analysis will show that the hint of improvement is more the efect of ‘playing’ with the dinar exchange rate than of real business achievement.
Signiicantly worse results are reported in the segment where there are cash inlows and oulows based on changes in current assets and current liabilities. he energy and telecommunications sectors are ahead again, while, especially in this segment, the transportation sector reports quite high net outlows. Unfortunately the general impression is that net inlows in this ield are not the efect of good inventory and receivables management, but of willful prolongation regarding payment of liabilities to suppliers. Prolonging payment of liabilities to suppliers manifoldly improved the segment of cash lows in accounting terms but essentially hides negligence, which these sectors show in terms of liquidity to their own suppliers. here is no need to waste more words explaining how expensive this is in the long term. However, in all the ields, these sectors do not lag behind the recent general trend in our economy of bridging the illiquidity problem at the expense of suppliers.
results in net cash outlows. However, it is particularly important to note that, in the last three years, the telecommunications sector managed to completely cover net outlow from investment operations with realized cash excess from business operations, where this excess more than tripled in the last year. Having in mind the experience of other economic sectors, these achievements of the telecommunications sector could be characterized as extremely good. However, let us point out that we should still be very cautious with such a conclusion, since the stated achievements can indicate a problem of inadequate investment in modernization of existing equipment and purchase of new equipment, which could have a negative efect in the near future on the business operations of companies embracing that practice (Malinić & Milićević, 2012).
In all the mentioned segments, the energy sector lags behind due to extremely high net outlows based on investment operations, particularly in the last few analysed years. In the following discussion we will deal some more with the nature of these intense investment operations, hoping to reveal where they refer to actual investments in modernization and extending capacities, and where they are the result of pseudo investments coming from revaluation. Following earlier explanations it is clear that the transportation sector will be last in this discipline as well, but it reported considerably higher cash outlow based on investment operations in the last two years. Having in mind ‘the situation in the ield’, our expressed concern regarding pseudo investments in the energy sector remains.
All the aforementioned undoubtedly leads to the inal conclusion that key infrastructure sectors share the destiny of the rest of the economy in terms of structural liquidity position. his is mostly the consequence of accelerated short-term indebtedness under extremely inconvenient conditions that this part of economy has also not managed to escape, bringing into question its short-term inancial stability. However, owing to the distinctiveness of the core business, energy and telecommunications manage to alleviate short-term risks considerably through adjusting cash lows, particularly those from business operations, which is why this segment of our economy is still not attractive to new investment.
5. ANALYSIS OF LONG-TERM RISK
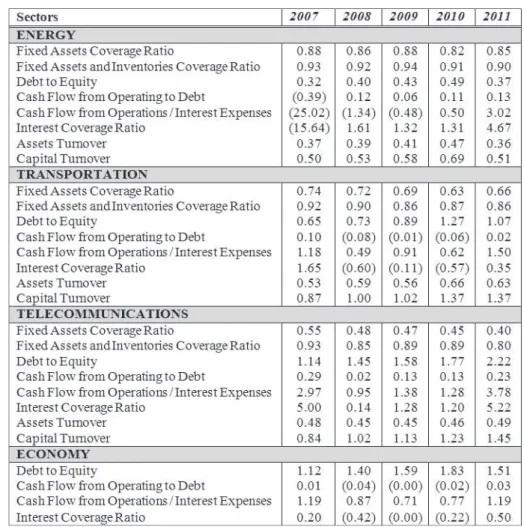
to continue investigating these areas, considering irst the calculated values of typical indicators given in Table 5. We chose only indicators of indebtedness and debt load since they can partially serve as the basis for sector achievement interpretation.
Table 5: Indicators of long-term risks
Source: Author’s calculation
between 75% and 85%. Since we are talking about long-term assets, inancing from ownership capital and/or long-term liabilities is required in order to maintain inancial balance and reduce long-term risk, which we will discuss further on. Also, we may note that in the analysed period investment in ixed assets rises in all sectors. his growth is most apparent in the energy sector, which increased the value of ixed assets by 3.5 times in the analysed period. In the last two examined years this sector almost doubled investment in property, plants, and equipment. However, this is not the result of extending and modernizing production capacities but of an accounting maneuver, i.e., revaluation, which ostensibly also increased the value of this sector’s capital. Transportation and telecommunications are characterized by a considerably smaller growth of ixed asset investment. herefore there is obviously not enough investment in purchase of new equipment and modernization of existing equipment in key infrastructure sectors. his situation is not just damaging to the sectors themselves but threatens the entire economy. By contrast, the developed world has for years been steadily improving infrastructure in terms of innovation, quality, range, content, and a continuous decline in the cost of providing a wide range of infrastructure services, with concentrated investment in up-to-date technology and know-how on the one hand, and stimulation and protection of competitors on the other hand.
Before Interest and Tax (EBIT), which in the last analysed year reached a level acceptable even for much more developed economies than the Serbian economy. It seems that the telecommunications sector deals much better with indebtedness than the other two sectors, where the share of ownership capital in total capital is more than 50%.
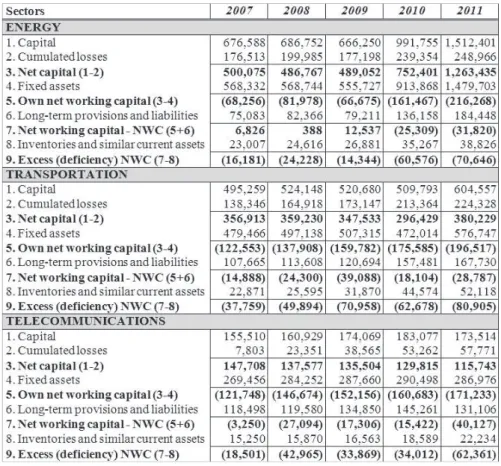
In order to complete the picture of the relative position of disposable ownership capital in key infrastructure sectors it is necessary to look at the irst items of the net working capital statement given in Table 6.
Table 6: Statements of net working capital
Source: Author’s calculation
losses in this sector alone absorbed almost one third of ownership capital. In the transportation and energy sectors cumulated losses rose by 1.6 and 1.4 times respectively. In the transportation sector, on average, a third of ownership capital vanished each year through losses, while in the energy sector it was one quarter. Compared to the beginning of the analysed period, i.e., 2007, net capital value in the telecommunications sector was reduced by slightly more than 22%, in the transportation sector it practically stayed the same, while in the energy sector it rose by more than 250%, which ‘growth’ is due to the efects of revaluation of tangible assets implemented in 2011.
In the above short review of the abridged balance sheet, on the assets side we show the position of loss above the value of capital in order to indicate that there are some companies within the analysed sectors which lost their total ownership capital through business operations. If we start again from 2007, the amount of such losses rose by 9.5 times in the telecommunications sector, by 6 times in energy, and by 1.5 times in transportation. By pointing out these losses we only want to enforce our previous statements regarding the absolute and relative decrease of ownership capital where many long-term creditors traditionally see protection for their receivables.
he logical consequence of all the aforementioned is the fact that the value of net ownership capital was not enough, in any year, to cover long-term or risky investments in ixed assets. In other words, there is a negative own NWC in all key infrastructure sectors. he sectors irst tried to compensate for the lack of own NWC by long-term indebtedness. However, due to high long-term investor risk, it was not enough to bridge the gap in inancing ixed assets. herefore negative NWC is typical for the analysed sectors, except energy, which, until 2010, managed to use a small part of long-term capital to inance current assets. he sectors provided a missing part of capital for inancing ixed assets by short-term indebtedness which was particularly the case in the last two analysed years. To make things worse, all sectors aimed much more for short-term than for long-term indebtedness, thus additionally increasing the cost of total capital use.
capacity within the sectors. For example, in 2011 the energy sector managed to increase revenues by about 20% compared to 2010, the telecommunications sector by 9%, and the transportation sector by only 5%. Bearing in mind the growth of direct and indirect costs, the high cost of using borrowed capital, and the growth of the dinar exchange rate and the resulting foreign exchange losses, it is obvious that the current level of operating activities cannot provide an adequate level of revenue proitability.
he damaged inancial structure of the key infrastructure sectors is the source of numerous short-term and long-term risks. However, we must not forget that one of the main features of the infrastructure sectors is the domination of ixed assets. his means that it will be hard to provide adequate capital for inancing our economy even in conditions radically better than current ones. Even then, indebtedness is the likeliest option. However, since the growth of indebtedness itself does not mean a priori the decline in infrastructure sector performance, it is necessary to it a few more important details into our mosaic in order to arrive at a inal conclusion: the analysis of proitability, of the efects of inancial leverage, and of investment possibilities.
6. PROFITABILITY ANALYSIS
Proitability is one of the key determinants of the success of business entities, branches, sectors, and the national economy. It is one of the indicators of the capacity to create return for owners, and as such it represents the driving force in market-oriented economies. he fact that reporting income is possible only ater providing real expenses coverage indicates that proitable companies (branches, sectors) automatically provide maintenance of previously invested capital as a minimum prerequisite for survival. At the same time proitability is a basis for growth, since internally created sources provide inancing of proitable projects on a sound basis. Proitability determines the attractiveness of the company to potential investors (owners and creditors). Satisfactory proitability provides safety to creditors and a desired return to owners. By recognizing proitable companies, branches, and sectors, the risk of negative selection (which investors are exposed to if they sell their equity inadequately) is reduced (Malinić, 2007, pp. 19-27).
and structural problems, brings survival into question, increases investment risk, and discourages investors. Hence the analyses of income and loss structure shown in Fig. 1 represent the basis for a thorough analysis of the proitability of infrastructure sectors. We chose a graphical display because absolute amounts of certain result concepts are already contained in the previously displayed abridged income statements.
Figure 1: Analysis of income structure
Source: Author’s calculation
the level of revenues) in the other analysed years. A particular problem is that in 2011 operating income falls in both sectors, despite the growth of operating revenues. he unproitability of the core business is very worrying. It may result from an inadequate level of operations, inadequate prices, or ineicient cost management. Having in mind the characteristics of these sectors, we believe it is the result of a joint action of all these factors. Finally, the proit performances of the telecommunications sector are better than in the other two analysed sectors. However, we should not forget that the potential for success is greatest in the telecommunications sector. Again, it posits the question of the suiciency of reported incomes in this sector, which we will discuss later.
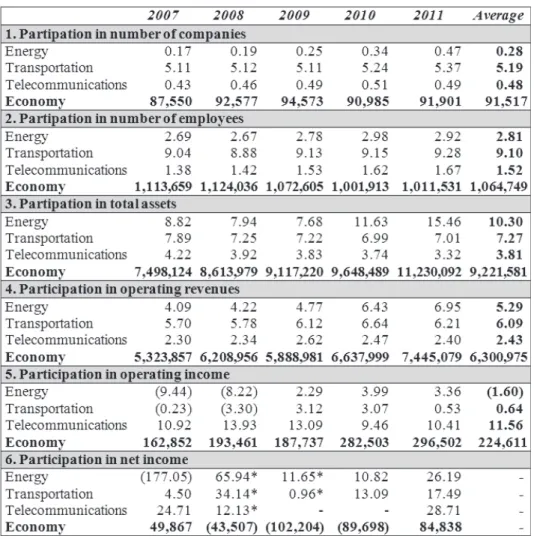
A comparative analysis of these sectors’ proportions (measured by number of companies and employees, operating assets and operating incomes) and their proit achievements will help to get a bigger picture of the importance and position of the analysed sectors in the national economy. he analysis is given in Table 7.
he information given in the previous review conirms once again the heterogeneity of the analysed sectors, regarding both their size and their performance. he telecommunications sector’s share in the number of companies (0.48% on average for the whole period), number of employees (1.52% on average), operating assets (3.81% on average), and operating revenues (2.43% on average) is very modest and in the same proportions as in the economy as a whole. However, the reported proit potential of this sector is the biggest. Its share in total operating income is 11.56% on average, and share in total net income of the economy (in the years when the economy did not report net losses) is as high as 24.71% in 2007 and 28.71% in 2008.
Table 7: Positioning of infrastructure sectors in Serbian economy
*Share in losses
Source: Author’s calculation
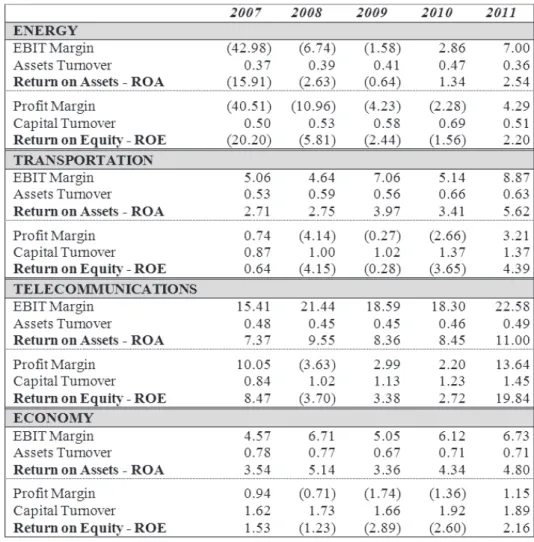
Return On Assets (ROA), as the ratio between Earnings Before Interest and Tax (EBIT) and average operating assets, and Return On Equity (ROE), representing the ratio between net income and average equity. he irst represents the measure of total asset proitability, independent of ownership structure of inancing sources, being an indicator regarding servicing of credit liabilities. he second is a relection of achieving ownership interests. Movement of these return rates among sectors and in the economy as a whole in their decomposed versions (as a result of proper income proit margin and turnover ratio) is shown in Table 8.
Table 8: Quantitative analysis of return rates
We will get a better picture regarding the position of the various sectors within the achievements of the total economy by using a graphical display of ROE and ROA movement (Fig. 2). On the one side we will follow the movement of ROE and ROA among sectors (in the form of studs), while on the right side we will follow the movement of return rates in the entire economy.
Figure 2: The Analisis of ROA and ROE
Source: Author’s calculation
it can hardly be a serious support to growth and development of the other sectors and the Serbian economy as a whole.
he ineiciency of asset and capital management is common in all sectors, which is indicated by very low turnover ratios. In all sectors asset turnover and equity turnover are below the average of the economy. his is particularly the case in the energy sector where the average asset turnover for the whole analysed period is only 0.4, and the average equity turnover is 0.56. It is obvious that existing assets do not create enough revenue to increase the turnover and proit margin, and thus a return on assets. hings are not any better at the eiciency level. Gross operating margins (ater coverage of direct material costs and cost of merchandise sold are very modest in the transportation and energy sectors. On average the share of direct material costs and the cost value of sold goods is almost 52% in the transportation sector, while at 67% it is even more unfavourable in the energy sector. Expanding the range of activities and more eicient cost management is necessary. A deeper analysis of return on equity will follow later.
7. COST OF CAPITAL AND FINANCIAL LEVERAGE
Another important element, which is for the most part uncontrollable but has a considerable inluence on performance, is the cost of debt. Positive results in the core business are oten converted into net losses due to the high cost of debt. he analysis of these expenses’ movement in certain years is very interesting. Since we are analysing one sector, we will calculate cost of debt from the ratio between inancial expenses and average long-term and short-term inancial liabilities. Interest costs will be included in these calculations, as well as the efects of exchange diferences and the currency clause. Fig. 3 shows the cost of debt (on the let) and of the dinar exchange rate (on the right).
Figure 3: Cost of debt analysis
Source: Author’s calculation
he analysis shows that in 2011 the reported net incomes were not the result of a considerable improvement of core business proitability in any sector. he greatest inluence on performance improvement within some sectors was the decrease of inancial expenses. In the telecommunications and energy sectors they are 50% lower than in 2010 and in the transportation sector 25% lower. Without discussing the reality of the reported dinar stability in 2011, it is clear that net incomes as the result of decreasing inancial expenses in 2011 are unsustainable. he performance of all the analysed sectors must sufer a great shock in 2012, especially in terms of exchange diferences and the efects of the currency clause. It is obvious that monetary stability and the related cost of the debt level are serious problems to which economic policy creators should pay more attention.
he complexity of the inluence of cost of debt on inancial performance becomes even greater if we consider the option given by the Ministry of Finance (the opposite of the requirements in International Accounting Standards and International Financial Reporting Standards) that exchange losses can be accruable. he efects of these accruements are not immediately seen in balances, but, inevitably, they will at irst unduly reduce the pressure on income statements before reappearing in income statements with the expiration of the loan they refer to. It is also inevitable that this action will additionally blur the picture of the real performance of individual sectors, since the balance sheet will contain hidden losses.
Such pressure, along with insuicient proitability of the core business, means that ownership returns are small or nonexistent. It is particularly important to emphasize this in light of the fact that the capability to create returns for owners is crucial in attracting new investors. A more explicit understanding of the causes of the mostly insuicient return on equity demands its deeper disaggregation, for which the four-component rate of return on equity given in Fig. 4, provides a sound information base.
A disaggregated ROE rate provides wider options for drawing conclusions. Here there are some very important relevant issues.
Figure 4: Four-component disaggregation of ROE
Source: Author’s calculation
of the inluence of inancing efects. Since the cost of debt is put aside, it is logical that ROA is dominantly determined by operating and investment activities, and accordingly by business risk. herefore business risk is determined by potential variations in return on assets. Accordingly it is related to the variations in asset turnover and proit margin.
hirdly, extremely low ratios of asset turnover (much lower than the average of the economy in every sector) conirm that these sectors are capital-intense. As a rule, ixed costs are high in such sectors (in this case the telecommunications sector is a good example), meaning that we should look for a proitability increase in expanding the range and consequently in unit ixed cost decrease . It is known that proit margins are more sensitive to changes in sale levels in places where the share of ixed costs is higher. In other words, high ixed costs direct us to the presence of greater operating leverage (Stickney et all., 2007, pp. 207-211). he problem is even more evident in sectors with higher asset inlexibility (it cannot be diminished easily with a fall in activity). In that case stagnation or a decrease in revenues, by means of low turnover and small margins, prevents a considerable increase in proitability. One solution is new investment, which will have a much higher return strength.
Fourth, high capital intensity limits competition, which, according to economic theory, should lead to higher income rates (Seling & Stickney, 1989). In the case of infrastructure sectors we have a rather speciic situation. On the one hand there is the telecommunications sector where there has been considerable improvement in opening markets and raising competition. However, proit margins are relatively high due to high proit potential. On the other hand there is the energy sector with a typical monopolistic position, but with a negative EBIT margin in the irst three years. A part of the problem is eiciency, but we believe that the bigger problem is price.
partially in 2007 and 2011 in the telecommunications sector and in 2011 in the energy sector) are more than modest. he high cost of debt is a key determinant of inancial risk. herefore if inancial expenses luctuate, inancial risk is higher. Rapid increase of these expenses reduces return, and vice versa. hat is the case in the Serbian economy. Due to exchange diferences and the currency clause, inancial expenses luctuate, which leads to higher inancial risk.
We will draw a inal conclusion concerning the analysed sectors’ proitability by considering the efects of indebtedness. It is known that proitable companies are characterised by ROE exceeding ROA. his is a sign that ROA is higher than cost of capital and that excess in return overlows to ROE. Hence, it is normal that ROE is higher than ROA. In order to get a general impression of the real (un)proitability of all analysed sectors, in Fig. 5 we display the relation between average ROA and ROE in the analysed ive-year period, for each sector individually and for the economy as a whole.
Figure 5: The Analysis of financial leverage
Source: Author’s calculation
present inancial risks. Unfortunately the previous graph shows clearly that in the analysed ive-year period, in each sector and in the Serbian economy as a whole, there are negative efects of inancial leverage. In each sector ROA is higher than ROE, meaning that ownership returns are reduced proportionally to the negative indebtedness efect. he smallest range between ROA and ROE exists in the telecommunications sector. However, as ROE is lower than ROA, besides the fact that proitabil ity within this sector is above average, we must state that it is unsatisfactory.
8. EVALUATION OF INVESTMENT POSSIBILITIES OF INFRASTRUCTURE SECTORS
Strategical segments of the real sector, such as agriculture, mining, the processing industry, construction, etc. (Malinić & Milićević, 2011), have a serious problem with insuicient level of economic activity. his could also be said about the key infrastructure sectors which are the object of our analysis and also have a strategic character - energy, transportation, and telecommunications. Strengthening the competitivity of these sectors and thus of the national economy always implies considerable investment. Investment in infrastructure sectors is expected not only to increase their performance but, by creating demand in other sectors, to increase the level of operations in other strategically important (in terms of the national economy’s development) sectors as well.
Serious investment always raises the question of inancing growth. We will direct the attention in this paper especially to the evaluation of the capabilities of the analysed infrastructure sectors to bear the load of extensive capital investment, i.e., to provide, by means of disposable cash lows, part of the funds necessary for their inancing. Since sustainable growth implies maintaining the targeted capital structure, the problem of inancing growth will also raise the question of providing additional external sources of inance.
irst thought. By growth we mean new investment in revitalization of existing capacity and building new capacity that will considerably increase the current level of operations, investment in renewable energy sources, in the environment, and so on. hus this is about serious capital investment requiring real sources of inance.
We will base our evaluation of investment capability in the infrastructure sectors on the analysis of Free Cash Flow (FCF), ratio between Cash Flow from Operations (CFO) and Capital Expenditure (CAPEX ratio), as well as on understanding Internal Growth Rate (IGR) and Sustainable Growth Rate (SGR) for each sector. Movements of these indicators are displayed in Table 9.
Table 9: Analysis of investment possibilities
Source: Author’s calculation
In order to better understand the proportion of capital expenditures inanced from internal sources (White et al., 2003, pp. 147-148), we will use the previously mentioned CAPEX ratio to help us understand the percentage of coverage of capital expenses by cash low from operations. he analysis shows that from 2008 to 2010 a considerable amount of investment in the energy sector was inanced from internal sources (between 42% and 51%). he dramatic fall of the CAPEX ratio in 2011 to only 9.15% is not alarming because it was mostly caused by increase of assets based on revaluation and not by real outlow based on capital investment. However, we should have in mind two facts here. Firstly, a large increase in range of activities will require much more capital investment, and, accordingly, bigger sources of inancing. Secondly, if it is necessary to maintain the current capital structure (ratio between debt and capital was on average 28.5% : 71.5% in the last ive years) a bigger share of own sources is required. So, in both cases, there will be the problem of inding additional inancing sources.
he transportation sector is in the most unfavourable position to inance new investment from internally generated cash low. Cash low from operations was negative from 2008 to 2010, meaning that values of the CAPEX ratio were below zero, and only in 2011 did the CAPEX ratio have a modest value of 9.47%. Since according to the existent capital structure (on average, the ratio of debt to capital is 47.1% : 52.9%) more than half of total investment must be inanced from internal sources, with current performance the investment possibilities of this sector are very low.
At least at irst sight the situation is most favourable in the telecommunications sector, where values of the CAPEX ratio are very high, especially in the last three analysed years. In 2011 the value of this indicator was twice higher than capital investment. However these results should be relativized as well. his sector also has very high demands in terms of new investment, which will, at least at the beginning, reduce the value of the CAPEX ratio. In addition the telecommunications sector is burdened by credit liabilities, so a great deal of generated cash low must be used for repayment and less money will be available for investment.
To evaluate growth capabilities we use the internal growth rate and the sustainable growth rate. internal growth rate, the relation between retained earnings and average total assets, implies the potential pace of a sector’s growth if only internal inancing sources are used. In all of the sectors these growth rates are oten negative or very modest, conirming that investment in the past few years has been insuicient, and that the occasional high values of the CAPEX ratio are more the result of insuicient investment than of inancial strength. Sustainable growth rate, the relation between retained proit and average capital, implies growth capabilities when internal and external sources of inancing are used. It is logical that SGR is higher than IGR, since the sources of inancing expand, and the obtained results conirm this. But in this case as well the obtained values are modest, except partially in the telecommunications sector. Let us add to all this the fact that, in calculating these growth rates, retained earnings was not reduced by potential coverage of accumulated losses. We supposed that total retained earnings are reinvested in proitable projects, which is acceptable for the companies without losses on their balance sheets. If we acted diferently, and there are some arguments in favour of that, values would be even more modest.
To sum up: a) all sectors are capital intense, especially energy and telecommunications, b) to date investment has been insuicient, c) geater capital investment is needed for serious improvement in all sectors’ performances d) internal inancing sources are not enough to reach the target capital structure. In these circumstances the question is how to provide additional inancing sources. Even if it were possible to ind credit sources this would not be good, because debt growth would increase the exposure of the sectors to inancial risk. Borrowing capacity, which is not at an enviable level even now, would continue to fall, the cost of debt would rise, while the negative efects of inancial leverage would be inevitable.
where infrastructure sectors are very attractive. Fourth, providing own sources by means of recapitalization should also be followed by proper debt inancing, in order to maintain the target capital structure and provide as low inancing costs as possible. Apart from credit instruments we should also lean on long-term debt instruments, primarily corporate bonds. his necessitates the development of a capital market. Diferentiation of inancing sources is necessary. We should not forget that the crisis can only be overcome by means of cheap, rather than expensive, inancing sources.
9. CONCLUSION
Sectors like agriculture, water management, mining, the processing industry, and construction are oten characterized as strategically important sectors for the development of the national economy. Sectors like energy, transportation, and telecommunications are not any less strategically important. Apart from afecting GDP growth by their achievements they provide energy, logistics, information, and communication support to all other sectors. herefore the key infrastructure sectors of energy, transportation, and telecommunications are pillars of development in the national economy and society as a whole. he development of infrastructure sectors implies extensive investment. Only inancially healthy companies can support such investment.
he entire economy is burdened by a liquidity problem, and the analysed sectors are no exception. A faster growth of short-term liabilities compared to current assets and liquidity indicators falling below the usual values both demonstrate the seriousness of the problem. he functioning of these sectors demands eicient cash low synchronization. he fact that this is usually dealt with by prolonging payment of liabilities to suppliers is a serious problem. It is not sustainable in the long term and leads to deeper crisis.
he proitability of the infrastructure sectors is unsatisfactory. his is also true for the telecommunications sector, which has an above average proitability compared to the economy, but a negative efect of inancial leverage (ROA is higher than ROE). here are also problems of low turnover and low margins (except partially in the telecommunications sector). What is especially worrying is the insuicient proitability of the core business. his is particularly evident in the energy and transportation sectors. here is an insuicient level of operations in all sectors, and costs need to be managed more eiciently. he energy sector is additionally burdened by unrealistically low prices.
hese sectors are capital-intensive. heir inancing demands both internal and external sources, resulting in at least two problems. he irst is that certain companies belonging to these sectors have low proitability of their core business and cannot bear their inancial expenses. he second is that, due to exchange diferences and the currency clause, inancial expenses luctuate. In conditions of monetary instability they rise considerably, which reduces returns. It indicates the presence of high inancial risk and the dependence of performance on exchange rate stability.
Serious capital investment demands diferentiation of inancing sources. Maintaining the target capital structure requires combining internal and borrowed sources. Internal sources should partially come from internally generated cash low, while the for the remainder companies should look to recapitalization. Strategic partners and public-private partnerships could play an important role here. However, borrowed sources should also be diferentiated. Apart from credit sources we should also lean on long-term debt instruments, primarily corporate bonds. his assumes the development of a capital market.
REFERENCES
Boer, G. (1999). Managing the Cash Gap. Journal of Accountancy , 27-32.
International Teleccomunication Union. (2009). Confronting the Crisis: ICT Stimulus Plans for Economic Growth.
Malinić, D. (2007). Politika dobiti korporativnog preduzeća. Beograd: Ekonomski fakultet. Malinić, D., & Milićević, V. (2012). Finansijska stabilnost sektora telekomunikacija. Telekomunikacije (10), 2-15.
Malinić, D., & Milićević, V. (2012). Finansijsko-strukturno nasleđe kao ograničenje za izlazak privrede iz krize - Slučaj Srbije. Značaj računovodstva revizije i inansija u procesu prevladavanja ekonomske krize (pp. 119-149). Banja Vrućica: Savez računovođa i revizora Republike Srpske.
Malinić, D., & Milićević, V. (2011). Performance Evaluation of Real Sector in Serbia. Ekonomika preduzeća, Journal of the Serbian Association of Economists (4), 335-351.
Malinić, D., Milićević, V., & Stevanović, N. (2013). Upravljačko računovodstvo. Beograd: Ekonomski fakultet.
Penman, S. (2007). Financial Statement Analysis and Security Valuation. New York: McGraw-Hill. Seling, T., & Stickney, C. (1989). he Efects of Business Environment and Strategy on a Firm`s Rate of Return on Assets. Financial Analysts Journal , 43-52.
Serbian Business Registres Agency. (n.d.).
Stickney, C., Brown, P., & Wahlen, J. (2007). Financial Reporting, Financial Statement Analysis, and Valuation. Mason: homson.
Uredba o klasiikaciji delatnosti. (54/2010). Službeni glasnik.
White, G., Sondhi, A., & Fried, D. (2003). he Analysis and Use of Financial Statements. New Jersey: John Wiley&Sons.
World Economic Forum. (2012). he Role of the Energy Sector in the Economy. World Economic Forum Energy for Economic Growth: Energy Vision Update 2012. Geneva.
Zhen-Wei, Q., Rossotto, C., & Kimura, K. (2009). Chapter 3 Economic Impacts of Broadband. In Information and Communiccations for Development 2009: Extending Reach and Increasing Impact (pp. 35-48). New York: World Bank.