Suparerk Janjarasjitt and Kenneth A. Loparo
Abstract—Temporal characteristics of EEG signal provide insight into the state of the brain. In this work, temporal characteristics of spectral subbands of epileptic EEG data asso-ciated with different pathological states of the brain including δ, θ, α, β and γ subbands are examined using two features of local minima andlocal maxima, referred to the number of local min-max and the variance of local min-max intervals. The computational results show the substantial differences between the temporal characteristics of the epileptic EEG signal during an epileptic seizure activity and during a non-seizure period in any subband. Furthermore, the epileptic EEG signal during an epileptic seizure activity exhibits different temporal characteristics between the low and high frequency subbands as compared to the epileptic EEG signal during a non-seizure period.
Index Terms—electroencephalogram, epilepsy, seizure, local min-max, subbands.
I. INTRODUCTION
E
PILEPSY is a common brain disorder in which clusters of neurons signal abnormally [1]. More than 50 million individuals worldwide, about 1% of the world’s population are affected by epilepsy [2]. In epilepsy, the normal pattern of neuronal activity is disturbed, causing strange sensations, emotions, and behavior, that sometimes include convulsions, muscle spasms, and loss of consciousness [1]. There are many possible causes for seizures ranging from illness to brain damage to abnormal brain development [1], and epilep-tic seizures are manifestations of epilepsy [3]. The electroen-cephalogram (EEG) is a signal that quantifies the electrical activity of the brain, usually from scalp recordings and is commonly used to assess and detect brain abnormalities, and is crucial for the diagnosis of epilepsy [1].Temporal patterns of EEG signals can provide important information and such features can be obtained by visual inspection/analysis and using computational tools. Concepts and computational tools derived from the study of complex systems including nonlinear dynamics have gained increasing interest for applications in biology and medicine [4]. The correlation integral and dimension are common nonlinear dynamical analysis techniques that have been applied to EEG signal analysis [5] to study various aspects. Epilepsy is an important application for nonlinear EEG analysis [6], [7].
Manuscript received January 7, 2012. This work was supported by Ubon Ratchathani University.
S. Janjarasjitt is with the Department of Electrical and Electronic Engi-neering, Ubon Ratchathani University, Ubon Ratchathani, 34190 Thailand e-mail: [email protected].
K. A. Loparo is with the Department of Electrical Engineering and Computer Science, Case Western Reserve University, Cleveland, OH, 44106 USA.
In this paper, the temporal characteristics of epileptic EEG data are examined in terms of local minima and
local maxima. There are a variety of different approaches to determining local minima and maxima and typically, local min-max detection algorithms rely on thresholding the magnitudes in a specified time window. The local minima (local maxima) here is defined as a point whose amplitude is less (greater) than its neighbors. The local minima and maxima thus specify extreme points of the signal where the magnitude changes direction. Previously, the characteristics of the local min-max of the epileptic EEG signals were investigated in [8]–[10]. Also, in [11], the characteristics of the local min-max were examined in the sleep EEG data associated with various sleep stages.
The features of the local minima and maxima examined in this paper are the total number of the local minima and maxima, referred to as the number of local min-max, and the variance of the sequence of distances between two consecutive local minima and maxima, referred to as the variance of local min-max intervals. In this paper, as com-pared to the full-spectrum of EEG signal investigated in [8]– [10], the temporal characteristics of five spectral subbands of intracranial EEG data obtained from epilepsy patients corresponding to different pathological states of the brain (i.e., during a non-seizure period and during an epileptic seizure activity) including δ (1–4 Hz), θ (4–8 Hz), α (8– 13 Hz),β (14–30 Hz), andγ (31–80 Hz) are examined.
From the computational results, it is shown that there are substantial differences between the temporal characteristics of the epileptic EEG signals during an epileptic seizure activity and during a non-seizure period in any subbands. Further, the number of local min-maxNλ of epileptic EEG signal during an epileptic seizure activity is significantly different from that during a non-seizure period at theα,βand γsubbands, and the variance of local min-max intervalsVλ of epileptic EEG signal during an epileptic seizure activity is significantly different from that during a non-seizure period at theδ, αandγ subbands. Also, the epileptic EEG signal during an epileptic seizure activity corresponds to different temporal characteristics (i.e., the number of local min-max Nλ and the variance of local min-max intervals Vλ) at the lower and higher frequency subbands as compared to that during a non-seizure period.
II. METHODS
A. Data and Subjects
0 500 1000 1500 2000 2500 3000 3500 4000 E
D
Data Set
Time (sample)
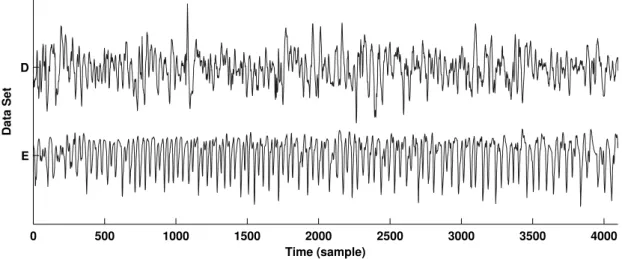
Fig. 1. Examples of intracranial EEG signals of the data setsD(non-seizure) andE(seizure).
2900 2950 3000 3050 3100 3150 3200
−100 −50 0 50 100 150
Time (sample)
EEG
EEG Local Min Local Max
Fig. 2. Local minimaλminplotted in ‘△’ and local maximaλmax plotted in ‘▽’.
at http://epileptologie-bonn.de/cms/front content.php?idcat= 193&lang=3&changelang=3) and originated from the study presented in [12]. Two sets of EEG data, referred to as sets D andE, were recorded using intracranial electrodes from five epilepsy patients. Both sets of EEG data were recorded from within the epileptogenic zone. Further, the EEG data in the setD corresponds to non-seizure periods while the EEG data in the set E were recorded during seizure activity.
Each epileptic EEG data set contains 100 epochs of a single-channel that were selected to be free of artifacts such as muscle activity and eye movements. The length of each epoch is 23.6 seconds (4097 samples). In addition, the epochs of the EEG signal satisfied the weak stationarity criterion given in [12]. The sampling rate of the data is 173.61 Hz and a bandpass filter with passband between 0.50 Hz and 85 Hz was used during signal acquisition. Examples of the epileptic EEG signals for each data set are depicted in Fig. 1.
B. Local Minima and Local Maxima
Let the sequence {x[n]} be samples from a signal for n= 0,1, . . . , N −1, whereN is the length of signal. The local minimaλmin of the signalxare defined as point whose
amplitude is less than that of its consecutive preceding and
succeeding points while the local maximaλmaxare defined as
point whose amplitude is greater than that of its consecutive preceding and succeeding points.
Computationally, the local minimaλmin and maximaλmax
are given by
λmin=
n=
s+t 2
(1)
x[s−1]> x[n]andx[t+ 1]> x[n]
and
λmax=
n=
s+t 2
(2)
x[s−1]< x[n]andx[t+ 1]< x[n]
wherex[s] =x[s+ 1] =. . .=x[n] =x[n+ 1] =. . .=x[t]. The local minima and maxima of an EEG signal are depicted in Fig. 2.
C. Local Min-Max Characteristics
D E 100
Data Set
(a) δsubband
D E
260 280
Data Set
(b)θsubband
D E
440 460
Data Set
(c)αsubband
D E
800 900 1000 1100
Data Set N λ
(d)βsubband
D E
1600 1800 2000 2200 2400 2600
Data Set N λ
(e)γsubband
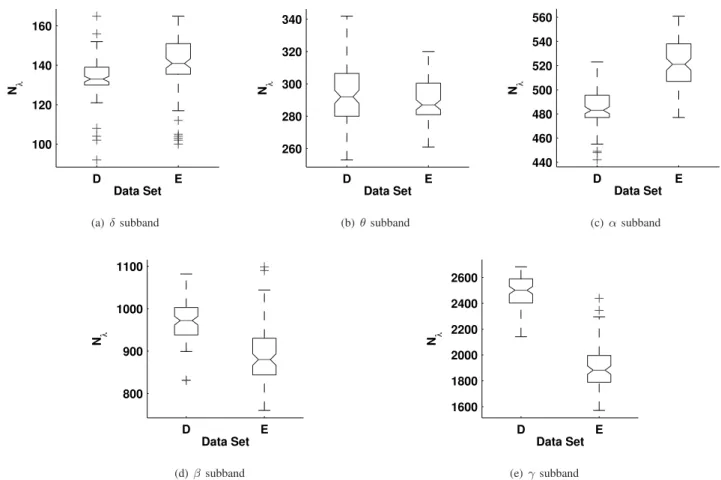
Fig. 3. Comparison of the number of local min-maxNλof the spectral subbands of the EEG data of setsDandE.
from the local minima λmin and the local maxima λmax
defined as follows:
1) Number of local min-max:
The number of local min-maxNλ is the total number of both local minimaλmin and local maximaλmax of
the EEG signal.
2) Variance of local min-max intervals:
The variance of local min-max intervals Vλ is the variance of the sequence of distances between two consecutive local minima and maximaiλ.
D. Analytical Framework
In this study, the intracranial EEG signal of the EEG data of sets D and E is divided into five spectral subbands: δ (1–4 Hz), θ (4–8 Hz), α (8–13 Hz), β (14–30 Hz), andγ (31–80 Hz). The temporal characteristics, i.e., the number of local min-max Nλ and the variance of local min-max intervals Vλ, of all five spectral subbands including the δ,
θ, α, β andγ subbands are examined. The two-sample t– test is performed to determine whether both local min-max characteristics of each spectral subbands of EEG data setD significantly differs from that of the data setE.
III. RESULTS
The box plots shown in Fig. 3(a), Fig. 3(b), Fig. 3(c), Fig. 3(d) and Fig. 3(e), respectively, compare the number of local min-maxNλ of the δ,θ,α,β andγ subbands of the epileptic EEG data setsDandE. The variance of local min-max intervals Vλ of the δ, θ, α, β and γ subbands of the
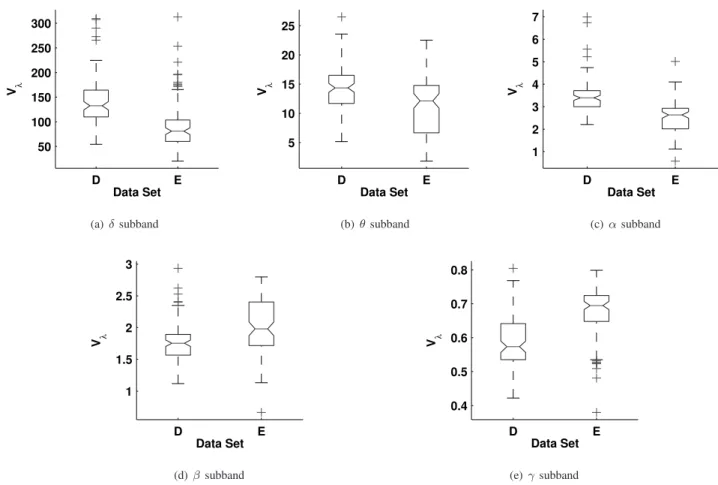
epileptic EEG data setsD andE are compared in Fig. 4(a), Fig. 4(b), Fig. 4(c), Fig. 4(d) and Fig. 4(e), respectively. The central mark of each box is the median mark while the edges of the box are the 25th and 75th percentiles. In addition, the mean, median and standard deviation of both local min-max characteristics, i.e., Nλ and Vλ, of the EEG subbands are summarized in Table I. Evidently, the epileptic EEG data of sets D and E associate with different characteristics of the local min-max of various spectral subbands, i.e.,δ, θ,α,β and γ. The number of local min-max Nλ of the epileptic EEG data of both sets D and E tends to increase with higher frequency subbands while the variance of local min-max intervalsVλ of the epileptic EEG data of both sets D andE tends to decrease with higher frequency subbands.
The number of local min-maxNλof theδandθsubbands of the epileptic EEG data of setE tends to be higher than that of the data setD. On the contrary, the number of local min-maxNλ of theβ andγ subbands of the epileptic EEG data of setEtends to be less than that of the data setD. Also, the variance of local min-max intervals Vλ of the epileptic EEG data of setE tends to be lower than that of the data set D at the lower frequency subbands (i.e., δ,θ andα) while, at the higher frequency subbands (i.e.,βandγ), the variance of local min-max intervalsVλ of the epileptic EEG data of setE tends to be higher than that of the data set D. Note that the degree of difference between the number of local min-maxNλ of the spectral subbands of the epileptic EEG data sets tends to increase with higher frequency subbands.
D E 50
100 150 200 250 300
Data Set V λ
(a) δsubband
D E
5 10 15 20 25
Data Set V λ
(b)θsubband
D E
1 2 3 4 5 6 7
Data Set V λ
(c)αsubband
D E
1 1.5 2 2.5 3
Data Set V λ
(d)βsubband
D E
0.4 0.5 0.6 0.7 0.8
Data Set V λ
(e)γsubband
Fig. 4. Comparison of the variance of local min-max intervalsVλof the spectral subbands of the EEG data of setsDandE.
TABLE I
STATISTICAL VALUES OF THE LOCAL MIN-MAX CHARACTERISTICS OF THE SPECTRAL SUBBANDS OF THEEEGDATA OF SETSDANDE.
Feature Data Set Subband Mean Median S. D.
Nλ D δ 133.19 133.00 9.90
Nλ D θ 293.74 292.00 20.58
Nλ D α 483.87 483.00 15.57
Nλ D β 970.55 972.00 47.11
Nλ D γ 2477.78 2502.00 131.03
Nλ E δ 140.26 141.00 14.60
Nλ E θ 290.06 287.00 12.83
Nλ E α 520.74 521.00 18.63
Nλ E β 889.32 880.00 70.88
Nλ E γ 1903.43 1883.00 160.84
Vλ D δ 139.79 132.64 50.51
Vλ D θ 14.34 14.36 4.10
Vλ D α 3.48 3.39 0.75
Vλ D β 1.78 1.75 0.31
Vλ D γ 0.59 0.57 0.08
Vλ E δ 91.63 81.07 49.84
Vλ E θ 11.09 12.13 5.27
Vλ E α 2.50 2.63 0.77
Vλ E β 2.01 1.98 0.43
Vλ E γ 0.68 0.69 0.08
spectral subbands, i.e., δ, θ, α, β and γ, of the epileptic EEG data of sets D and E are summarized in Table II. From the two-samplet-test for the number of local min-max Nλ, the results suggest that there are statistically significant differences between the number of local min-maxNλof the
α, β and γ subbands of the epileptic EEG data of sets D andEwith ap-value of 0.000001. Furthermore, the results of two-samplet-test for the variance of local min-max intervals Vλ suggest that there are statistically significant differences between the variance of local min-max intervalsVλof theδ,
αandγ subbands of the epileptic EEG data of setsD and E with a p-value of 0.000001.
IV. CONCLUSIONS ANDDISCUSSION
Nλ α H can be rejected p≪ .
Nλ β H0can be rejected p≪0.000001
Nλ γ H0can be rejected p≪0.000001
Vλ δ H0can be rejected p <0.000001
Vλ θ H0 cannot be rejected p= 0.000002
Vλ α H0can be rejected p≪0.000001
Vλ β H0 cannot be rejected p= 0.000028
Vλ γ H0can be rejected p≪0.000001
Vλof the full-spectrum long-term electrocorticogram (ECoG) signal during a seizure onset were shown in [8].
From the computational results, it is shown that both the number of local min-max Nλ and the variance of local min-max intervals Vλ of various subbands of the epileptic EEG data for both non-seizure and seizure periods are substantially different. The number of local min-max Nλ increases while the variance of local min-max intervals Vλ with a higher frequency subband. This is as expected since at a higher-frequency subband the EEG signal contains faster oscillating components. As a result, the amplitude of EEG signal varies faster and the interval between extrema of EEG signal becomes narrower. Further, the temporal characteris-tics of the epileptic EEG signals during an epileptic seizure activity and a non-seizure period are also basically different for each subbands.
At the low frequency subbands (i.e.,δandα) the number of local min-max Nλ of the epileptic EEG data of set D tends to be higher than that of setE but the number of local min-maxNλ of the epileptic EEG data of setD at the high frequency subbands (i.e., β and γ) tends to be lower than that of set E. This indicates that there is a higher rate of amplitude variation of the low frequency contents of EEG signal during an epileptic seizure activity than that during a non-seizure period. On the other hand, the rate of amplitude variation of the high frequency contents of EEG signal during a non-seizure period tends to be higher than that during an epileptic seizure activity.
In addition, the variance of local min-max intervals Vλ of the epileptic EEG data of set D at the low frequency subbands (i.e., δ, θ and α) tends to be lower than that of
high frequency contents of the epileptic EEG signal during an epileptic seizure activity is higher than that during a non-seizure period.
Therefore, as quantified using the local minima and max-ima, at the low frequency subbands the rate of ampli-tude variation of epileptic EEG signal during an epileptic seizure activity is higher but its temporal variability is less as compared to that during a non-seizure period. This is however reversed at the high frequency subbands. The rate of amplitude variation of epileptic EEG signal during an epileptic seizure activity is lower while the regularity of amplitude variation is less as compared to that during a non-seizure period.
REFERENCES
[1] Seizure and Epilepsy: Hope through Research National Institute of Neurological Disorders and Stroke (NINDS), Bethesda, MD, 2004 [Online]. Available: http://www.ninds.nih.gov/disorders/epilepsy/ detail epilepsy.htm
[2] B. Litt and J. Echauz, “Prediction of epileptic seizures,” Lancet Neurology, vol. 1, pp. 22–30, 2002.
[3] A. Subasi, “Epileptic seizure detection using dynamic wavelet net-work,”Expert Systems with Applications, vol. 29, pp. 343–355, 2005. [4] A. L. Goldberger, “Complex systems,”Proc. Am. Thorac. Soc., vol. 3,
pp. 467–472, 2006.
[5] W. S. Pritchard and D. W. Duke, “Measuring chaos in the brain: a tutorial review of EEG dimension estimation,” Brain Cogn., vol. 27, pp. 353–397, 1995.
[6] C. E. Elger, G. Widman, R. Andrzejak, J. Arnhold, P. David, and K. Lehnertz, “Nonlinear EEG analysis and its potential role in epilep-tology,”Epilepsia, vol. 41(Suppl.), pp. S34–S38, 2000.
[7] C. E. Elger, G. Widman, R. Andrzejak, M. Dumpelman, J. Arnhold, P. Grassberger, and K. Lehnertz, “Value of nonlinear time series anal-ysis of the EEG in neocortical epilepsies,” inAdvance in Neurology, P. D. Williamson, A. M. Siegel, D. W. Roberts, V. M. Thadani, and M. S. Gazzaniga, Ed. Philadelphia: Lippincott Williams & Wilkins, 2000.
[8] S. Janjarasjitt and K. A. Loparo, “Temporal variability of the ECoG signal during epileptic seizures,” inECTI-CON 2010, 2010, pp. 332– 336.
[9] S. Janjarasjitt and K. A. Loparo, “Comparison of temporal variability of epileptic ECoG signals,” inICEIE 2010, 2010, pp. V2259–V2263. [10] S. Janjarasjitt and K. A. Loparo, “Investigation of temporal variability of epileptic EEG signals,” in IEEE Region 10 Annual International Conference, 2010, pp. 359–363.
[11] S. Janjarasjitt, “Investigation of temporal variability of sleep EEG,” in
ICICS 2011, 2011.