Host Species and Environmental Effects on Bacterial
Communities Associated with
Drosophila
in the
Laboratory and in the Natural Environment
Fabian Staubach1*, John F. Baines2, Sven Ku¨nzel2, Elisabeth M. Bik3, Dmitri A. Petrov1
1Department of Biology, Stanford University, Stanford, California, United States of America,2Max Planck Institute for Evolutionary Biology, Plo¨n, Germany,3Department of Microbiology & Immunology, Stanford School of Medicine, Stanford, California, United States of America
Abstract
The fruit flyDrosophilais a classic model organism to study adaptation as well as the relationship between genetic variation and phenotypes. Although associated bacterial communities might be important for many aspects ofDrosophilabiology, knowledge about their diversity, composition, and factors shaping them is limited. We used 454-based sequencing of a variable region of the bacterial 16S ribosomal RNA gene to characterize the bacterial communities associated with wild and laboratory Drosophila isolates. In order to specifically investigate effects of food source and host species on bacterial communities, we analyzed samples from wildDrosophila melanogasterandD. simulanscollected from a variety of natural substrates, as well as from adults and larvae of nine laboratory-rearedDrosophila species. We find no evidence for host species effects in lab-reared flies; instead, lab of origin and stochastic effects, which could influence studies ofDrosophila
phenotypes, are pronounced. In contrast, the natural Drosophila–associated microbiota appears to be predominantly shaped by food substrate with an additional but smaller effect of host species identity. We identify a core member of this natural microbiota that belongs to the genusGluconobacterand is common to all wild-caught flies in this study, but absent from the laboratory. This makes it a strong candidate for being part of what could be a naturalD. melanogasterandD. simulanscore microbiome. Furthermore, we were able to identify candidate pathogens in natural fly isolates.
Citation:Staubach F, Baines JF, Ku¨nzel S, Bik EM, Petrov DA (2013) Host Species and Environmental Effects on Bacterial Communities Associated withDrosophila
in the Laboratory and in the Natural Environment. PLoS ONE 8(8): e70749. doi:10.1371/journal.pone.0070749
Editor:Christopher Quince, University of Glasgow, United Kingdom
ReceivedFebruary 13, 2013;AcceptedJune 28, 2013;PublishedAugust 13, 2013
Copyright:ß2013 Staubach et al. This is an open-access article distributed under the terms of the Creative Commons Attribution License, which permits unrestricted use, distribution, and reproduction in any medium, provided the original author and source are credited.
Funding:This work was funded by a DFG Forschungsstipedium to FS (STA 1154/1-1). NIH grants RO1GM100366 and RO1GM097415 to DAP; and the Excellence Cluster Inflammation at Interfaces(JFB). The funders had no role in study design, data collection and analysis, decision to publish, or preparation of the manuscript.
Competing Interests:The authors have declared that no competing interests exist.
* E-mail: [email protected]
Introduction
Bacterial symbionts play important roles for metazoans covering the whole spectrum from beneficial mutualists to infectious, disease-causing pathogens. Benefits that hosts derive from mutualists are diverse and include extracting essential nutrients from food in humans [1], breaking down cellulose in Ruminantia [2], and light production byVibrio fisheriin the light organs of the bobtail squid [3]. In arthropods, indigenous bacteria protect aphids from parasitoid wasps [4], protect beewolf larvae from infectious disease [5], and keep leaf tissue of fallen leaves photosynthetically active, providing larvae of leaf-miner moths with nutrients [6]. Detrimental effects microbes have on their hosts range from lethal disease [7] to changing the sex ratio of the offspring in their favor [8].
Pathogens as well as mutualists not only interact with their hosts, but at the same time with other members of the often diverse host associated microbial community [9]. Indirect evidence for competition for ecological niches in the host comes from Staubach
et al. [10] who found that the lack of the glycosyltransferase B4galnt2 in mice leads to the replacement of bacterial taxa by closely related taxa. Bakula [11] showed thatEscherichia colipersists in Drosophila only when monoxenic and is quickly replaced by other bacteria upon exposure suggesting that there is competition
between bacteria to colonize the fly. Ryuet al.[12] demonstrated that suppressing the caudal gene by RNAi inDrosophilaleads to replacement of an Acetobacter species by a Gluconobacter species followed by strong pathological consequences. These examples indicate that there is interaction and competition for ecological niches along the continuum of hosts and microbes. Thus, a thorough understanding of host-microbe interactions also requires comprehensive knowledge of host associated bacterial communi-ties and the factors shaping them.
These factors can roughly be grouped into two categories. The first category includes biotic and abiotic environmental factors the host and its associated microbes are exposed to (e.g. diet). The second category includes factors that are determined by host genetics. The relative importance of these factors in shaping human associated microbial communities is a matter of recent debate [13,14]. One approach to disentangle these effects is by studying the relationship of host genetic divergence, diet, and divergence of microbial communities. A correlation of genetic divergence between a set of host taxa and the divergence of their associated microbial communities would suggest that genetic effects play a role in shaping these communities. On the other hand, a correlation of microbial community composition with diet would suggest an effect of environmental factors. This approach has been applied to a variety of mammals [15–17], but it has
proven difficult in mammals to control for diet and other environmental factors across host taxa. Hence, it is not yet clear, which factors are the strongest determinants of microbiota composition.
In contrast to the complex microbial communities associated with mammals like humans and mice, which are estimated to consist of hundreds or even thousands of taxa [10,18], some studies suggest that only a handful of bacterial species dominate the microbial communities of invertebrates [19,20]. This has turned a spotlight on Drosophila to serve as a simpler model for understanding the complex interactions of hosts and their associated microbes [20–22]. The Drosophila immune system is reasonably well understood [23] and the tractability ofDrosophila
has helped to identify genes involved in specific interactions between host and microbes. This includes genes underlying avoidance behavior towards harmful bacteria [24] and immune defense [25] as well as interactions with commensals [26] and beneficial bacteria that prevent pathogens from colonizing the host [12] or promote its growth [27,28].
As a first step in understanding the diversity of bacterial communities associated withDrosophila it is important to investi-gate flies under natural conditions. Most studies conducted to date focused on more specific interactions or those found in the lab [20,29], while few studies described the natural diversity of fly associated bacterial communities. Cox and Gilmore [30] included natural fly isolates and combined culture and culture-independent methods to characterize fly associated microbial communities. Corby-Harris et al. [31] focused their study on the diversity of microbial communities along latitudinal clines. Chandleret al.[32] conducted the most comprehensive analysis of bacteria associated withDrosophilaby sampling a range of drosophilid flies from their natural food substrates. However, these studies were limited by either throughput or dependence on cultivation [33]. Although Chandleret al.[32] sampled flies from different natural substrates, their sampling scheme did not allow to directly disentangle host species and diet effects on the natural microbiota because this requires replicated, pairwise sampling of at least two host species from the identical substrate.
In order to understand bacterial communities associated with
Drosophila and the factors shaping their diversity, we investigated the relative effects of food substrate and fly species. Accordingly, we analyzedD. melanogasterandD. simulanscollected in pairs from different natural food sources, as well as under controlled lab conditions. Furthermore, we assessed the communities of nine lab-rearedDrosophilaspecies and their larvae to evaluate the influence of host genetic background on a broad scale. These species were selected to span the Drosophila genus and match the 12 species sequenced by Clark et al. [34] (D. melanogaster, D. simulans, D. sechellia,D. yakuba,D. erecta,D. pseudoobscura,D. persimilis,D. virilis,D. mojavensis).
Results
In order to profileDrosophila-associated bacterial communities, we amplified and sequenced ,300 bp (base pairs) of the 16S
rRNA gene (see Materials and Methods) spanning the variable regions V1 and V2. Three types of fly isolates were used in our study. The samples are listed in Table 1. First, species-pairs of wild-caughtD. melanogasterandD. simulanssamples were collected from different substrates (oranges, strawberries, apples, peaches, compost) at multiple locations on the East and West Coast of the USA. Within each sample pair, D. melanogaster and D. simulans
individuals were collected at the same location, time, and substrate (mostly by aspiration of individual flies from the same fruit),
thereby controlling for environmental variables to the extent possible in the field. This allowed us to study the effects of both, substrate and host species on the composition of bacterial communities independently of each other. Second, we included isofemale, wild-derived strains of D. melanogaster and D. simulans
that were reared in the Petrov lab for,3 years after collection.
Third, a variety ofDrosophilaspecies from the UCSD Stock Center was chosen to complement the analysis. We primarily focused on adults, but also studied bacterial communities in larvae of the lab-reared strains. We analyzed a total of,340,000 sequences that
matched our quality criteria (see Materials and Methods).
,130,000 sequences matched the Wolbachia 16S rRNA gene
and were excluded from the analysis. For Petrov labD. simulans
sample 6, removal ofWolbachiasequences led to a very low number of remaining sequences (18 sequences). Therefore, we excluded this sample from further analysis (Table S1 lists the total number of sequences and the proportion of Wolbachia sequences for each sample).
Diversity of bacterial communities associated with
Drosophila
For assessing the Drosophila associated bacterial diversity in general, we grouped all sequences into 97% identity operational taxonomic units (OTUs) and calculated inverted Simpson diversity indices [35]. Rarefaction curves are plotted in Figure 1. Bacterial communities associated with lab-reared flies are strikingly less diverse than those of wild-caught flies (P= 2.961025, Wilcoxon
test on Simpson diversity index), indicating a bias towards a few dominant species in the lab compared to more complex and species-rich communities of wild-caught flies. However, substantial variance of community diversity was found between individual samples from lab-reared flies. While bacterial diversity in 14 out of 20 lab-reared fly samples is lower than in all wild-caught samples, the diversity of lab-rearedD. erecta,D. persimilis,D. sechellia,D. virilis, and Petrov lab D. melanogastersample 3 (m.pet3 in Table 1) lies within the range of wild-caught samples. The diversity observed in Petrov labD. melanogastersample 6 (m.pet6) is even higher than in wild-caught flies and its community composition appears to differ from the other Petrov lab samples (Figure 2C). Because this sample was unusual, we conducted all of the subsequent analyses with and without this sample, but did not notice any qualitative differences (data not shown). All of the analyses described below that include lab-reared samples also include this sample.
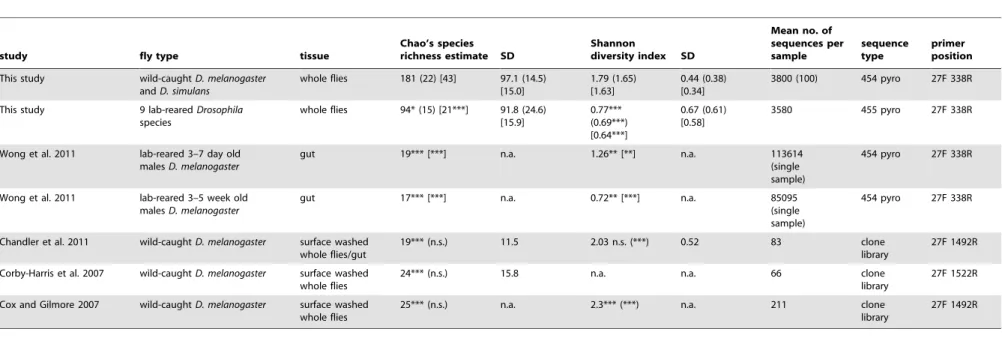
Comparing estimates of species richness and diversity from our study to estimates from lab-reared flies in Wonget al.[20] supports the notion that bacterial communities of lab-reared flies are less species rich (Table 2). Our species richness estimates from wild-caught flies are more than twice as high on average (43 vs 19,
depths are responsible for the different species richness estimates. When we limit our sample size to 100 sequences to make our study more comparable to the clone library data from Cox and Gilmore [30] and Chandleret al.[32] we find values for Shannon’s diversity index that are similar and even a bit higher (P,0.001, Student’s T-test) in these two studies. Note that direct comparison of diversity between studies is difficult due to different sample preparations (whole flies, fly guts, washing procedure), sequencing depths, and different regions of the bacterial 16S rRNA gene that were used for the analysis (see Table 2).
Bacterial community composition
In order to examine which bacterial taxa are associated with
Drosophila, we classified the 16S rRNA gene sequences by aligning them to the SILVA reference database [36] using MOTHUR [37]. The results are summarized in Figure 2. Our results show that, on the family level, the combined communities are dominated by Acetobacteraceae (55.3%) and Lactobacillaceae (31.7%) (Figure 2A). Leuconostocaceae (3.8%), Enterobacteriace-ae (3.3%) and EnterococcaceEnterobacteriace-ae (1.9%) are less abundant. All five of these families are known to be associated withDrosophila[6,32] including certain Drosophila pathogenic Enterococcus strains. The remaining sequences (,3.9%) are low abundance families mainly
belonging to the Proteobacteria.
In addition to the differences in overall diversity described above, different bacterial genera dominate the communities of
lab-Figure 1. Rarefaction curves of 97% identity OTUs (A) for adult male flies.
doi:10.1371/journal.pone.0070749.g001 Table 1.Sample list.
sample name species substrate location n larva
m. D. melanogaster lab diet UCSD Stock Center 1 yes
s. D. simulans lab diet UCSD Stock Center 1 yes
sech D. sechellia lab diet UCSD Stock Center 1 yes
yak D. yakuba lab diet UCSD Stock Center 1 yes
erec D. erecta lab diet UCSD Stock Center 1 yes
pers D. persimilis lab diet UCSD Stock Center 1 yes
pseu D. pseudoobscura lab diet UCSD Stock Center 1 yes
vir D. virilis lab diet UCSD Stock Center 1 yes
moja D. mojavensis lab diet UCSD Stock Center 1 yes
m.pet1–m.pet6 D. melanogaster lab diet Petrov lab 6 yes
s.pet1–s.pet6 D. simulans lab diet Petrov lab 6 yes
m.app D. melanogaster apple Johnston, RI 1 no
s.app D. simulans apple Johnston, RI 1 no
m.pea D. melanogaster peach Johnston, RI 1 no
s.pea D. simulans peach Johnston, RI 1 no
m.com D. melanogaster compost Johnston, RI 1 no
s.com D. simulans compost Johnston, RI 1 no
m.ora1 D. melanogaster orange Central Valley 1/Manteca 1 no
s.ora1 D. simulans orange Central Valley 1/Manteca 1 no
m.ora2 D. melanogaster orange Central Valley 2/Escalon 1 no
s.ora2 D. simulans orange Central Valley 2/Escalon 1 no
m.ora3 D. melanogaster orange Central Valley 3/Brentwood 1 no
s.ora3 D. simulans orange Central Valley 3/Brentwood 1 no
m.str D. melanogaster strawberry Central Valley 4/Waterford 1 no
s.str D. simulans strawberry Central Valley 4/Waterford 1 no
n = number of samples, each sample consisting of 5 male flies with the exception of s.ora1 and m.ora3 where only 3 males were available. doi:10.1371/journal.pone.0070749.t001
DrosophilaAssociated Bacteria
reared and wild-caught flies (Figure 2B). The dominant genera also vary sharply between flies from the Petrov lab and the UCSD Stock Center. Specifically, communities associated with wild-caught flies are dominated byGluconobacter(39.3% average relative abundance), Acetobacter (25.5%), and an enteric bacteria cluster
(10.4%) that is mainly comprised ofPectobacterium (4.8% of total average relative abundance),Serratia (3.5%), Erwinia (1.3%), and
Brenneria(0.5%). In contrast,Gluconobacterand the enteric bacteria cluster are virtually absent from our lab-reared flies (,0.001 and ,0.1%).Acetobacteris extremely common in UCSD Stock Center
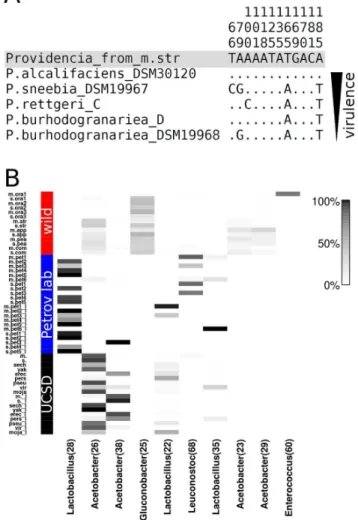
Figure 2. Relative abundance of bacterial taxa as assessed by 16S rRNA gene sequences.Wolbachiasequences were excluded. (A) The five most abundant bacterial families associated withDrosophilaacross all samples in the study. (B) Relative abundance of bacterial genera. Genera present at levels less than 5% were grouped into ‘‘others’’ category. (C) Relative abundance of bacterial genera for individual samples. Each vertical bar represents one sample of five pooled male flies. Bacterial genera of abundance,3% have been removed for clarity.D. melanogastersample names start with m.,D. simulanswith s.. In wild-caught samples the sample names include an abbreviation for the substrate they were collected from: ora = orange, str = strawberry, app = apple, pea = peach, com = compost. Names of flies from the Petrov lab contain ‘‘pet’’ instead. Samples names ending with ‘‘_l’’ mark larval samples.
Table 2.Comparison of bacterial community diversity with previous studies onDrosophila.
study fly type tissue
Chao’s species richness estimate SD
Shannon
diversity index SD
Mean no. of sequences per sample
sequence type
primer position
This study wild-caughtD. melanogaster
andD. simulans
whole flies 181 (22) [43] 97.1 (14.5) [15.0]
1.79 (1.65) [1.63]
0.44 (0.38) [0.34]
3800 (100) 454 pyro 27F 338R This study 9 lab-rearedDrosophila
species
whole flies 94* (15) [21***] 91.8 (24.6) [15.9]
0.77*** (0.69***) [0.64***]
0.67 (0.61) [0.58]
3580 455 pyro 27F 338R
Wong et al. 2011 lab-reared 3–7 day old malesD. melanogaster
gut 19*** [***] n.a. 1.26** [**] n.a. 113614 (single sample)
454 pyro 27F 338R
Wong et al. 2011 lab-reared 3–5 week old malesD. melanogaster
gut 17*** [***] n.a. 0.72** [***] n.a. 85095 (single sample)
454 pyro 27F 338R
Chandler et al. 2011 wild-caughtD. melanogaster surface washed whole flies/gut
19*** (n.s.) 11.5 2.03 n.s. (***) 0.52 83 clone library
27F 1492R Corby-Harris et al. 2007 wild-caughtD. melanogaster surface washed
whole flies
24*** (n.s.) 15.8 n.a. n.a. 66 clone library
27F 1522R Cox and Gilmore 2007 wild-caughtD. melanogaster surface washed
whole flies
25*** (n.s.) n.a. 2.3*** (***) n.a. 211 clone library
27F 1492R
***P,0.001, **P,0.01,
*P,0.05 Student’s T-test; n.s. = non significant; n.a. = not available.
P-values are relative to caught flies in this study. Values and p-values in parentheses are for subsampling our samples to 100 16S rRNA gene sequences per sample to make the results comparable to other studies on wild-caughtDrosophila. Values in square brackets are for removing all OTUs that contain fewer than 10 sequences from the analysis to make our study more comparable to Wonget al.[20].
doi:10.1371/journal.pone.0070749.t002
Drosophil
a
Associated
Bacteria
PLOS
ONE
|
www.ploson
e.org
5
August
2013
|
Volume
8
|
Issue
8
|
lab-reared flies (72.7%), but comprises only 1.2% of the bacterial communities in flies from the Petrov lab. On the other hand,
Lactobacilluscontributes a substantial fraction of sequences in lab-reared flies (60.4% in Petrov lab, 19.1% UCSD Stock Center) while playing only a minor role in wild-caught flies (0.5%). In addition,Leuconostocis common in the Petrov lab (28.0%) but rare (1%) in wild-caught flies and the UCSD Stock Center (,1%). Inspection of individual samples revealed that the relative abundance of Leuconostoc is highly variable across D. melanogaster
andD. simulans. In Petrov lab flies, relative abundance ranges from 87.6% and 84.5% in samples m.pet1 and s.pet1, respectively, to being undetectable in m.pet4, m.pet5, s.pet2, and s.pet5 (Figure 2C).
In addition to differences in broad patterns of community composition, we also detected two wild-caught samples dominated by genera that are rare overall: 80.3% of all sequences in theD. melanogastersample m.ora1 collected from oranges were classified as
Enterococcus (80.3%), while the sample m.str collected from strawberries has a high prevalence of Providencia (26.3%). The relative abundance ofEnterococcusis smaller than 0.5% in all other wild-caught samples.Providenciawas detected in only three other samples at a relative abundance smaller than or equal to 1%.
Intriguingly, 92% (1165 sequences) of allProvidenciasequences from sample m.str are identical, suggesting the presence of a single, high-frequency Providencia strain in m.str. The highly prevalent sequence from sample m.str is 100% identical to the sequence ofP. alcalifaciensfrom Juneja and Lazzaro [38], while it differs from all other Providencia sequences in [38] by at least two positions (Figure 3A).P. alcalifacienswas shown to be highly virulent inD. melanogaster [7] causing the highest mortality amongst all strains tested and reaching cell counts of up to 106colony forming units per fly.
By grouping all sequences into 97% identity OTUs we sought to obtain a more detailed picture of bacterial community composi-tion. Figure 3B depicts the relative abundance of the ten most abundant OTUs across all samples. A single OTU classified as
Gluconobacter is common among all wild-caught flies (34.7% average relative abundance, OTU 25), but completely absent from lab-reared flies. Even in the wild-caught fly sample m.ora1 that is dominated by an Enterococcus OTU (OTU 60) this
GluconobacterOTU represents 8.9% of all non-Enterococcus sequenc-es. Because this OTU is common in all wild-caught flies, and specific to wild-caught flies, it is a strong candidate for being a member of aD. melanogasterand D. simulans core microbiome in nature. ThreeAcetobacterOTUs are also common in wild-caught flies (OTUs 26, 23, and 29). However, these OTUs are rare in flies collected from oranges and OTU 26 is also prevalent in lab-reared flies from the UCSD Stock Center. In lab-reared flies, especially flies from the Petrov lab, three Lactobacillus OTUs are common (OTU 28, 22, and 35). The abundance of these OTUs is highly variable between samples, with one dominant OTU (OTU 28) that is common in most Petrov lab samples, while the other two OTUs are at high frequency in the larval samples mpet1_l (OTU 22) and m.pet6_l (OTU 35). The second most commonAcetobacter
OTU (OTU 38) is common only in the UCSD Stock Center samples and larval sample s.pet3_l. In UCSD samples, this OTU is strongly negatively correlated with OTU 26 (P= 2.961025,
r2= 0.64), which was also classified asAcetobacter.
The composition of bacterial communities associated with flies differ between laboratories and the wild
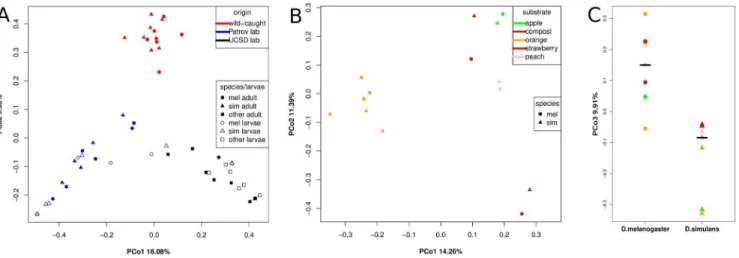
In order to further explore the factors shaping the observed variation in bacterial communities between lab-reared and wild-caught flies, we carried out a Principal Coordinate Analysis
(PCoA) using pairwise Jaccard distances. Jaccard distances compare the number of OTUs that are shared between two communities to the total number in both communities, with a smaller proportion of shared OTUs leading to an increased Jaccard distance. Jaccard distance analysis requires that the same number of sequences is used in each sample. This is because samples that contain more sequences are more likely to include low frequency OTUs that can appear private to that sample and inflate Jaccard distances. We thereforein silicocapped the number of sequence reads per sample to a common number by subsampling. In order to test for potential stochastic effects of subsampling on our results, we analyzed 1000 bootstraps of the subsampling for all PCoAs presented.
Figure 4A shows the position of all samples analyzed in this study relative to the first two PCos. PCo1 explains 16.1% of the variation and separates wild-caught, Petrov lab, and UCSD Stock Center communities from each other (P,5.4 10215and r2= 0.79, ANOVA, 100% of bootstraps P,1.9610211). PCo2 explains
9.9% of the variation and separates wild-caught from lab-reared flies (P,2610216 and r2= 0.87, ANOVA, 100% of bootstraps
P,9.3610213). These results suggest that Petrov lab, UCSD Stock
Center, and wild-caught flies all have their own distinct bacterial communities.
Similarity between larval and adult samples from the same laboratory further underscores the importance of the origin of the flies (Petrov lab, UCSD Stock Center) for the composition of their associated microbiota. The only exception is Petrov labD. simulans
larval sample 3 (s.pet3_l), which grouped closer to the UCSD samples in Figure 4A and has a more UCSD-like community dominated byAcetobacter(Figure 2C).
Communities of wild-caught flies differ by substrate and betweenD. melanogaster andD. simulans
We analyzed paired samples of wild-caughtD. melanogasterand
D. simulansisolated from five different natural substrates (oranges, apples, peaches, strawberries, and compost) in order to elucidate the influence of substrate on fly-associated bacterial communities in the wild. Figure 4B shows a PCoA including only wild-caughtD. melanogasterandD. simulanssamples. Communities of flies collected from oranges at three different sampling locations are clearly separated from the remaining samples by PCo1 (P= 0.00017, r2= 0.71, ANOVA, 100% of bootstrapsP,0.008). PCo2 separates bacterial communities from the flies collected from the compost pile and those from the flies collected from the fruit substrates (P,0.001, r2= 0.61, ANOVA, 98.1% of bootstraps P
,0.05), indicating that food substrate or a variable correlated with food substrate is an important factor shaping fly-associated bacterial communities. Interestingly, communities of flies from strawberries, apples, and peaches are relatively similar irrespective of sampling location. Flies from strawberries were collected from a sampling location on the West coast of the US while flies from apples and peaches were collected on the East Coast of the US.
While the first two PCos in the PCoA of wild-caught flies (Figure 4B) reflect differences related to food substrate, PCo3, PCo4, and PCo5 reveal a more subtle, but significant difference between the communities associated with the two fly species. In 78% of all subsampling bootstraps, we found a significant difference (ANOVA P,0.05) between D. melanogaster and D. simulans associated microbial communities along these PCos (Figure S1). This represents a significant enrichment of low
p-values (P,4.96102149, Chi-squared test). An example from
these bootstraps, in which PCo3 differentiates between D. melanogaster and D. simulans, is given in Figure 4C (P= 0.0011, r2= 0.60, ANOVA). We do not detect such a difference between lab-rearedD. melanogasterandD. simulans(data not shown).
Discussion
In this study we focused primarily on understanding the factors that shape Drosophila-associated bacterial communities, with an emphasis on the relative roles of environmental and host species effects. In order to disentangle environmental from host species effects, we collected and compared sample pairs ofD. melanogaster
andD. simulansfrom the same natural substrates. We extended this approach by analyzing these two species under controlled laboratory conditions. Finally, in order to generalize our results, we also analyzed a set of host species spanning the Drosophila
phylogeny. A correlation between genetic distance of different fly species and the dissimilarity of their bacterial communities under controlled conditions would be an indication that genetic differences between host species could play a role in shaping fly bacterial communities. Therefore, we extracted bacterial DNA from whole flies by carrying out extensive tissue homogenization. The bacterial load on the fly surface is known to be,10 times
lower than the interior load [29]. Therefore, the influence of external bacteria on the total community composition is expected to be rather minor. Additionally, our focus on the total bacteria associated with the whole fly, and not only the intestinal tract, was motivated by the belief that bacteria associated with fly surfaces might play important roles in shaping the fly environment. This is supported by Ren et al. [29] who found acetic acid bacteria accumulating in bristled areas on the fly surface, likely forming biofilms and by Barataet al. [33] who demonstrated that damaged grapes do not acquire acetic acid bacteria when insects, particularlyDrosophila, are physically excluded. These acetic acid bacteria could very well be transported on the fly surface. Note that even though we aspirated flies from individual fruit and attempted to associate bacterial communities with the substrate, we likely sampled bacterial communities that the fly has acquired during its life span. This includes bacteria from the particular fruit from which it was sampled, but could also include bacteria potentially from prior locations.
Figure 4. PCoA of Jaccard distances based on 97% identity OTUs.(A) All samples in this study. Colors are according to origin. (B) Wild-caught samples. Colors are according to food-substrate (C) Wild-caught samples PCo3. D. melanogaster and D. simulansdiffer significantly for PCo3 (P= 0.0011). Colors are according to food-substrate.
doi:10.1371/journal.pone.0070749.g004
DrosophilaAssociated Bacteria
Factors shaping natural fly associated communities We determined that substrate or a strongly correlated variable is the most important factor shaping bacterial communities in wild-caught flies. Diet has been previously suggested as a major determinant of bacterial community composition in mammals [14,15,39] and flies [32] and our results agree with these findings. The most distinct bacterial communities were associated with flies collected from oranges. Oranges contain citric acid and might have a lower pH than other substrates. Furthermore, orange peel contains essential oils that have bactericidal properties that might influence the bacterial community composition [40]. Although the substrate appears to be a plausible factor shaping the communities here, we cannot disentangle its effects from seasonal effects (e.g. temperature, humidity). This is because we collected flies from different substrates at different times of the year when the respective fruit were ripe.
We carefully sampled D. melanogaster and D. simulans across different sites and substrates in nature which allowed us to disentangle environmental effects from host species effects on microbial community composition. We found evidence that host fly species identity (D. melanogaster vs. D. simulans) detectably influences the associated microbial communities, but that the effect is subtle. Although our power comparing lab-rearedD. melanogaster
andD. simulansmight be lower because of smaller sample size and restriction to fewer sequences, mainly due to high Wolbachia
prevalence in some lab-reared samples, it is intriguing that this host species effect is detectable only in the wild and could not be detected in lab-reared flies. Moreover, while we detected differences between two closely related sister species in the wild, we could not detect any differences for nine substantially more divergentDrosophila species in the lab. We found no correspon-dence of distances between bacterial communities and genetic distances between nine lab-reared fly species (Table S2), unlike Ochmanet al.[16] and Leyet al.[15], who found this correlation in primates and other mammals. Taken together these findings imply that the effects of host species on microbial communities are rather subtle in drosophilids and/or need natural environmental conditions to manifest themselves.
The observed difference betweenD. melanogasterandD. simulans
microbial communities might be caused by a variety of host-associated factors, such as arrival times at fruit [41,42], age distributions in the wild (Emily Behrman and Paul Schmidt, University of Pennsylvania, personal communication), or host genetic differences [12,25,43].
Composition of bacterial communities in the lab and in the wild
PCoA revealed that, in concordance with earlier studies [30,32], bacterial communities associated with Drosophila differ sharply between different laboratories and between laboratories and the wild. Interestingly, bacteria from different genera, but with similar metabolic properties, dominate the communities of wild-caught, Petrov lab, and UCSD Stock Center flies.Gluconobacterspecies are the most prevalent bacteria in wild-caught flies in our study. This is in accordance with Corby-Harris et al. [31], who also find abundantGluconobactersequences in wild-caught flies, but different from Chandler et al. [32] who find a smaller fraction of
Gluconobacter sequences. More than 90% of all Gluconobacter
sequences in our study can be grouped into a single OTU that is common in all wild-caught flies. In contrast, Gluconobacter is almost absent from the lab strains. Thus, this OTU is a strong candidate for being a major member of a core microbiome that is shared among and specific to wild-caughtD. melanogaster andD. simulans. Gluconobacter belongs to the same family
(Acetobacter-aceae) asAcetobacter, which is also common in wild-caught flies with the exception of flies from oranges that carry less Acetobacter. Acetobacteris also the most prevalent genus in flies from the UCSD Stock Center and has very similar metabolic capabilities. Both genera,GluconobacterandAcetobacter, oxidize sugars and alcohol to acetic acid, and tolerate low pH as well as high ethanol concentrations [44]. Acetic acid bacteria have been reported to occur in association with many insect species and a role as important symbionts has been postulated by Crotti et al. [45].
Lactobacilluswhich is at high prevalence in Petrov lab flies, tolerates low pH and high ethanol concentrations as well, but instead oxidize sugars to lactic acid [46]. The high prevalence of bacteria with similar metabolic capabilities, tolerance of low pH, and high ethanol concentrations strongly suggests that there is environmen-tal selection for these bacterial groups. Rotting fruit, the most important natural substrate forD. melanogasterand D. simulans in our study, contain high amounts of sugar and are known to be colonized by a variety of ethanol producing yeasts [47]. Yeasts can produce high alcohol concentrations, thereby generating a nutrient rich environment for acetic acid or lactic acid producing bacteria (Acetobacteraceae and Lactobacillaceae), while inhibiting the growth of those less tolerant to alcohol. The production of these acids selects for acid tolerant microorganisms including the microorganisms that produced the acids in the first place. This suggests that environmental selection [48] is an important factor for the observed prevalence of these bacteria.
Interestingly bacteria of the genusLactobacillus, which have been associated with effects on Drosophila growth [28] and even assortative mating [49], are prevalent only in the lab in our study. Sixty percent of all sequences from Petrov lab flies, and 19% of all sequences obtained from UCSD Stock Center flies areLactobacillus. In most wild-caught samplesLactobacillusrepresented less than 1% of all sequences. This finding is corroborated by results from Chandler et al. [32], who find an increase of the proportion of
Lactobacillus species in lab-reared flies. Thus, while studying the effects ofLactobacilluson drosophilids in the laboratory is useful as a general model for insect-microbe interactions, its relevance to
Drosophilain nature may be limited.
In contrast to Chandleret al.[32], who found that Enterobac-teriaceae from group Orbus are highly prevalent in Drosophila, these bacteria are absent or at very low frequency in our samples (not amongst the best BLAST hits for any of the 100 most abundant OTUs in our data set). Although two lower abundant OTUs (OTU 49 and OTU 221) have Orbus sequences among the top 50 BLAST hits, the sequences from [32] are not amongst these hits. We can only speculate about the reasons for this difference here. One possibility might be an epidemic of Orbus group bacteria in 2007 and 2008, when Chandler et al. [32] collected their samples.
the two majorAcetobacterOTUs (OTU 26 and 38) in the UCSD Stock Center flies is strongly antagonistic. This is in accordance with a model in which one of the OTUs quickly occupies an ecological niche and excludes its ecologically similar, close relative. Bacterial communities of lab-reared flies are highly variable in diversity and composition within and between laboratories in this study. Because fly phenotypes are influenced by bacteria [27,28,52], this bacterial variation can add to the variance of phenotypic traits. This makes it more difficult to detect genetic variation underlying phenotypic traits and reduces reproducibility between laboratories. The presence of a certain microbiota might also lead to unwanted results in genetic trait mapping: Genetic variation that is attributed to directly underlie a phenotypic trait might indeed interact with microbes that influence this trait instead, thus influencing the trait only indirectly. Monitoring of microbial communities during experiments in which phenotypes are measured could be a means to approach these difficulties.
Species richness of lab-reared and wild-caught
Drosophilaassociated bacterial communities
Although diversity varies strongly across different samples from lab-reared flies, their bacterial communities are on average less diverse than those of wild-caught flies. This has been reported previously [30,32,53].
The three most plausible explanations for this pattern in our study are: (i) laboratory fly food is highly homogeneous and contains antimicrobial preservatives, proprionic acid and Tego-sept(r) in our case, which inhibit bacterial growth and likely reduce bacterial diversity, (ii) the transfer of flies to vials with fresh food during stock keeping could lead to ecological drift [50], which reduces diversity in the long run due to potential loss of taxa, (iii) while there is a constant influx of new bacteria into natural fly habitats, e.g. from other insects or via aerial transport, this influx is limited by cotton-sealed vials used inDrosophilahusbandry.
It is known that species richness is often overestimated using pyrosequencing approaches (e.g. [54]). We applied rigorous quality filtering and Chimera detection (see Materials and Methods) and used an OTU threshold of 97% identity which is thought to be robust against sequencing and PCR errors [54]. Although we take all these measures, we can not exclude that we are still overestimating the diversity in our samples. On the other hand overly stringent removal of sequences might make us miss important aspects of microbial communities [55].
Potential fly pathogens
The bacterial communities of certain wild-caught fly isolates contained potential Drosophila pathogens at high frequencies. In one sample ofD. melanogasterfrom strawberries, more than 25% of all sequences were identical to those of P. alcalifaciens whereas
Providenciais absent or at very low frequency in all other samples. This bacterium is known to be highly virulent in fruit flies [7], but reaches high bacterial loads in flies usually only when flies are systemically infected (personal communication, Brian Lazzaro, Cornell University).Enterococcuswas present at high abundance in oneD. melanogasterorange sample 1 (m.ora1, 80.3%), but virtually absent from all other samples.Enterococcusspecies were previously found to be associated with D. melanogaster [32] and are highly prevalent in the lab-reared flies studied by Cox and Gilmore [30]. These authors showed thatEnterococcuscan reach densities of 105 colony forming units per fly, causing severe disease symptoms and high mortality. This compares to a total of,104colony forming
units including all bacterial species in healthy flies [29,30]. The presence of these disease-associated genera in individual samples, and their absence or near absence from other samples
suggests that one or more flies were systemically infected in the samples that showed a high relative abundance of the disease associated genus. Thus, detection of infections with potential pathogens in natural fly populations seems possible by bacterial 16S rRNA gene sequencing. Hence, 16S rRNA sequencing could be a powerful means for the epidemiological monitoring of bacterial pathogens.
Conclusion
We show that under natural conditions the bacterial commu-nities associated withDrosophilacorrelate mainly with the substrate the flies have been collected from and to a smaller extent with fly species. Despite appreciable effort, we did not find evidence for host species effects on the bacterial communities under controlled laboratory conditions. Instead, laboratory of origin and stochastic effects on microbial communities are pronounced in the laboratory. This suggests that host genetic effects, as represented by genetic differences between the fly species in this study, might be rather small or absent in the lab, while there is potential for such effects under natural conditions. Furthermore, we find that acetic acid producing bacteria (Acetobacteracea) are ubiquitous symbionts ofDrosophilain nature. Intriguingly, it has been shown both thatD. melanogasterpromotes dispersal and establishment of these bacteria [33] and that the presence of acetic acid bacteria can have beneficial effects onD. melanogaster
larval growth and development time [27]. Together these findings suggest thatD. melanogasterand its siblings transport and establish the acetic acid bacteria on the substrates, which might modify these substrates in ways beneficial to the flies and their offspring. We speculate that the microbial community associat-ed withDrosophila can be seen as an external organ of the fly holobiont [56] in a similar way that the human gut flora has been referred to as the ‘‘forgotten organ’’ [57].
Materials and Methods Fly samples
D. sechellia(4021 0248.27), D. erecta(14021 0224.00),D. yakuba
(14021 0261.01), D. persimilis (14011-0111.49), D. pseudoobsura
(14011-0121.148), D. mojavensis (15081-1351.30) and D. virilis
(15010-1051.00) were obtained from the UCSD Stock Center as well as one additionalD. melanogaster(14021-0231.131) and oneD. simulans(14021-0251.250) strain. The UCSD Stock Center strain ID numbers are in parentheses.
Petrov lab D. melanogaster and D. simulans were originally collected in Portland, OR and San Diego, CA in 2008 and lab-reared on standard molasses corn meal diet for ,3 years (27 g
Agar, 75 g corn meal, 200 ml molasses, 42 g dry active yeast, 40 ml Tegosept, 15 ml propionic acid, in 2.8 l deionized water). Note that the food is boiled for 20 minutes killing most of the microbes in the food and that Tegosept is added after cooling down to prevent excessive microbial growth. We used flies from six independently acquired isofemale lines from each fly species (m.pet1–6 and s.pet 1–6). All lines were kept under the same conditions and on the same food, but in independent vials. DNA extractions and library preparations were performed indepen-dently for each line.
All adult lab-reared flies were transferred to fresh Petrov lab food vials 24 hours prior to DNA extraction. Petrov lab flies were taken from culture vials in the Petrov lab and placed on fresh food 24 hours prior extraction. UCSD Stock Center flies were taken from the vials we received from the Stock Center and placed on fresh Petrov lab food 24 hours prior extraction.
DrosophilaAssociated Bacteria
WildD. melanogasterandD. simulansfrom rotting apples, peaches, and a compost pile were collected in an orchard on the East coast of the USA (Johnston, RI) in August 2010. Flies from oranges were collected from three locations in the Central Valley of California USA: at a location close to Brentwood, at a site East of Manteca, and a site in Escalon in February and March 2011. Flies from strawberries were collected close to Waterford, CA in May 2011. All sampling sites were at least 10 km apart from each other. In most cases pairs ofD. melanogasterandD. simulanswere picked from the same individual fruit. Otherwise, flies were selected from the same type of fruit in close proximity. Flies were transported to the lab alive, in empty vials. On hot days, flies were slightly chilled using ice or car A/C. All flies were brought back to the lab within 5 hours of collection. Males ofD. melanogasterandD. simulanswere identified by genital morphology and stored at280uC until DNA extraction. Flies from Johnston, RI were shipped on dry ice to the Petrov lab for DNA extraction.
For the collection of larval samples from lab-reared flies, adult flies were transferred to fresh Petrov lab food vials for two days and then removed from the vial again. Vials containing eggs were kept at room temperature until larvae started to crawl out of the food for pupation. Larvae leaving the food and larvae of the same size that were still in the food were regarded third instar larvae and collected for DNA extraction. Excess food was removed from the larvae by transferring them to a microcentrifuge tube containing 500ml PBS (pH 7.4), vortexing for 3 seconds, and then discarding
the liquid. The larval samples correspond to the adult flies i.e. the sample named m.pet1_l was collected from the same isofemale line as m.pet1 using the procedure described above.
DNA Extraction and PCR
DNA was extracted from pools of five males, with the exception ofD. simulansorange sample 1 (s.ora1) andD. melanogasterorange sample 3 (m.ora3), for both of which we were able to retrieve three males only. Larval samples included three third instar larvae per sample. DNA extraction was performed using the Qiagen QIAamp DNA extraction kit (Qiagen, Carlsbad, CA) following the manufacturer’s protocol with the following modifications: Flies/larvae were incubated in buffer ATL containing proteinase K at 56uC for 30 min to soften and predigest the exoskeleton. Digestion was then interrupted by 3 minutes of bead beating on a BioSpec Mini Bead Beater 96 with glass beads 0.1 mm, 0.5 mm, and 1 mm in size (BioSpec, Bartlesville, OK), followed by another 30 min of incubation at 56uC. After addition of lysis buffer AL samples were incubated 30 min at 70uC and 10 min at 95uC. The remaining extraction procedure was performed according to the manufacturer’s protocol. Extraction controls were run in parallel with all samples to monitor contamination. Broad range primers (27F and 338R) were fused to identification tags and the 454 sequencing primers to amplify a fragment spanning the variable regions V1 and V2 of the bacterial ribosomal 16S rRNA gene. The primer sequences are (59-CTATGCGCCTTGC-CAGCCCGCTCAGTCAGAGTTTGATCCTGGCTCAG-39) and reverse (59 -CGTATCGCCTCCCTCGCGCCATCAGXX-XXXXXXXXCATGCTGCCTCCCGTAGGAGT-39). The Xs are a placeholder for identification tags (Multiplex Identifiers, MIDs); a different tag was used for each amplification reaction. Primers 27F and 338R are underlined. DNA was amplified using PhusionHHot Start DNA Polymerase (Finnzymes, Espoo, Finland) and the following cycling conditions: 30 sec at 98uC; 35 cycles of 9 sec at 98uC, 30 sec at 55uC, and 30 sec at 72uC; final extension for 10 min at 72uC). In order to reduce PCR bias, amplification reactions were performed in duplicate and pooled. In order to reduce the number ofWolbachia amplicons, PCR products were
restriction digested with 2ml FastDigestH BstZ17 (Fermentas,
Glen Burnie, MD) at 37uC for 30 min. BstZ17 was selected to specifically cut Wolbachia sequences close to the middle of the amplified region. Reaction products were run on an agarose gel, extracted using the Qiagen MinElute Gel Extraction Kit, and quantified with the Quant-iTTM dsDNA BR Assay Kit on a NanoDrop 3300 Fluorometer. Equimolar amounts of purified PCR product from each sample were pooled and further purified using Ampure Beads (Agencourt). The pool was run on an Agilent Bioanalyzer prior to emulsion PCR for final quantification. Resulting PCR products were run on a 454 sequencer using Titanium Chemistry. A set of samples was extracted using a FastPrep FP120 bead beater (Qbiogene, Carlsbad, CA). These samples includeD. erecta, D. yakuba, D. sechelliafrom the UCSD Stock Center, and wild-caught samples collected in Johnston, RI. These samples were sequenced twice, with and without the BstZ17 digest. Relative abundance of bacterial taxa correlated strongly between the two procedures for these samples after removal of Wolbachia reads (mean r2= 0.94). Therefore, we pooled the sequencing reads obtained with and without the digest to get a higher sequencing depth per sample.
Amplicons from samples with a highWolbachiaload were often so effectively digested that the final DNA yield was too small for library preparation. In order to have enough PCR-product for library construction, we shortened digestion time for amplicons from these samples to 5 minutes, resulting in an incomplete digest. Predictably, these samples yielded a high percentage ofWolbachia
sequences after the incomplete digest.
We verified the specificity of the BstZ17 for cuttingWolbachia
sequences by an in silico search for restriction sites in our sequences from undigested samples, all sequences from Chan-dleret al. [32], and all bacterial sequences in the SILVA data base. A very small fraction of non-Wolbachia sequences would have been cut in our sequence set from undigested samples (27 out of 23423) and the data from Chandleret al.[32] (18 out of 3243, mainly confined to a single sample). The majority of these sequences were classified as Rhizobiales.In silicosearch for the BstZ17 restriction site in sequences from the SILVA database revealed that the sequences that would have been cut by the restriction enzyme fall mainly into the orders of Rhizobiales, Myxococcales, and a non-Wolbachia Rickettsiales. Although these orders have either not been reported to be associated with Drosophila or occur only at very low numbers, the pretreatment with BstZ17 of most of our samples might have led to underestimation of their abundance in this study.
Data analysis
taxa with the classify.seqs command using the SILVA reference database and taxonomy with default settings. Sequences classified as Wolbachia were removed from further analysis. Grouping of sequences into OTUs was done using the MOTHUR implemented average neighbor algorithm. Inverted Simpson and Shannon diversity indices were generated with the collect.single command. Rarefaction sampling was performed with the rarefaction.single command. The sequence with the smallest distance to all other sequences in each OTU was picked with the get.oturep command using the weighted option and classified with the classify.otu command using the SILVA reference database and taxonomy. Representative sequences of the 100 most common OTUs were also searched in the nr/nt database of the National Center for Biotechnology Information (ncbi) using megablast with default settings via the web server (http://blast.ncbi.nlm.nih.gov/). Taxonomy information from the BLAST results was compared to the classification using the SILVA database. PCoA of Jaccard distances was performed applying the pcoa command on a Jaccard distance matrix generated with the dist.shared command. Because Jaccard distance is based on presence and absence of OTUs, it is sensitive to information from low abundance OTUs, even in the presence of other more abundant OTUs. In an abundance-based distance measure this information would likely be swamped by few extremely common OTUs. These consider-ations are particularly relevant to our study where a handful of bacterial families dominate the data (Figure 2A). Jaccard distances are also less prone to be affected by biased abundance measurements that can result from amplification biases during PCR amplification of the bacterial 16S rRNA gene. The downside of the sensitivity of Jaccard distances to low abundance OTUs is that samples with a higher number of bacterial sequence reads can be biased towards detecting more low abundance OTUs which inflates Jaccard distance. There-fore the number of sequences per sample wasin silicocapped to have the same number of sequences per sample before calculation of Jaccard distances. The caps were 912 sequences per sample for the PCoA of wild-caught flies and 116 sequences per sample for the PCoA including all samples.
Data Availability
The raw data can be found on MG-RAST [59] servers using the following IDs : 4523254.3, 4523281.3, 4523255.3, 4523282.3, 4523256.3, 4523283.3, 4523270.3, 4523297.3, 4523252.3, 4523279.3, 4523257.3, 4523284.3, 4523253.3, 4523280.3, 4523258.3, 4523260.3, 4523262.3, 4523264.3, 4523266.3, 4523268.3, 4523285.3, 4523287.3, 4523289.3, 4523291.3, 4523293.3, 4523295.3, 4523259.3, 4523261.3, 4523263.3, 4523265.3, 4523267.3, 4523269.3, 4523286.3, 4523288.3, 4523290.3, 4523292.3, 4523294.3, 4523296.3, 4523271.3, 4523300.3, 4523298.3, 4523304.3, 4523250.3, 4523275.3, 4523277.3, 4523302.3, 4523273.3, 4523272.3, 4523301.3, 4523299.3, 4523305.3, 4523251.3, 4523276.3, 4523278.3,
4523303.3, 4523274.3 and on datadryad.org under doi:10.5061/ dryad.5q1sb. The data in the dryad repository includes sequence quality. Table S3 contains information about the 100 most common OTUs including a representative sequence and relative abundances in all samples.
Supporting Information
Figure S1 P-value distributions for ANOVAs testing the alternative hypothesis that microbial communities dif-fer between wild caught D. melanogaster and D. simulans based on PCoA of Jaccard distances. If there was no species effect on microbial community composition, p-values are expected to be uniformly distributed. PCos 1–9 are displayed. Axes 3, 4, and 5 are enriched for low p-values indicating a species effect.
(PDF)
Table S1 Total number of sequences after quality filtering and the proportion of Wolbachia sequences for each sample.
(XLS)
Table S2 Non-significance of a correlation between bacterial community distances and genetic distances for the nine lab-reared Drosophila species obtained from the UCSD Stock Center.The genetic distances between the nineDrosophilaspecies were calculated genome wide using 4-fold degenerate sites. We tested for correlation of the genetic distances with different community distance measures at different OTU identity cutoffs. P-values based on Pearson’s correlation coefficient and Spearman’s rho are shown.
(PDF)
Table S3 100 most abundant OTUs.The table provides a representative sequence for each OTU, SILVA based taxonomy, and the relative abundance for of each OTU in individual samples (columns with sample names).
(XLS)
Acknowledgments
We thank Alan Bergland for providing samples and for helpful comments on the manuscript. We thank Silke Carstensen and Heinke Buhtz for excellent technical assistance. We thank Angus Chandler, Artyom Kopp, Jonathan Eisen and Brian Lazzaro for helpful discussions; and Anna Sophie Fiston-Lavier, Diamantis Sellis, Heather Machado, David Enard, and Nandita Garud for helpful comments on the manuscript. We thank David Lawrie for providing a genome wideDrosophilatree. We thank the UCSD Stock Center for providing samples.
Author Contributions
Conceived and designed the experiments: FS DAP. Performed the experiments: FS SK. Analyzed the data: FS DAP. Contributed reagents/materials/analysis tools: JFB EMB. Wrote the paper: FS DAP EMB JFB.
References
1. Nicholson JK, Holmes E, Kinross J, Burcelin R, Gibson G, et al. (2012) Host-Gut Microbiota Metabolic Interactions. Science 336: 1262–1267. doi:10.1126/ science.1223813.
2. Krause DO, Denman SE, Mackie RI, Morrison M, Rae AL, et al. (2003) Opportunities to improve fiber degradation in the rumen: microbiology, ecology, and genomics. FEMS Microbiology Reviews 27: 663–693. doi:10.1016/S0168-6445(03)00072-X.
3. McFall-Ngai M, Heath-Heckman EAC, Gillette AA, Peyer SM, Harvie EA (2012) The secret languages of coevolved symbioses: Insights from the Euprymna
scolopes–Vibrio fischeri symbiosis. Seminars in Immunology 24: 3–8. doi:10.1016/j.smim.2011.11.006.
4. Oliver KM, Russell JA, Moran NA, Hunter MS (2003) Facultative bacterial symbionts in aphids confer resistance to parasitic wasps. Proceedings of the National Academy of Sciences 100: 1803–1807.
5. Kaltenpoth M, Go¨ttler W, Herzner G, Strohm E (2005) Symbiotic bacteria protect wasp larvae from fungal infestation. Current Biology 15: 475–479. 6. Kaiser W, Huguet E, Casas J, Commin C, Giron D (2010) Plant green-island
phenotype induced by leaf-miners is mediated by bacterial symbionts. DrosophilaAssociated Bacteria
Proceedings of the Royal Society B: Biological Sciences 277: 2311–2319. doi:10.1098/rspb.2010.0214.
7. Galac MR, Lazzaro BP (2011) Comparative pathology of bacteria in the genus Providencia to a natural host, Drosophila melanogaster. Microbes and Infection 13: 673–683. doi:10.1016/j.micinf.2011.02.005.
8. Hurst GDD, Johnson AP, Schulenburg JHG, Fuyama Y (2000) Male-Killing Wolbachia in Drosophila: A Temperature-Sensitive Trait With a Threshold Bacterial Density. Genetics 156: 699–709.
9. Ferrari J, Vavre F (2011) Bacterial symbionts in insects or the story of communities affecting communities. Philosophical Transactions of the Royal Society B: Biological Sciences 366: 1389–1400. doi:10.1098/rstb.2010.0226. 10. Staubach F, Ku¨nzel S, Baines AC, Yee A, McGee BM, et al. (2012) Expression
of the blood-group-related glycosyltransferase B4galnt2 influences the intestinal microbiota in mice. The ISME Journal 6: 1345–1355.
11. Bakula M (1969) The persistence of a microbial flora during postembryogenesis of Drosophila melanogaster. Journal of invertebrate pathology 14: 365–374. 12. Ryu JH, Kim SH, Lee HY, Bai JY, Nam YD, et al. (2008) Innate Immune
Homeostasis by the Homeobox Gene Caudal and Commensal-Gut Mutualism in Drosophila. Science 319: 777–782. doi:10.1126/science.1149357. 13. Arumugam M, Raes J, Pelletier E, Le Paslier D, Yamada T, et al. (2011)
Enterotypes of the human gut microbiome. Nature 473: 174–180.
14. Wu GD, Chen J, Hoffmann C, Bittinger K, Chen Y-Y, et al. (2011) Linking Long-Term Dietary Patterns with Gut Microbial Enterotypes. Science 334: 105– 108. doi:10.1126/science.1208344.
15. Ley RE, Hamady M, Lozupone C, Turnbaugh PJ, Ramey RR, et al. (2008) Evolution of Mammals and Their Gut Microbes. Science 320: 1647–1651. doi:10.1126/science.1155725.
16. Ochman H, Worobey M, Kuo CH, Ndjango JBN, Peeters M, et al. (2010) Evolutionary Relationships of Wild Hominids Recapitulated by Gut Microbial Communities. PLoS Biology 8: e1000546. doi:10.1371/journal.pbio.1000546. 17. Muegge BD, Kuczynski J, Knights D, Clemente JC, Gonzalez A, et al. (2011)
Diet Drives Convergence in Gut Microbiome Functions Across Mammalian Phylogeny and Within Humans. Science 332: 970–974. doi:10.1126/sci-ence.1198719.
18. Yatsunenko T, Rey FE, Manary MJ, Trehan I, Dominguez-Bello MG, et al. (2012) Human gut microbiome viewed across age and geography. Nature 486: 222–228. doi:10.1038/nature11053.
19. Fraune S, Abe Y, Bosch TCG (2009) Disturbing epithelial homeostasis in the metazoan Hydra leads to drastic changes in associated microbiota. Environ-mental Microbiology 11: 2361–2369. doi:10.1111/j.1462-2920.2009.01963.x. 20. Wong CNA, Ng P, Douglas AE (2011) Low-diversity bacterial community in the
gut of the fruitfly Drosophila melanogaster. Environmental Microbiology 13: 1889–1900. doi:10.1111/j.1462-2920.2011.02511.x.
21. Broderick N, Lemaitre B (2012) Gut-associated microbes of Drosophila melanogaster. Gut microbes 3: 307–321.
22. Erkosar B, Storelli G, Defaye A, Leulier F (2013) Host-intestinal microbiota mutualism:‘‘learning on the fly’’. Cell host & microbe 13: 8–14.
23. Lemaitre B, Hoffmann J (2007) The Host Defense of Drosophila melanogaster. Annual Review of Immunology 25: 697–743. doi:10.1146/annurev.immu-nol.25.022106.141615.
24. Stensmyr MC, Dweck HKM, Farhan A, Ibba I, Strutz A, et al. (2012) A Conserved Dedicated Olfactory Circuit for Detecting Harmful Microbes in Drosophila. Cell 151: 1345–1357. doi:10.1016/j.cell.2012.09.046.
25. Lazzaro BP, Sceurman BK, Clark AG (2004) Genetic Basis of Natural Variation in D. melanogaster Antibacterial Immunity. Science 303: 1873–1876. doi:10.1126/science.1092447.
26. Lhocine N, Ribeiro PS, Buchon N, Wepf A, Wilson R, et al. (2008) PIMS Modulates Immune Tolerance by Negatively Regulating Drosophila Innate Immune Signaling. Cell Host & Microbe 4: 147–158. doi:10.1016/ j.chom.2008.07.004.
27. Shin SC, Kim SH, You H, Kim B, Kim AC, et al. (2011) Drosophila Microbiome Modulates Host Developmental and Metabolic Homeostasis via Insulin Signaling. Science 334: 670–674. doi:10.1126/science.1212782. 28. Storelli G, Defaye A, Erkosar B, Hols P, Royet J, et al. (2011) Lactobacillus
plantarum Promotes Drosophila Systemic Growth by Modulating Hormonal Signals through TOR-Dependent Nutrient Sensing. Cell Metabolism 14: 403– 414. doi:10.1016/j.cmet.2011.07.012.
29. Ren C, Webster P, Finkel SE, Tower J (2007) Increased Internal and External Bacterial Load during Drosophila Aging without Life-Span Trade-Off. Cell Metabolism 6: 144–152. doi:10.1016/j.cmet.2007.06.006.
30. Cox CR, Gilmore MS (2007) Native Microbial Colonization of Drosophila melanogaster and Its Use as a Model of Enterococcus faecalis Pathogenesis. Infection and Immunity 75: 1565–1576. doi:10.1128/IAI.01496-06. 31. Corby-Harris V, Pontaroli AC, Shimkets LJ, Bennetzen JL, Habel KE, et al.
(2007) Geographical Distribution and Diversity of Bacteria Associated with Natural Populations of Drosophila melanogaster. Applied and Environmental Microbiology 73: 3470–3479. doi:10.1128/AEM.02120-06.
32. Chandler JA, Lang JM, Bhatnagar S, Eisen JA, Kopp A (2011) Bacterial Communities of Diverse Drosophila Species: Ecological Context of a Host– Microbe Model System. PLoS Genetics 7: e1002272. doi:10.1371/journal.p-gen.1002272.
33. Barata A, Santos SC, Malfeito-Ferreira M, Loureiro V (2012) New Insights into the Ecological Interaction Between Grape Berry Microorganisms and Drosophila Flies During the Development of Sour Rot. Microbial Ecology 64: 416–430. doi:10.1007/s00248-012-0041-y.
34. Clark AG, Eisen MB, Smith DR, Bergman CM, Oliver B, et al. (2007) Evolution of genes and genomes on the Drosophila phylogeny. Nature 450: 203–218. doi:10.1038/nature06341.
35. Simpson EH (1949) Measurement of Diversity. Nature 163: 688–688. 36. Pruesse E, Quast C, Knittel K, Fuchs BM, Ludwig W, et al. (2007) SILVA: a
comprehensive online resource for quality checked and aligned ribosomal RNA sequence data compatible with ARB. Nucleic Acids Research 35: 7188–7196. doi:10.1093/nar/gkm864.
37. Schloss PD, Westcott SL, Ryabin T, Hall JR, Hartmann M, et al. (2009) Introducing mothur: Open-Source, Platform-Independent, Community-Sup-ported Software for Describing and Comparing Microbial Communities. Applied and Environmental Microbiology 75: 7537–7541. doi:10.1128/ AEM.01541-09.
38. Juneja P, Lazzaro BP (2009) Providencia sneebia sp. nov. and Providencia burhodogranariea sp. nov., isolated from wild Drosophila melanogaster. International Journal of Systematic and Evolutionary Microbiology 59: 1108– 1111. doi:10.1099/ijs.0.000117-0.
39. Ravussin Y, Koren O, Spor A, LeDuc C, Gutman R, et al. (2011) Responses of Gut Microbiota to Diet Composition and Weight Loss in Lean and Obese Mice. Obesity 20: 738–747. doi:10.1038/oby.2011.111.
40. Dabbah R, Edwards VM, Moats WA (1970) Antimicrobial action of some citrus fruit oils on selected food-borne bacteria. Applied microbiology 19: 27–31. 41. Nunney L (1996) The colonization of oranges by the cosmopolitan Drosophila.
Oecologia 108: 552–561.
42. Young TP, Chase JM, Huddleston RT (2001) Community succession and assembly comparing, contrasting and combining paradigms in the context of ecological restoration. Ecological Restoration 19: 5–18.
43. Lazzaro BP, Sackton TB, Clark AG (2006) Genetic Variation in Drosophila melanogaster Resistance to Infection: A Comparison Across Bacteria. Genetics 174: 1539–1554. doi:10.1534/genetics.105.054593.
44. Deppenmeier U, Hoffmeister M, Prust C (2002) Biochemistry and biotechno-logical applications of Gluconobacter strains. Applied Microbiology and Biotechnology 60: 233–242. doi:10.1007/s00253-002-1114-5.
45. Crotti E, Rizzi A, Chouaia B, Ricci I, Favia G, et al. (2010) Acetic Acid Bacteria, Newly Emerging Symbionts of Insects. Applied and Environmental Microbiol-ogy 76: 6963–6970. doi:10.1128/AEM.01336-10.
46. De Vos P, Garrity G, Jones D, Krieg NR, Ludwig W, et al. (2009) Bergey’s Manual of Systematic Bacteriology: Volume 3: The Firmicutes. Springer. 47. Rao RS, Bhadra B, Shivaji S (2008) Isolation and characterization of
ethanol-producing yeasts from fruits and tree barks. Letters in Applied Microbiology 47: 19–24. doi:10.1111/j.1472-765X.2008.02380.x.
48. Vellend M (2010) Conceptual Synthesis in Community Ecology. The Quarterly Review of Biology 85: 183–206.
49. Sharon G, Segal D, Ringo JM, Hefetz A, Zilber-Rosenberg I, et al. (2010) Commensal bacteria play a role in mating preference of Drosophila melanogaster. Proceedings of the National Academy of Sciences 107: 20051– 20056. doi:10.1073/pnas.1009906107.
50. Hubbell SP (2001) The unified neutral theory of biodiversity and biogeography. Princeton University Press.
51. Peay KG, Belisle M, Fukami T (2011) Phylogenetic relatedness predicts priority effects in nectar yeast communities. Proceedings of the Royal Society B: Biological Sciences 279: 749–758. doi:10.1098/rspb.2011.1230.
52. Linderman JA, Chambers MC, Gupta AS, Schneider DS (2012) Infection-Related Declines in Chill Coma Recovery and Negative Geotaxis in Drosophila melanogaster. PLoS ONE 7: e41907. doi:10.1371/journal.pone.0041907. 53. Tsiropoulos GJ (1983) Microflora associated with wild and laboratory reared
adult olive fruit flies, Dacus oleae (Gmel.). Zeitschrift fu¨r Angewandte Entomologie 96: 337–340.
54. Kunin V, Engelbrektson A, Ochman H, Hugenholtz P (2010) Wrinkles in the rare biosphere: pyrosequencing errors can lead to artificial inflation of diversity estimates. Environmental Microbiology 12: 118–123. doi:10.1111/j.1462-2920.2009.02051.x.
55. Auld RR, Myre M, Mykytczuk NCS, Leduc LG, Merritt TJS (2013) Characterization of the microbial acid mine drainage microbial community using culturing and direct sequencing techniques. Journal of Microbiological Methods 93: 108–115. doi:10.1016/j.mimet.2013.01.023.
56. Rosenberg E, Koren O, Reshef L, Efrony R, Zilber-Rosenberg I (2007) The role of microorganisms in coral health, disease and evolution. Nature Reviews Microbiology 5: 355–362. doi:10.1038/nrmicro1635.
57. O’Hara AM, Shanahan F (2006) The gut flora as a forgotten organ. EMBO reports 7: 688–693. doi:10.1038/sj.embor.7400731.
58. Edgar RC, Haas BJ, Clemente JC, Quince C, Knight R (2011) UCHIME improves sensitivity and speed of chimera detection. Bioinformatics 27: 2194– 2200. doi:10.1093/bioinformatics/btr381.