The role of different factors related to social impact of heavy rain
events: considerations about the intensity thresholds in densely
populated areas
L. Barbería1, J. Amaro1, M. Aran1, and M. C. Llasat2 1Meteorological Service of Catalonia, Barcelona, Spain
2Department of Astronomy and Meteorology, University of Barcelona, Barcelona, Spain Correspondence to: L. Barbería ([email protected])
Received: 30 November 2013 – Published in Nat. Hazards Earth Syst. Sci. Discuss.: 20 January 2014 Revised: 20 January 2014 – Accepted: 5 June 2014 – Published: 25 July 2014
Abstract. In the assessment of social impact caused by me-teorological events, factors of different natures need to be considered. Not only does hazard itself determine the impact that a severe weather event has on society, but also other fea-tures related to vulnerability and exposure.
The requests of data related to insurance claims received in meteorological services proved to be a good indicator of the social impact that a weather event causes, according to stud-ies carried out by the Social Impact Research Group, created within the framework of the MEDEX project. Taking these requests as proxy data, diverse aspects connected to the im-pact of heavy rain events have been studied.
The rainfall intensity, in conjunction with the population density, has established itself as one of the key factors in so-cial impact studies. One of the conclusions we obtained is that various thresholds of rainfall should be applied for areas of varying populations. In this study, the role of rainfall inten-sity has been analysed for a highly populated urban area like Barcelona. A period without significant population changes has been selected for the study to minimise the effects linked to vulnerability and exposure modifications. First, correla-tions between rainfall recorded in different time intervals and requests were carried out. Afterwards, a method to in-clude the intensity factor in the social impact index was sug-gested based on return periods given by intensity–duration– frequency (IDF) curves.
1 Introduction
The study of the impact that severe weather events have on a territory and its population is of maximum interest for soci-ety, involving a broad range of actors in addition to meteorol-ogy and climatolmeteorol-ogy specialists, such as emergency services, policymakers and insurance companies.
For this purpose, the Social Impact Research (here-after SIR) Group was created within the framework of the MEDEX project (MEDiterranean EXperiment on cyclones that produce high-impact weather in the Mediterranean; http: //medex.aemet.uib.es). Since 2008, the SIR Group has car-ried out several studies on this subject, centred in two re-gions of Spain, the Balearic Islands and Catalonia (Fig. 1). Requests related to insurance claims received at meteorolog-ical services were used as proxy data, as they proved to be a good indicator of social impact (Amaro et al., 2010). They reveal if an event has caused damages in accordance to the number of claims received because of adverse meteorologi-cal conditions. These claims can be translated into economic losses that citizens have to face. One of the advantages of this indicator is that it is reasonably objective because it depends on facts: the weather event causes material damage. On the contrary, one of the drawbacks is that the requests of reports can be altered by some factors, such as the insurance com-pany proceedings and the variations of freely available online data. On the other hand, the most severe weather events de-mand special treatment and do not usually require individual reports, but are handled globally by regions.
Figure 1. Geographical situation of Catalonia and the Balearic
Is-lands.
estimation of the risk (Llasat et al., 2009b), so it is a good indicator to verify the social impact of the analysed events.
A methodology for treating the requests was defined by the SIR Group, in order to use them in social impact studies. The SIR Group analysed the events that occurred in the Balearic Islands and Catalonia during the period 2000–2002 (Amaro et al., 2010). Afterwards, a cumulative index (CI) to indicate the social impact expected for rain events was established for each region. Indices are indirect numerical surrogates of real phenomena (Fekete, 2009). In our case, the CI could be a valuable tool to foresee the social impact.
The CI was built as a non-dimensional index, including the following factors: the maximum precipitation in 24 h of the event, population affected by rainfall exceeding 60 mm, length of the event and finally the coincidence with a strong wind event. Each factor was quantified on a scale from 1 to 10 according to different criteria for each of them (Amaro et al., 2010). As a result, the CI equation is
CI=LR+LP+LTR+LTW, (1)
whereLRis the level associated with the maximum rainfall in 24 h;LPis the level associated with the population affected by rainfall exceeding 60 mm;LTRis the level associated with the length of the rain event;LTWis the level associated with the coincidence with a strong wind event.
The events with a higher number of requests, and there-fore, more social impact, should have a greater CI (the max-imum possible value being 40). Even though the CI adjust-ment was suitable for most of the events, there were some exceptions which indicated that other factors ought to be con-sidered.
In this study, the analysis of the events that presented an unexpected CI adjustment in Catalonia during the period 2000–2002 has been carried out in order to define which other factors should be also taken into account (Fig. 2a). The revision’s results show that two main features stand out: pop-ulation density, which is connected with vulnerability, and rainfall intensity, related to hazard. As it has been observed, rainfall intensity is particularly relevant in densely populated areas, so studies for these areas require priority treatment. Therefore, a study of the intensity has been carried out for the city of Barcelona. According to the availability of
inten-Figure 2. (a) CI and (b) RCI calculated for SIR events between
2000 and 2002, ordered by number of requests. The factorLRis
shown in blue,LP(for the CI) orLP+LP40(for the RCI) in red, LTRin green andLTWin violet. Bars arranged from high (left) to
low (right) number of requests. The events discussed in Sect. 2 are highlighted.
sity data, this study has been completed for the period 2008– 2011.
The main goal of this paper is to determine the role of rainfall intensity in the social impact that rain events have in a densely populated area. After determining the influence of the rainfall intensity, the next aim is to find a suitable way to include it in the CI.
This paper is structured in three sections: first, a revision of the events that presented an unexpected CI adjustment will be made. Then, an assessment of the rainfall intensity factor will be carried out for the city of Barcelona, analysing its correlation with the requests related to insurance claims re-ceived after heavy rain events, and proposing a method to include this factor in the CI. Finally, some conclusions will be drawn and future work will be suggested.
2 Events’ revision
Out of the 49 heavy rain events obtained from the MEDEX database for the period 2000–2002 in Catalonia, 11 presented an unexpected CI adjustment. Consequently, an analysis of these events has been carried out in order to determine which modifications should be applied to the index (Fig. 2a).
which occurred on the 14 and 15 July 2001. The number of requests received (133) was higher than expected, according to the maximum rainfall in 24 h (98 mm). In fact, the CI for this event was quite low (Fig. 2a). Moreover, the analysis of requests by municipality showed that approximately half of them came from municipalities of Barcelona’s metropolitan area, where the maximum rainfall was around 40 mm/24 h (Fig. 3a). It is Catalonia’s most populated region (Fig. 3d), with more than 10 000 inh km−2, and the threshold of 60 mm in 24 h appears to be too high for it, as there was a remark-able social impact caused by a lower precipitation. According to press, there were 40 dispatches of firefighters during this event.
On the contrary, other events had less social impact than expected according to the requests received. One of the most outstanding examples is the 21–25 October 2000 event. Only 36 requests were received, with a high maximum accumu-lated rainfall of 270 mm recorded in 24 h (Fig. 3b). The main reason was that it affected mostly rural areas, where the pop-ulation density is low.
In the same way, Petrucci and Pasqua (2008) obtained high levels of damage in areas characterised by high population density, while in scarcely populated areas hydrogeological phenomena did not induce important damage. Consequently, the events’ revision suggests that different rainfall thresholds for differently populated areas ought to be applied (Barbería et al., 2011).
The studied cases also indicate that rainfall intensity, which was calculated on the basis of 30 min data, cannot be ignored. The 10 August 2002 event had a higher number of requests than expected according to the CI. It affected an ex-tensive part of Catalonia, including areas of the metropolitan area of Barcelona (Fig. 3c). There, the rainfall intensity ex-ceeded 20 mm in 30 min, which corresponds to the first level of warnings (Vilaclara et al., 2010) according to the thresh-olds applied in the Servei Meteorològic de Catalunya (here-after SMC) for civil protection warnings. Another similar ex-ample is the 14–15 July 2001 event, when rainfall intensity also exceeded 20 mm in 30 min in the Barcelona area. Con-sequently, exceeding this threshold is likely to be related to a high social impact.
On the other hand, we must bear in mind that during the same event of 14–15 July 2001, the maximum precipitation intensity (36.4 mm in 30 min) was recorded in the northern part of Catalonia, coinciding with the maximum rainfall in 24 h (Fig. 3a), but it caused a minor impact because this is a sparsely populated area (Fig. 3d). Therefore, the rainfall
28 January 2001 events exemplify the overestimation of the CI caused by the level associated with the coincidence with a strong wind event. These events have quite a low number of requests, but their CI stands out compared to other events with a similar number of requests.
On the other hand, the 20–24 September 2002 event illus-trates the overestimation caused by the level associated with the length of the event. According to the number of requests, it should have had a lower CI, but the number of days in-creased the CI value.
Finally, some phenomena that are more unusual can be de-cisive, like hail. In agricultural regions, during one single hail event, a high percentage of crops of an area can be damaged, causing a huge impact, regardless of the other factors. This was observed during the 14 and 15 July 2001 event, when hail affected between 80 and 100 % of fruit tree crops in a specific rural area in west Catalonia, so a considerable num-ber of requests were received from this region, despite the low population density. Hail must also be considered when urban areas are affected, as in the 10 August 2002 event, when hail of a diameter up to 4 cm was reported in cities near the Barcelona city area. This likely contributed to the significant number of requests received.
2.1 Conclusions of the revision
The events’ revision confirms that, in social impact assess-ment, areas of varying population should be approached in different ways. To carry out a regionalization, the most rele-vant fact is not the total population of a municipality, but the population density, which is also linked to the type of urban-ization and the land use. The more elements at risk and the more valuable and susceptible those elements are, the higher the vulnerability to flooding (Scheuer et al., 2011). Moreover, heavy rain can cause urban flooding when the city sewage system does not have enough capacity to drain away the rain during events of very intense precipitation (Petrucci and Pasqua, 2012). Thus, urbanisation enhances the risk (Niru-pama and Simonovic, 2007) and cities densely populated be-come more vulnerable.
Figure 3. Total precipitation and number of requests received from each municipality in the 6 months following the events of (a) 14–
15 July 2001, (b) 21–25 October 2000 and (c) 10 August 2002. Distribution of accumulated rainfall is represented with colours and the number of requests received by municipality is indicated in circles. The map of population density by municipality in Catalonia in the year 2001 is shown in (d); data obtained from the Instituto Nacional de Estadística (www.ine.es).
information for the period 2000–2002 prevents the inclusion of this factor in the CI.
As a first approach, to build the reassessed cumulative in-dex (RCI), a new threshold of 40 mm in 24 h for municipal-ities surpassing 10 000 inh km−2is suggested. The levels as-sociated with this new factor (LP40)follow the same criteria established by Amaro et al. (2010) for the levels associated with the population affected by rainfall exceeding 60 mm. Consequently, different levels have been obtained from
LP40=(Po40/PoT)·10, (2) where Po40 is the population affected by rainfall between 40 and 60 mm in municipalities surpassing 10 000 inh km−2; PoT is the total population of Catalonia.
The population affected by precipitation surpassing 60 mm is already considered in theLPfactor. Thus, theLPandLP40 factors together have a maximum value of 10.
On the other hand, the levels associated with the length of the rain event and with the coincidence with a strong wind event have to be reduced. In order to maintain 1 as the mini-mum value associated, root operation was selected to reduce the levels. The best results were achieved using the square root.
Accordingly, the resulting equation for the RCI for Catalo-nia is
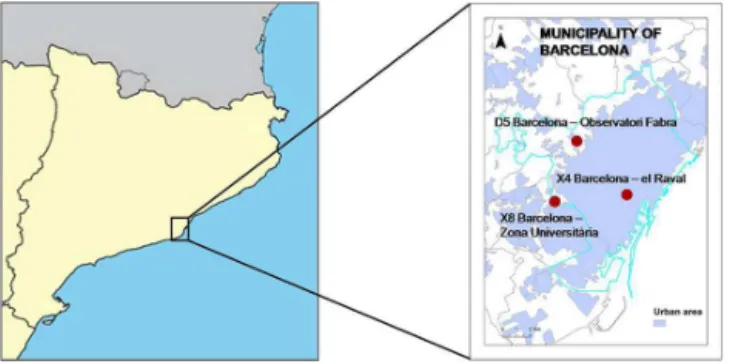
Figure 4. Location of the three SMC automatic rain gauges in
Barcelona.
affected by rainfall exceeding 60 mm; LP40 is the level as-sociated with the population affected by rainfall between 40 and 60 mm in areas of more than 10 000 inh km−2;L
TRis the level associated with the length of the rain event; andLTWis the level associated with the coincidence with a strong wind event.
After applying these adjustments, 7 events were modified by the improvement of the population factor, 27 events by the length of the event factor and 8 events by the strong wind factor.
Figure 2b shows the RCI with these corrections. All the events in the first and second quartile (lower number of re-quests) have values below 8, whereas in the CI some events in the first quartile were above it. That was too high consider-ing the low number of requests in comparison with the events of a higher impact, so a better adjustment has been achieved. On the other hand, in this approach the events with a higher impact have a RCI above 11. Nevertheless, there are some exceptions that could be explained by the intensity and hail factors, which are not included in the equation yet.
Consequently, the intensity factor should be added. In the same way as total rainfall, this parameter must be incorpo-rated in a specific way for regions of varying populations. In order to achieve that, a first assessment on the intensity role has been carried out for the city of Barcelona.
3 Focusing on hazard: the intensity factor
Damages can be caused by intense precipitation that does not amount to a high total quantity. According to Di-akakis (2011), there is a strong connection between peak storm intensity and flood occurrence. Therefore, this vari-able is essential for social impact studies. For Catalonia, a typology of floods was set up according to their hazard and potential impact (Llasat, 2009). This classification includes short-lived events of very intense precipitation caused by isolated cells or multicells with a limited horizontal exten-sion and episodes of heavy rain sustained for several hours caused by multicells or mesoscale convective systems. The occurrence of these flood events supports the fact that
high-2010 1 619 337 15 977.7
2011 1 615 448 15 939.3
intensity rainfall has a very remarkable impact on the Catalan territory regardless of the total quantity recorded in 24 h.
Risk has been described as the combination of hazard, ex-posure and vulnerability (UNISDR, 2012). As rainfall inten-sity is part of the hazard factor, in order to focus on this vari-able, a number of events where the other two factors are min-imised will be analysed. To achieve that, a fixed area and a period without significant changes in population have been selected: Barcelona, which is the most densely populated city in Catalonia, and the period 2008–2011.
3.1 Considerations about the selected period
The period 2008–2011 has been chosen taking into con-sideration, firstly, the rainfall data availability. Since 2008, the SMC has three automatic rain gauges in the city of Barcelona, which are located in different city areas (Fig. 4), and cover the pluviometric regimes that have been suggested for the Barcelona urban area (Rodríguez et al., 2012). There-fore, we can consider that most of the rain events that affected the city are included in the study.
For the city of Barcelona, an increase in the number of ex-traordinary floods was detected, particularly since the 19th century, due to rising vulnerability (Llasat et al., 2008), but on the other hand the number of catastrophic floods has de-creased thanks to the renewal of the drainage system of the city (Barrera et al., 2006). Consequently, it is important to select a period with no significant changes in vulnerability in order to reduce it to the point of being negligible. During the period 2008–2011 there were no significant changes in the city population (Table 1) so similar vulnerability can be assumed.
Figure 5. Total number of requests received in the SMC during the
years 2008, 2009, 2010 and 2011 and website statistics (page views) of www.meteo.cat during 2009, 2010 and 2011. A decrease in the requests was detected in the last few years, especially in 2011, co-inciding with an increase in said years page views.
they are not available. Data of the automatic weather stations are freely accessible in the SMC website, and citizens are likely getting acquainted with online data search. The high-est increase in page views took place during the year 2010, when the number of requests decreased, and this trend con-tinued in 2011. Consequently, different thresholds of requests ought to be considered when selecting the events that had a significant social impact.
3.2 Heavy rain events in Barcelona during 2008–2011 and their social impact
The rain events that took place during the 4-year period of 2008–2011 in the city of Barcelona and their social impacts have been analysed in this study. Rainfall data from three SMC automatic rain gauges in the city of Barcelona and re-quests received related to insurance claims have been col-lected. In the SMC a systematic quality control is applied to the data recorded by the automatic weather stations. It con-sists of a plausible value check (if the values are within the acceptable range limits) and time, internal and spatial con-sistency checks. These checks are performed daily, monthly and yearly, hence this procedure guarantees data reliability. Moreover, data recorded by the rain gauges of the sewer sys-tem in the city of Barcelona (hereafter CLABSA) has been used to verify the maximum rainfall of the events.
The selection of events was carried out as follows: first, a list of rain events was made according to the requests related to insurance claims received at the SMC. On the other hand, another list of rain events was made based on the records of the three automatic rain gauges mentioned before. The maximum rainfall in 24 h for each event was obtained from the daily data, recorded from 00:00 to 24:00 UTC. Also, the rainfall accumulation from 08:00 UTC on one day to 08:00 UTC on the following day was collected, in order to take into account the pluviometric day. Afterwards, the lists obtained from the requests and from the maximum rainfall were crossed.
The results showed that for the 2008–2010 period, the events that had five or more requests were the ones in which the maximum rainfall in 24 h exceeded 40 mm, with some ex-ceptions. For the year 2011, the events that had three or more
Table 2. Rain events in Barcelona during 2008–2011 exceeding
40 mm in 24 h, number of requests received in the SMC, and RCI, without considering population.
Maximum
Number rainfall
Date of requests in 24 h (mm) RCI
30 July 2011 41 53.8 4.0
22 October 2009 27 76.1 4.0
15 March 2011 24 93.9 5.0
19 July 2011 22 66.8 4.0
14 September 2009 18 57.6∗ 3.0
7 and 8 June 2011 14 61.2 4.4
10 May 2008 13 62.3 4.0
17 September 2010 13 70.9 4.0
12 July 2008 12 57.2 3.0
12 March 2011 12 91.6 5.0
2–4 November 2011 10 82.1 4.7
20 September 2009 9 48.5∗ 3.0
26 December 2008 8 44.0 3.0
10 October 2010 8 59.4 3.0
13 November 2011 7 51.6∗ 3.0
15 November 2011 7 48.8 3.0
28 October 2008 5 40.9 3.0
3 May 2010 5 54.3 3.0
24 October 2011 3 54.7 3.0
3 May 2011 3 40.6∗ 3.0
∗The values of maximum rainfall in 24 h marked with an asterisk were recorded by CLABSA rain gauges.
requests matched that threshold, except for two of them. For all the exceptions, even though no SMC rain gauge ex-ceeded an accumulated precipitation of 40 mm in 24 h, the exceedance of this value was recorded by the CLABSA rain gauges (Table 2). Therefore, the overcome of this threshold shows a clear correlation with a high social impact in the area of Barcelona. It verifies that 40 mm in 24 h is a suitable threshold for densely populated areas, as was proposed for the RCI equation (see Sect. 2.1).
Consequently, the events with a maximum rainfall over 40 mm in 24 h were selected, as they showed a relation with social impact. Twenty rain events met this criterion and the RCI was calculated for them (Table 2). As shown in Table 1, during 2008–2011 there were no significant changes in the population figures. Thus, the population factor will not have perceptible changes, and because of this, it was not necessary to include it in the RCI expression.
3.3 Correlations between rainfall in different time intervals and number of requests
7 and 8 June 2011 61.2 38.8 23.0 11.5
10 May 2008 62.3 12.0 8.4 5.0
17 September 2010 70.9 41.6 28.9 15.8
12 July 2008 57.2 47.6 39.2 17.0
12 March 2011 91.6 9.6 5.2 2.5
2–4 November 2011 82.1 43.9 32.0 15.2
10 October 2010 59.4 26.0 20.8 14.6
15 November 2011 48.8 20.6 15.3 8.5
3 May 2010 54.3 5.6 3.3 1.4
24 October 2011 54.7 11.9 9.9 6.1
Figure 6. Correlations between number of requests and maximum
rainfall in: (a) 24 h, (b) 60 min, (c) 30 min and (d) 10 min. Least squares regression has been applied. The 30 and the 10 min peri-ods show the best correlation with the number of requests, and the
p values near zero indicate very strong evidence against the null hypothesis of no linear association.
impact, but also which measurement periods are more sig-nificant. The periods of 24 h, 60, 30 and 10 min have been considered (Table 3). For 6 out of the 20 events, only accu-mulated rainfall values in 24 h were available, so 14 events have been included in the correlations.
Least squares regression has been applied and Pearson’s correlation coefficient has been calculated (Fig. 6). Signif-icance of the regressions has been tested and therefore, it has been proved whether the different variables considered are linearly related or not to the number of requests. The freely available statistical software package R has been used (http://www.r-project.org).
The results show that the maximum rainfall in 60, 30 and 10 min have statistically significant linear correlations with the number of requests (95 % confidence level). For the 30 and 10 min periods (Fig. 6c and d) the correlation is very similar, and thepvalues near zero indicate very strong ev-idence against the null hypothesis of non-linear association. The maximum rainfall in 60 min (Fig. 6b) is also correlated with the number of requests, but not as strongly as the maxi-mum rainfall in 30 and 10 min.
On the contrary, the maximum rainfall recorded in 24 h (Fig. 6a) does not show statistically significant linear corre-lation (95 % confidence level).
Therefore, the maximum rainfall in 30 min or the maxi-mum rainfall in 10 min should be included in the RCI in or-der to introduce the rainfall intensity factor, as these variables have the best ability to explain the number of requests. 3.4 Categories of intensity
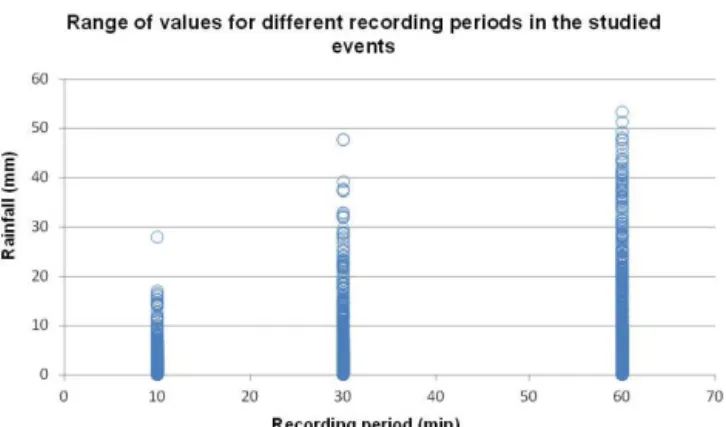
Figure 7. Range of values for the 10, 30 and 60 min period in the
studied events.
Table 4. Rainfall in 30 min calculated for different return periods
for the city of Barcelona, based on the generalised IDF curves equa-tion.
T I Rainfall
(year) (mm min−1) in 30 min (mm)
0.5 0.74 22.21
1 0.92 27.57
2 1.10 32.92
5 1.33 40.00
10 1.51 45.36
15 1.62 48.49
25 1.75 52.43
50 1.93 57.79
100 2.10 63.14
availability of historic data is higher for the 30 min measure-ment period than for the 10 min one.
For building categories, different criteria can be applied. In this study, the categories are based on return periods, so they are connected to the exceptionality of the events. The return periods are used for warning thresholds like Meteoalarm, where, for instance, return periods over 5 years correspond to red warnings (Stepek et al., 2012).
To determine the values of precipitation in 30 min as-sociated with different return periods, intensity–duration– frequency (hereafter IDF) curves have been used. For the city of Barcelona (Observatori Fabra) IDF curves were built (Pérez, 2012), with the generalised equation
I =15.2+4.26 lnT /(6.5+t )0.780, (4) whereI is the intensity in mm min−1;T is the return period in years;t is the duration in minutes.
The rainfall in 30 min was calculated for nine return pe-riods (0.5, 1, 2, 5, 10, 15, 25, 50 and 100 years) (Table 4). Based on the rounded values, ranges of rainfall in 30 min were ascribed values from 1 to 10 (Table 5) to build the levels
Table 5. Values ascribed for ranges of intensity in 30 min (see text
for details).
Range Intensity Range Intensity
(mm) level (LI) (mm) level (LI)
0–20 1 40–45 6
20–25 2 45 – 50 7
25 – 30 3 50 – 55 8
30 – 35 4 55 – 60 9
35 - 40 5 >60 10
of the intensity factor (LI). Value 1 corresponds to the
low-est intensity range and the 10 to the highlow-est. Therefore, the minimum value (1) will be for a maximum rainfall in 30 min associated with a return period below 0.5 year (between 0 and 20 mm), and the maximum (10) for a maximum rain-fall in 30 min associated with a return period beyond 50 years (more than 60 mm).
3.5 Reassessed cumulative index adjusted for densely populated areas
The categorization of rainfall intensity allows the introduc-tion of this variable in the RCI equaintroduc-tion. Therefore, the RCI for highly populated areas is
RCI=LR+LI+LP+LP40+L0TR,5+L 0,5
TW, (5)
whereLRis the level associated with the maximum rainfall in 24 h;LI is the level associated with the maximum
inten-sity in 30 min;LPis the level associated with the population affected by rainfall exceeding 60 mm;LP40 is the level as-sociated with the population affected by rainfall between 40 and 60 mm in areas of more than 10 000 inh km−2; L
TR is the level associated with the length of the rain event;LTWis the level associated with the coincidence with a strong wind event.
The LI factor will be different for each region. In this
study, the LI intensity factor was introduced for the city
of Barcelona. The RCI for the 2008–2011 events (Table 6) shows a better adjustment after introducing the intensity fac-tor. The population factor has not been taken into account because it does not vary, as was explained at the end of Sect. 3.2.
Considering the better adjustment achieved after the intro-duction of the intensity factor, the next stage should be to in-troduce it in the revision of the events recorded during the pe-riod 2000–2002 (Sect. 2). Particularly, the 14–15 July 2001 was one of the events with the highest number of requests but with a quite low RCI (below 11). As commented in Sect. 2, rainfall intensity was remarkable in the area of Barcelona, where the maximum rainfall in 30 min was 20.8 mm. This intensity corresponds to the second level of theLI(Table 5).
If we introduce theLI in the RCI of this event, we obtain a
15 March 2011 24 5.0 10.0
19 July 2011 22 4.0 8.0
7 and 8 June 2011 14 4.4 6.4
10 May 2008 13 4.0 5.0
17 September 2010 13 4.0 7.0
12 July 2008 12 3.0 8.0
12 March 2011 12 5.0 6.0
2–4 November 2011 10 4.7 8.7
10 October 2010 8 3.0 5.0
15 November 2011 7 3.0 4.0
3 May 2010 5 3.0 4.0
24 October 2011 3 3.0 4.0
a high social impact. However, this improvement cannot be applied to the other events yet because theLI is not still
cal-culated for all of Catalonia.
Thus, a specific study for each region is needed. Moreover, the importance of intensity should be evaluated to determine if its correlation with social impact is high in other areas that are not so densely populated. We must keep in mind that the lack of IDF curves may be a drawback for obtaining the LI factor for all the areas. To overcome this disadvantage,
an association between a municipality which has data and other areas with a similar precipitation regime could be car-ried out.
4 Conclusions
The role of different factors related to the social impact of rain events has been considered in this study. Based on the work achieved by the SIR Group (Amaro et al., 2010), a re-vision of cases has been carried out, in order to improve the CI which was established to indicate the social impact ex-pected for rain events.
The events’ revision confirms that, in social impact assess-ment, areas of varying populations should be approached in a different way. The degree of urbanisation stands out as a crucial variable which cannot be ignored, demanding a re-gionalisation based on population density.
Regarding the CI, some improvements are introduced to build the RCI. For municipalities surpassing a population density of 10 000 inh km−2, a new threshold of 40 mm has been defined for heavy rain events. For other regions, the threshold of 60 mm in 24 h that was established in the pre-vious study is likely to be suitable.
lower number of requests) have values below 8, quite reason-able compared with the events with a higher social impact, which present RCI values above 11. Nevertheless, other fac-tors, such as hail and rainfall intensity, should be taken into account.
Hail can be a crucial factor in agricultural regions or when densely populated areas are affected by this phenomenon. In these cases, this parameter should be considered. However, this factor has not been analysed due to the lack of systematic hail information in the SMC during the studied period.
The importance of rainfall intensity has been demonstrated for a densely populated urban area like the city of Barcelona. The heavy rain events that took place during the period 2008– 2011 have been analysed. The results show that there is a statistically significant linear correlation (95 % confidence level) between the rainfall recorded in 60, 30 and 10 min and the requests related to insurance claims. The best correlation has been observed for the 30 and 10 min periods, being both very similar. In accordance with the SMC data availability, the 30 min period has been used to asses the social impact of the rain events.
A method for including the intensity factor in the social impact index has been suggested, based on return periods ob-tained from IDF curves. The results show a better adjustment of the RCI to assess the social impact of weather events in highly populated areas when the intensity factor is consid-ered.
Future work will be aimed at carrying out a regionalization based on the vulnerability of the territory, suggesting differ-ent thresholds of rainfall for each area. Furthermore, in order to introduce the intensity factor in the equation, IDF curves need to be calculated for more regions. Therefore, the RCI would become a useful tool to foresee events with high social impact and it will allow a better management of contingency plans in vulnerable areas.
Acknowledgements. The authors would like to thank Mercè
Barnolas and Marta Adell for their helpful contribution and Juan Carlos Peña and Núria Pérez for their valuable comments about IDF curves. Also, we would like to thank the referees for their valuable and constructive suggestions.
Edited by: G. Boni
References
Amaro, J., Gayà, M., Aran, M., and Llasat, M. C.: Pre-liminary results of the Social Impact Research Group of MEDEX: the request database (2000–2002) of two Meteoro-logical Services, Nat. Hazards Earth Syst. Sci., 10, 2643–2652, doi:10.5194/nhess-10-2643-2010, 2010.
Amaro, J., Barbería, L., Aran, M., and Llasat, M. C.: Social anal-ysis of high intensity rain events (May–October) in Catalo-nia, poster contribution, Hymex Conference, available at: http: //www.researchgate.net, 2012.
Barbería, L., Amaro, J., Aran, M., and Llasat, M. C.: Social im-pact analysis of two heavy rain events in Catalonia: 14–15 July 2001 and 21–25 October 2000, poster contribution, Plinius Con-ference, available at: http://www.researchgate.net, 2011. Barrera, A., Llasat, M. C., and Barriendos, M.: Estimation
of extreme flash flood evolution in Barcelona County from 1351 to 2005, Nat. Hazards Earth Syst. Sci., 6, 505–518, doi:10.5194/nhess-6-505-2006, 2006.
Diakakis, M.: Rainfall thresholds for flood triggering, the case of Marathonas in Greece, Nat. Hazards, 60, 789–800, doi:10.1007/s11069-011-9904-7, 2011.
Fekete, A.: Validation of a social vulnerability index in context to river-floods in Germany, Nat. Hazards Earth Syst. Sci., 9, 393– 403, doi:10.5194/nhess-9-393-2009, 2009.
Llasat, M. C.: High magnitude storms and floods, in: The Physical Geography of the Mediterranean basin, Part 4 – Natural Hazards, chap. 24, edited by: Woodward, J., Oxford Univ. Press, Oxford, 513–540, 2009.
Llasat, M. C., López L., Barnolas, M., and Llasat-Botija, M.: Flash-floods in Catalonia: the social perception in a context of a chang-ing vulnerability, Adv. Geosci., 17, 63–70, doi:10.5194/adgeo-17-63-2008, 2008.
Llasat, M. C., Llasat-Botija, M., Barnolas, M., López, L., and Altava-Ortiz, V.: An analysis of the evolution of hydrom-eteorological extremes in newspapers: the case of Catalo-nia, 1982–2006, Nat. Hazards Earth Syst. Sci., 9, 1201–1212, doi:10.5194/nhess-9-1201-2009, 2009a.
Llasat, M. C., Llasat-Botija, M., and López, L.: A press database on natural risks and its application in the study of floods in Northeastern Spain, Nat. Hazards Earth Syst. Sci., 9, 2049–2061, doi:10.5194/nhess-9-2049-2009, 2009b.
Llasat, M. C., Llasat-Botija, M., Prat, M. A., Porcú, F., Price, C., Mugnai, A., Lagouvardos, K., Kotroni, V., Katsanos, K., Michaelides, S., Yair, Y., Savvidou, K., and Nicolaides, K.: High-impact floods and flash floods in Mediterranean coun-tries: the FLASH preliminary database, Adv. Geosci., 23, 47–55, doi:10.5194/adgeo-23-47-2010, 2010.
Nirupama, N. and Simonovic, S. P.: Increases of flood risk due to ur-banisation: a Canadian example, Nat. Hazards, 40, 25–41, 2007. Pérez, N.: Anàlisi de les intensitats màximes de precipitació als observatoris de l’Ebre, Estartit i Fabra. Corbes IDF, University of Barcelona, available at: http://hdl.handle.net/2445/32384 (last access: 10 July 2014), 2012.
Petrucci, O. and Pasqua, A. A.: The study of past damaging hy-drogeological events for damage susceptibility zonation, Nat. Hazards Earth Syst. Sci., 8, 881–892, doi:10.5194/nhess-8-881-2008, 2008.
Petrucci, O. and Pasqua, A. A.: Damaging events along roads during bad weather periods: a case study in Calabria (Italy), Nat. Haz-ards Earth Syst. Sci., 12, 365–378, doi:10.5194/nhess-12-365-2012, 2012.
Rodríguez, R., Navarro, X., Casas, M. C., and Redaño, A.: Rainfall spatial organization and areal reduction factors in the metropoli-tan area of Barcelona (Spain), Theor. Appl. Climatol., 114, 1–8, doi:10.1007/s00704-012-0818-4, 2012.
Scheuer, S., Haase, D., and Meyer, V.: Exploring multicriteria flood vulnerability by integrating economic, social and ecological di-mensions of flood risk and coping capacity: from a starting point view towards an end point view of vulnerability, Nat. Hazards, 58, 731–751, 2011.
Stepek, A., Wijnant, I. L., van der Schrier, G., van den Besse-laar, E. J. M., and Klein Tank, A. M. G.: Severe wind gust thresholds for Meteoalarm derived from uniform return peri-ods in ECA&D, Nat. Hazards Earth Syst. Sci., 12, 1969–1981, doi:10.5194/nhess-12-1969-2012, 2012.
UNISDR: United Nations international strategy for disaster reduc-tion, available at: http://www.unisdr.org (last access: 10 July 2014), 2012.