www.atmos-chem-phys.org/acp/4/439/
SRef-ID: 1680-7324/acp/2004-4-439
Chemistry
and Physics
Volatile particles formation during PartEmis: a modelling study
X. Vancassel1,*, A. Sorokin2, P. Mirabel1, A. Petzold3, and C. Wilson4
1Centre de G´eochimie de la Surface, Universit´e Louis Pasteur, Strasbourg, France 2Central Institute for Aviation Motors, Moskow, Russia
3Deutsches Zentrum f¨ur Luft- und Raumfahrt, Oberpfaffenhofen, Germany 4QinetiQ, Farnborough, UK
*now at: Atmospheric, Oceanic and Planetary Physics, University of Oxford, UK
Received: 24 September 2003 – Published in Atmos. Chem. Phys. Discuss.: 18 November 2003 Revised: 1 March 2004 – Accepted: 3 March 2004 – Published: 17 March 2004
Abstract. A modelling study of the formation of volatile
particles in a combustor exhaust has been carried out in the frame of the PartEmis European project. A kinetic model has been used in order to investigate nucleation efficiency of the H2O−H2SO4binary mixture in the sampling system. A value for the fractionεof the fuel sulphur S(IV) converted into S(VI) has been indirectly deduced from comparisons between model results and measurements. In the present study, ε ranges between roughly 2.5% and 6%, depending on the combustor settings and on the value assumed for the parameter describing sulphuric acid wall losses. Soot parti-cles hygroscopicity has also been investigated as their activa-tion is a key parameter for contrail formaactiva-tion. Growth factors of monodisperse particles exposed to high relative humidity (95%) have been calculated and compared with experimental results. The modelling study confirms that the growth factor increases as the soot particle size decreases.
1 Introduction
The presence of volatile particles formed in young jet air-craft plumes has been first pointed out in the late 70’s (Hof-mann and Rosen, 1978). Assumed to be mainly composed of water and sulphuric acid, their induced perturbation on the background aerosol remains difficult to predict with regard to natural sources variability. It is however becoming increas-ingly apparent that the formation of new particles within the aircraft wake, at cruise altitudes, could have a significant in-fluence on atmospheric radiation processes, chemical com-position, and cloud coverage (IPCC, 1999).
The understanding of the potential impacts of aircraft generated aerosol still requires a better knowledge of the mechanisms of particle precursors formation and of ultrafine
Correspondence to: P. Mirabel
volatile particles generation. Numerous papers, involving in-situ measurements (Fahey et al., 1995; Schr¨oder et al., 1998; Brock et al., 2000) and also modelling studies have empha-sized the role of sulphur, chemi-ion and organic compounds on aircrafts plume microphysical processes (Yu and Turco, 1997; K¨archer et al., 1998; Yu et al., 1999). However, the ef-fect of engine operating conditions on the formation of these particles is not yet well understood. There is evidence that the number of volatile particles increases with increasing lev-els of sulphur in the fuel, but the conversion rateεat which the original sulphur (IV) is transformed to S(VI) i.e. SO3and H2SO4 remains highly discussed as a wide range of values has already been suggested (Schumann et al., 2002).
For example, on ground measurements by Frenzel and Arnold (1994) yieldedε>0.4% while in flight measurements yielded values ofεin the range 12–45% behind a Concorde (Fahey et al., 1995) or 6–31% behind a B757 (Miake-Lye et al., 1998). More recently,εin the range 0.34–4.5% has been derived for the ATTAS aircraft, a value which depends on the Fuel Sulphur Content FSC (K¨archer et al., 1998; Curtius et al., 1998, 2002; Schumann et al., 2002). A comprehensive list of ε values deduced from measurements can be found in Schumann et al. (2002). Previous modelling studies also lead to a wide range ofεvalues, from about 1–2% (Brown et al., 1996) to 20–30% (Yu and Turco, 1997) or even 25–60% (K¨archer and Fahey, 1997). However, the real situation may not be as confused as it seems and some recent efforts have considerably reduced these apparent discrepancies toε val-ues in the range 0.5–5% (K¨archer et al., 2000) or 0.5–10% (Schumann et al., 2002).
impact on contrail threshold conditions (Busen and Schu-mann, 1995). To improve the emission performance of en-gines, an extensive set of gaseous species and aerosol mea-surements has been conducted on a jet engine combustor test rig, in the frame of the EU project PartEmis (Measurement and Prediction of Emissions of Aerosols and Gaseous Pre-cursors from Gas Turbine Engines). One of the goals of PartEmis was to gain more information about the rate of sul-phur conversionε. For this, gaseous S(VI) (SO3+H2SO4) has been measured by chemical ionization mass spectrom-etry (Katragkou et al., 2004). In addition, the size dis-tribution in the combustion aerosol size range (diameter D>10 nm) was measured with a Scanning Mobility Particle Sizer (SMPS). Liquid aerosol particles measurements were achieved by operating a multi-channel Condensation Parti-cle Size Analyzer (CPSA; Stein et al., 2001). The CPSA provides number concentrations in the size bins D=4–7 nm, 7–9 nm, 9–20 nm, and>20 nm. One of the main results is that only the concentrations of particles in the size range 4– 7 nm, have shown a dependency on the FSC used during the test campaign (Petzold et al., 2003). Furthermore, the hy-groscopic properties of particles with dry diameters>30 nm were measured with a Hygroscopicity Tandem Differential Mobility Analyzer (H-TDMA), described by Weingartner et al. (2002).
To support these experiments, several modelling studies have been undertaken and in this article, we present mod-elling studies of the formation of volatile particles and of the hygroscopic properties of soot particles. Calculations have been performed with a comprehensive microphysical model.
2 Experimental setup and sampling system
A brief description of the combustor and test-rig used during PartEmis, is given below, and further details can be found in Wilson et al. (2004). A turbo-annular, transpiration cooled combustor was used for tests on QinetiQ’s High Pressure Combustion Rig at Farnborough, UK. Air was delivered from a compressor and heater unit. A back-pressurizing valve lo-cated downstream of the combustor maintained the correct pressure in the system. After extraction of sample exhaust at the combustor exit, the remainder of the high-temperature exhaust gases was cooled using water injection via a set of spray-bars. Water-cooled jackets provided additional cool-ing of pipework.
The exhaust was sampled close to the combustor exit by a probe (4 mm inner diameter), laterally moved to eleven transverse positions. This allowed the lateral distribution of gaseous and particles to be measured. Note that the extreme positions close to the walls were not used as their air fuel ra-tios were too far from the average value. After exiting the probe, the sample temperature was rapidly quenched to min-imise post sampling reactions, by a water cooling system, bringing its temperature to about 420 K avoiding any
con-densation of water and unburnt hydrocarbons in particular. The exhaust was then split and delivered to a diluted and to an undiluted sampling line which supplied each participant with the desired fraction of the sample. The diluted line, which concerns this study, was not insulated (contrarily to the undiluted line) and the sample naturally attained room temperature (∼20◦C) after dilution by a factor of about 60–
65. Dilution was achieved by means of a capillary tube with particulate free air at ambient conditions (293 K, 1052 hPa). The last part of the sampling line had an inner diameter of 21.12 mm and the total transit time was approximately 0.9 s from the tip of the probe to the measurement devices. Note that the Max-Planck Institute (MPI) which studied sulphur conversion mechanisms had its own and shorter sampling line.
Water emission indices have been measured for each po-sition of the probe as the exhaust was not homogeneously mixed. In addition to the water formed during the combus-tion, the dilution air relative humidity RH (equal to 35%) has been taken into account. However, relative humidity was also measured at the end of the sampling line and, at this point the relative humidity was about 5% (at such low relative humid-ity the accuracy of the device used is not very good). Thus, we have run our model using mainly a water vapour profile calculated following Eq. (2) with 2 boundary limits: RH (di-luter)=35% and RH (end of the tube)=5%. Two settings were used, in order to reproduce old and modern cruise conditions (see Table 1 for combustor settings details) and three differ-ent fuel sulphur contdiffer-ents FSC=50, 410 and 1270 ppm have been tested. As the extraction probe was very close to the exit smile, the temperature of the exhaust gases in the first part of the sampling line remained high (above 430 K) until the dilution point was reached. Therefore, no condensation was expected in this part of the sampling line. On the con-trary, the dilution of the sample with air at ambient temper-ature cooled it down very rapidly (more than 100◦C in less
than 10 ms), leading to a local supersaturation of the con-densing vapors. Therefore, particle formation was expected to take place only in the sampling line, just after the mixing of the sample with the cold diluting air.
Indeed, volatile particles were detected at the end of the sampling line, in the 4–7 nm size range but only for the high fuel sulphur case (FSC=1270 ppm). Model calculations de-scribed below confirm that only for this high FSC volatile particles are expected to be analysed with this experimental set up.
3 Model description
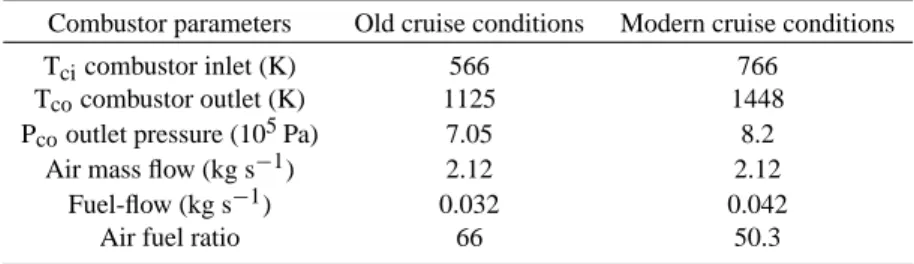
Table 1. Main settings of the combustor during PartEmis.
Combustor parameters Old cruise conditions Modern cruise conditions
Tcicombustor inlet (K) 566 766
Tcocombustor outlet (K) 1125 1448
Pcooutlet pressure (105Pa) 7.05 8.2
Air mass flow (kg s−1) 2.12 2.12
Fuel-flow (kg s−1) 0.032 0.042
Air fuel ratio 66 50.3
Turco, 1997; Taleb et al.,1997). Indeed, in a plume, temper-ature cools down very rapidly due to the entrainment of very cold ambient air in the wake. As a consequence, we have used a kinetic microphysical approach, similar to the one used by Yu and Turco (1997) (see also Yu and Turco, 2001). The model, based on coagulation processes in the sulphuric acid-water binary mixture (Sorokin et al., 2001) takes into account both charged (ions or charged clusters) and neutral species (molecules or clusters), the presence of charges hav-ing a stabilizhav-ing effect on clusters and enhances growth and coagulation. Large concentrations of chemi-ions have indeed been noted in aircraft engines or exhaust plumes (Arnold et al., 1998; Sorokin and Mirabel, 2001).
Contrarily to the classical nucleation theory which as-sumes that particles result from collisions between clusters and single molecules (or hydrates), the kinetic approach in-cludes in addition cluster-cluster collisions. In the case of particle formation from the sulphuric acid- water system, previous studies have revealed several interesting features which have been applied here: (i) given the very strong binding energy between sulphuric acid and water molecules, the formation of hydrates is expected in the vapor phase (Heist and Reiss, 1974; Jaecker-Voirol et al., 1987; Noppel et al., 2002). In fact, calculations show that most of the acid molecules are bound into stable hydrates made out of Naacid molecules andh water molecules; (ii) because of the very high dissymmetry between the vapor pressures of water and sulfuric acid (about 8–10 orders of magnitude) it is assumed that, between the incorporation of sulfuric acid molecules in a cluster, a cluster is in quasi-equilibrium with respect to ex-change of water molecules (Mirabel and Katz, 1974). This assumption which has been widely used in the literature con-cerning the atmosphere implies that for a given relative hu-midity the number of water molecules and therefore the size of a cluster (or in a particle) is determined by its number of acid molecules Na. The amount of water condensed on volatile particles has been assumed to adjust instantaneously to its equilibrium value as the exhaust remained subsaturated (RH<100%).
The initial distribution of sulphuric acid hydrates has been calculated following Wilemski and Wyslouzil self consistent assumptions (Wilemski and Wyslouzil, 1995). The
subse-quent growth due to coagulation and condensation (conden-sation has been treated as a special case of coagulation) has led to the formation of stable particles, classified into size-bins according to their acid content. The number of size size-bins used, combined with a small Volume Ratio has been chosen in order to avoid numerical diffusion (Sorokin et al., 2001), a phenomenon well known to occur when using a stationary grid (Jacobson et al., 1994). Particle collision efficiency has been assumed to be size dependent for neutral-neutral parti-cles collisions and fixed to unity for any other collision (Yu, 1998).
In addition to volatile particles, the presence of soot par-ticles in the exhaust has been considered. A log normal dis-tribution has been proposed from measurements results, de-pending on the probe position. The particle emission index (PEI) was typical for common aircraft engines (PEI=1014to 1015soot particles/kg fuel) and the mean size was around 37– 40 nm, for old and modern cruise, respectively (details about the combustor operating conditions can be found in Table 1). The interactions between soot particles and gaseous species (water and sulphuric acid) as well as their interaction with volatile particles have been included in the model.
Another key parameter for volatile particles modelling is the Chemi-Ion (CI) emission index at the combustor exit. An upper (lower) value of the CI emission index of 5.3.1017 (5.3.1016) CI/kg fuel has been proposed by MPI. We mainly used the upper value as a reference one although we have performed a sensitivity analysis of the CI effects on volatile particles growth.
Time (s)
0,001 0,01 0,1 1
Tem
p
era
ture (K)
200 300 400 500 600 700
Pressure (Pa)
1,0e+5 1,1e+5 1,2e+5 1,3e+5 1,4e+5 1,5e+5 1,6e+5 1,7e+5 1,8e+5
Temperature Pressure
Diluter
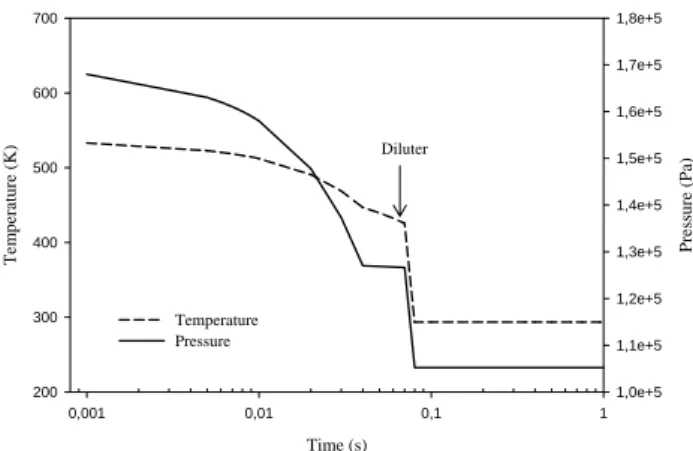
Fig. 1. Temperature (left y axis) and pressure (right y axis)
evolu-tion in the sampling tube for modern cruise condievolu-tions, after extrac-tion of the exhaust gas by the probe, after the combustor exit.
the semi-empirical equation: Nsoot
Nsoot0
=exp
−
1.05×10⁻⁴V +2.27×10⁻⁴ L dV
(1)
whereNsoot0 andNsootare respectively the soot particles num-ber density at the entrance and at the end of the tube,V is the sample mean velocity, L the pipe length and d its diame-ter. Equation (1) has been used for the series of pipes of dif-ferent sections with varying flow rate, which constitute the PartEmis sampling line geometry.
Concerning volatile particles, wall losses have been ne-glected from the tip of the probe to the diluter, as the sample was heated at 423 K to prevent condensation. But after dilu-tion, the estimated material loss due to wall effects, enhanced by the turbulent behaviour of the flow (Reynolds number larger than 30 000), was estimated following the work of Brockmann et al. (1982). The volatile particles number den-sity evolution in the tube was then calculated using the first order equation:
∂N (r, t )
∂t = −
4kT(r, T )
d N (r, t ), (2)
whereN (r, t ) is the number density of volatile particles of radiusr at timet after the diluter,T the temperature of the sample and kT is the mass transfer coefficient determined according to Friedlander (1977) (see for example Brockmann et al., 1982):
kT =0.042Vf1/2Sc−2/3, (3)
whereV is the sample mean velocity, f the friction factor andScthe Schmidt number. The friction factor is given by Bird et al. (1960):
f =0.0791×Re−1/4, (4)
whereReis the Reynolds number, characterizing the flow in the pipe and defined as
Re= V d
ν(T ), (5)
whereν(T )is the viscosity of air (V anddhave been previ-ously defined). Finally the Schmidt number used in Eq. (3) which estimates the ratio between the viscosity of airν(T ) and the particle diffusivityD(r, T )is expressed by
Sc= ν(T )
D(r, T ), (6)
wherer andT have been defined for Eq. (2). Equation (4) finally leads tof≈0.006, a value confirmed by QinetiQ en-gineers (Hurley, personal communication).
4 Results and discussion
4.1 Volatile particles
The knowledge of the temperature profile in the sampling line is needed to calculate the rate of formation of new par-ticles since the temperature controls the evolution of the sat-uration ratio of both condensing species. The temperature at the tip of the probe has been deduced from QinetiQ’s and MPI’s measurements as the pressure drop and the tempera-ture at the sampling location for the chemical ionization mass spectrometry (3 m downstream the probe head) were known. The temperature and pressure at the tip of the probe were approximately of 530 K (600 K) and 168 000 Pa (172 000 Pa) for old (modern) cruise conditions. Figure 1 shows the typi-cal evolution of the temperature and pressure in the sampling line for modern cruise conditions (Hurley, personal commu-nication). This plot shows the decrease of temperature and pressure when dilution occurs. This point is very important as the decrease of the sample temperature triggered off the formation of particles due to the saturation increase of the sulphuric acid-water mixture. The kind of cruise consid-ered (old or modern) has an effect on the temperature and pressure as long as the sample is situated before the diluter. However, in these regions, temperature remains high enough (>400 K) to prevent any formation of particles. Therefore the final number concentrations of volatile particles calcu-lated by varying the profiles before the diluter (but keeping the initial and final temperature constant) are similar.
Figure 2, which shows the evolution of the total number concentration of volatile particles confirms the importance of the diluting point as the particles concentration time evo-lution exhibits a steep increase just after this point (∼0.08 s). As temperature falls down, saturation of condensable species increases and particles form.
Time (s)
0,001 0,01 0,1 1
Ga s sa m p le tem p er atu re ( K ) 250 300 350 400 450 500 550 600 650 4 -7 n m p ar tic les co n ce n tr atio n (/c m 3) 1e-10 1e-8 1e-6 1e-4 1e-2 1e+0 1e+2 1e+4 1e+6 Temperature Concentration Temperature decrease due to dilution
Modeled concentration evolution
Fig. 2. Calculated evolution of volatile particles concentration (right
y axis) and temperature (left y axis) in the sampling line for a given probe position.
colliding on the tube walls. Several values of CE have been used, from 50% to 100% (maximum possible value) as this parameter remains poorly known. Actually, even for two col-liding particles or molecules, theoretical studies as well as experiments have led to quite different values of accommo-dation coefficient (Van Dingenen and Raes, 1991; Clement et al., 1996).
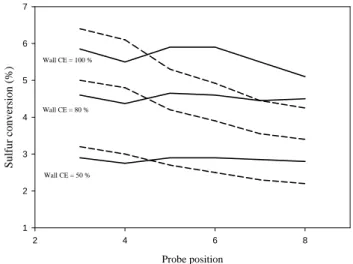
Figure 3 which gives the results of the simulations for high FSC, shows the sulphur conversion factor required for the model to provide a good agreement with measured volatile particles concentration in the size range 4–7 nm. The differ-ent curves correspond to differdiffer-ent values for the assumed CE and sulphur conversion factorsε. For the maximum possi-ble value CE=100%, the sulphur conversion factor reaches a mean value of about 5.2% for old and 5.7% for modern cruise conditions. However, if the CE is reduced to 50% (still a rather high value),εmean values translate to 2.5% and 2.8%, respectively. These last values provide very reasonable agreement both with the measured concentration of volatile particles andεvalues deduced by the MPI group, although most of these results have been determined in the wake, and not at the combustor exit (e.g. Curtius et al., 2002). These re-sults are particularly important as they provide a range of the sulphur conversionεwhose value was still uncertain (Schu-mann et al., 2002). Besides, the range proposed is rather narrow compared to previous studies (e.g. K¨archer and Fa-hey, 1997) as it extends from roughly 2.5% to 6%. Mea-surements of sulphur species during PartEmis have also indi-cated a slight increase ofε, from old to modern cruise (Ka-tragkou et al., 2004). This trend is visible on Fig. 3 but only for the probe positions 5 to 8. Note that results for the first and last positions of the probe, close to the combustor wall have not been presented here, as the air fuel ratio (AFR) in these cases was much higher than the average value (approx-imately twice the average AFR).
Probe position
2 4 6 8
Sulfur conversion (%)
1 2 3 4 5 6 7
Wall CE = 100 %
Wall CE = 50 % Wall CE = 80 %
Fig. 3. Sulphur conversion factorε required to obtain the same
volatile particle concentrations as in DLR measurements, as a func-tion of the probe posifunc-tion. Case of high FSC (1270 ppm). Dashed lines: old cruise. Solid lines: modern cruise. The agreement be-tween observations and calculations is good forε comprised be-tween 2.5% and 6% approximately, whatever the collision effi-ciency CE used.
Time (s)
0,0 0,2 0,4 0,6 0,8 1,0 1,2
4-7 nm part ic le s c oncentrat ion (/c m 3) 1e-20 1e-18 1e-16 1e-14 1e-12 1e-10 1e-8 1e-6 1e-4 1e-2 1e+0 1e+2 1e+4 1e+6
FSC = 50 ppm FSC = 410 ppm FSC = 1270 ppm Exp. point (FSC=1270 ppm) Model result
for a high FSC
DLR experimental point
Fig. 4. Time evolution of 4–7 nm volatile particles concentration
in the sampling line, as a function of the fuel sulfur content FSC. Modern cruise operating conditions. Probe position 5. ε=2.7%, CE=50%. The experimental point is plotted without uncertain-ties. This plot confirms experimental finding that volatile particles were observed only when burning the high FSC fuel. The couple CE=50%−ε=2.7%, matches well the experimental point.
Particle diameter (nm)
0 1 2 3 4 5 6 7
dN/
d
logDp (/
cm
3)
1e-1 1e+0 1e+1 1e+2 1e+3 1e+4 1e+5 1e+6 1e+7 1e+8 1e+9 1e+10 1e+11
EIions=5.3.1013 EIions=5.3.1015 EIions=5.3.1016 EIions=5.3.1017
"ion mode"
Fig. 5. Volatile particles size distribution as a function of the
ini-tial Chemi Ion emission index EIions (in number of chemi ions per kilogram of fuel burnt). Note that the size distribution changes only a little when using EIions=5.3.1017 or 5.3.1016chemi ions per kg of fuel, the upper and lower limits of the range given by MPI.
model results and the experimental result usingε=2.7%. A very important point is that for this sulphur conversion fac-tor, no particles are expected to be seen at the end of the sam-pling line from our model results, when using the low and the medium FSC (50 ppm and 410 ppm, respectively). This is in agreement with observations, as particles were detected only for the high FSC. We have also increased the sulphur con-version factorεup to values larger than 5% and even in that case no volatile particles were formed in the low or medium FSC case. These findings seem to be in contradiction with in-flight measurements, in which volatile particles were ob-served even for FSC lower than 100 ppm (see Schumann et al., 2002). The main reason for these discrepancies lay on the wall losses for gases and particles, as calculated by Eqs. (1– 2).
The sulphur conversionε and the collision efficiency on walls are not the only parameters which have an influence on particles growth. Chemi-ion concentrations, which were measured during PartEmis, may play also a major role. As already noted, we have used an emission index of 5.3.1017/kg at the combustor exit.
Figure 5 depicts the size distribution of particles calculated for ε=2.7% and CE=50%, as a function of different initial amount of CI present in the exhaust (note that the use of ε=5% and CE=100%,would lead to the same result). As it can be seen from these plots, decreasing the CI emission in-dex we used (5.3.1017/kg fuel) by a factor 10 (leading to the lowest value suggested by MPI) has a very limited influence on the final particle concentrations. This mainly indicates that using a different CI emission index in the range pro-posed by MPI should not affect a lot our estimate ofε(for the probe position 5 – old cruise – and CE=50%, to fit mea-surements,εshould be increased from 2.7% to 2.9% to
com-Time (s)
0,0 0,2 0,4 0,6 0,8 1,0 1,2
G
ro
w
th
f
a
c
to
r
0,95 1,00 1,05 1,10 1,15 1,20
D0 = 30 nm D0 = 40 nm D0 = 50 nm
Dilution
Gysel et al. sampling point: increase of relative humidity
to 95% Equilibrium state
for D0= 50 nm
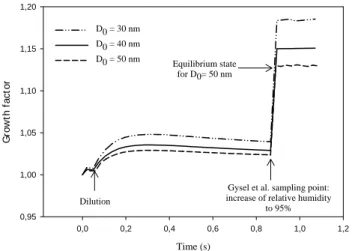
Fig. 6. Soot particles growth factor evolution in the sampling line
and after Gysel et al. (2003) sampling. Note that the growth factor presented here is different from the one presented in Table 2 as it refers to an initial dry diameter at the tip of the probe and not just before the sampling point (att∼0.9 s).
pensate the effect of decreasing the initial amount of chemi ion from 5.3.1017/kg fuel to 5.3.1016/kg fuel).
As already mentioned by Yu and Turco (1997), the size distribution generally exhibits a bimodal structure: a larger ion mode and a smaller neutral mode. The ion mode is partly composed of neutral particles, formed by ion-ion re-combination, and of charged particles, mainly formed by ion-attachment. The bimodal structure results from the presence of both charged and neutral clusters and also from the use of a size dependent accommodation coefficient for neutral-neutral particles collisions. By limiting the efficiency of col-lision between neutral particles for small sizes, the role of ions on particles growth is then enhanced. In our case, the first mode (neutral mode) is not well developed as it is essen-tially composed of particles smaller than 2 nm. Since smaller particles have higher diffusion coefficients, their depletion by wall losses is very efficient. This is why the concentration of small particles is very low, especially when compared to real plumes, even several seconds after emission (e.g. Sorokin et al., 2001). Unfortunately, the curves of Fig. 5 cannot be com-pared with any measurements since the size distribution in the 4–7 nm range was not resolved.
4.2 Hygroscopic properties of soot particles
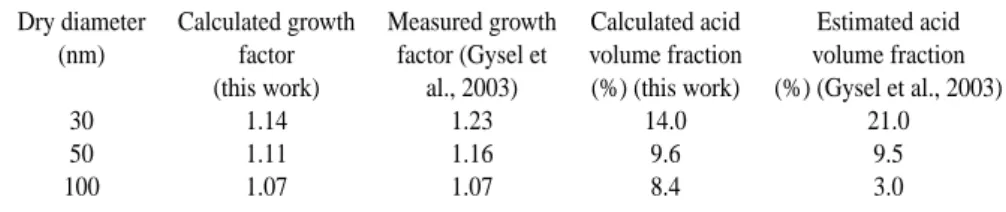
Table 2. Experimental (Gysel et al., 2003) and model results (this work). Comparison of soot particles growth factor and sulphuric acid
volume fraction for modern cruise operating conditions at high FSC (1270 ppm). The growth factor is calculated as the ratio between the particles diameters considered just before they enter the condensation chamber and after they reach equilibrium in it.
Dry diameter Calculated growth Measured growth Calculated acid Estimated acid (nm) factor factor (Gysel et volume fraction volume fraction
(this work) al., 2003) (%) (this work) (%) (Gysel et al., 2003)
30 1.14 1.23 14.0 21.0
50 1.11 1.16 9.6 9.5
100 1.07 1.07 8.4 3.0
end of the sampling line, and then exposed to a rather high relative humidity (up to 95%).
Although soot activation has recently been observed to oc-cur even with sulphur free kerosene (Popovicheva, personal communication), Gysel et al. (2003) have shown a clear de-pendence between the fuel sulphur content and the growth factor defined as the ratio between the wet and the dry (ini-tial) diameter of soot particles, calculated once they have been exposed to high humidity conditions. As volatile and soot particles undergo scavenging processes, soot particles have gained a sulphuric acid-water coating as they have been transported in the sampling line. We have then checked if the model results could match experimental results, concerning both the measured growth factor and the estimated sulphuric acid weight fraction of the layer. On Fig. 6, the time evo-lution of soot particles growth factor has been plotted, as a function of the time spent in the sampling line, until they are exposed to high relative humidity (t >0.9 s).
The growth factor is characterized by a slight increase close to the diluter when the sample is mixed with the di-luting air whose humidity is higher. Then the liquid coat-ing evaporates slightly as both water and sulphuric acid molecules are lost on the walls or are depleted due to nu-cleation and condensation processes. At the end of the sam-pling line, when the sample enters the H-TDMA the sudden increase of relative humidity, up to 95% brings about a sud-den growth of soot particles. As noted by Gysel et al. (2003), the smaller the particles, the larger the growth factors are and no significant difference was detected between old and mod-ern conditions (especially if error bars are included). These observations were confirmed by our modelling study since the calculated growth factors (independent of the flight con-ditions: old or modern cruise) are 1.14, 1.11 and 1.07 re-spectively for particles having initial diameters of 30, 40 and 50 nm before extraction. These values are close to those cal-culated for other probe positions and have been obtained us-ing a wall CE 50% and a sulphur conversion correspondus-ing to the one required to fit volatile particles concentration to the measurements carried out by the Deutsches Zentrum f¨ur Luft- und Raumfahrt (DLR) (ε=2.5–2.8%). Table 2 gives a comparison between calculated and measured growth factors and acid volume fractions of the surface layer, for the high
FSC case (FSC=1270 ppm). One notes a good agreement for the general trends, i.e. increase of both growth factors and acid volume fractions with decreasing size. However, the values may be quite different, especially for the acid volume fraction. Both Table 2 and Fig. 6 confirm that the H2SO4 volume fraction of soot particles is a key point in their hy-groscopic behaviour as the growth factor increases with the amount of sulphuric acid which covers soot particles.
5 Conclusions
Finally, the role of sulphuric acid in soot growth has been confirmed by results from our kinetic model.
The role of sulphuric acid remains very important, al-though the binary system may not be completely able to pre-dict accurately particles concentration, especially in a com-plex system such as a sampling line. Our modelling study did not include the possible contribution of organics on the growth process. However, previous studies have shown that this role appears to be important only for low FSC (of the or-der of 100 ppm or less). Another source of uncertainty is the possible presence of ammonia (which was not monitored) in the diluting air, as ammonia is known to lead to ternary nu-cleation with the sulphuric acid-water mixture. If ammonia was indeed present, nucleation would have been enhanced and the value ofεneeded in the model would have been re-duced. Again, this confirms that theε values given in this work should be considered as upper limits.
Acknowledgements. Support of this work by the European
Com-munity through contract G4RD-CT-2000-00207 (PartEmis) and by the INTAS project OPEN 2000-460, as well as fruitful discussions with the PartEmis participants are gratefully acknowledged.
Edited by: J. Abbatt
References
Arnold, F., Wohlfrom, K. H., Klemm, M. W., Schneider, J., Gollinger, K., Schumann, U., and Busen, R.: First gaseous ion composition measurements in the exhaust plume of a jet aircraft in flight: Implication for gaseous sulfuric acid, aerosols, and chemiions, Geophys. Res. Let., 25, 2137–2140, 1998.
Arnold, F., Kiendler, A., Wiedemer, V., Aberle, S., and Stilp, T.: Chemiion concentration measurements in jet engine exhaust at the ground: Implications for ion chemistry and aerosol formation in the wake of a jet aircraft, Geophys. Res. Let., 27, 1723–1726, 2000.
Bird, R. B., Stewart, W. E., and Lightfoot, E. N.: Transport Phe-nomena, Wiley International Edition, 1960.
Brock, C. A., Schr¨oder, F., K¨archer, B., Petzold, A., Busen, R., and Fiebig, M.: Ultrafine particle size distribution measured in aircraft exhaust plumes, J. Geophys. Res., 105, 26 555–26 567, 2000.
Brockmann, J. E., McMurry, P. H., and Liu, B. Y. H.: On simulta-neous coagulation and diffusional loss of free molecule aerosols in turbulent pipe flow, Aeros. Sci. Tech., 1, 163–178, 1982. Brown, R. C., Miake-Lye, R. C., Anderson, M. R., Kolb, C. E., and
Resch, T. J.: Aerosol dynamics in near-field aircraft plumes, J. Geophys. Res., 101, 22 939–22 954, 1996.
Busen, R. and Schumann, U.: Visible contrail formation from fuels with different sulphur contents, Geophys. Res. Let., 22, 1357– 1360, 1995.
Clement, C. F., Kulmala, M., and Vesala, T.: Theoretical considera-tions on sticking probabilities, J. Aeros. Sci., 27, 869–882, 1996. Curtius, J., Siereau, B., Arnold, F., Baumann, R., Busen, R., Schulte, P., and Schumann, U.: First direct sulfuric acid detec-tion in the exhaust plume of a jet aircraft in flight, Geophys. Res. Let., 25, 923–926, 1998.
Curtius, J., Arnold, F., and Schulte, P.: Sulfuric acid measurements in the exhaust plume of a jet aircraft in flight: Implications for the sulfuric acid formation efficiency, Geophys. Res. Let., 29, doi:10.1029/2001GL013813, 2002.
Fahey, D. W., Keim, E. R., Boering, K. A., Brock, C. A. et al.: Emission measurements of the Concorde supersonic aircraft in the lower stratosphere, Science, 270, 70–74, 1995.
Frenzel, A. and Arnold, F.: Sulphuric acid cluster ion formation by jet engines: Implications for sulphuric acid formation and nucle-ation, In: Proc. Intern. Scientific Coll. On Impact from Aircraft and Spacecraft upon the Atmosphere, K¨oln 1994, DLR-Mitt. 94-06, 106–112, 1994.
Friedlander, S. K.: Smoke, Dust and Haze, Eds Wiley, New York, 1977.
Gysel, M., Nyeki, S., Weingartner, E., Baltensperger, U., Giebl, H., Hintzenberger, R., Petzold, A., and Wilson, C. W.: Properties of jet engine combustor particles during the PartEmis experiment. Hygroscopicity at subsaturated conditions, Geophys. Res. Let., 30, 1566, doi: 10.1029/2003GL016896, 2003.
Heist, R. H. and Reiss, H.: Hydrates in supersaturated binary sulfu-ric acid-water vapor, J. Chem. Phys., 61, 573–581, 1974. Hofmann, D. J. and Rosen, J. M.: Balloon observations of a particle
layer injected by stratospheric aircraft at 23 km, Geophys. Res. Let., 5, 511–514, 1978.
Hurley, C. D.: Measurements of particulates from an engine com-bustor, AEROTRACE proceedings, Impact of Aircraft Emissions upon the Atmosphere, Paris, 1, 113, 1996.
Intergovernmental Panel on Climate Change (IPCC): Aviation and the Global Atmosphere, edited by Penner, J. E., Lister, D. H., Griggs, D. J., Dokken, D. J., and McFarland, M., Cambridge Univ. Press, New York, 1999.
Jacobson, M. Z., Turco, R. P., Jensen, E. J., and Toon, O. B.: Mod-elling coagulation among particles of different composition and size, Atmos. Environ., 28, 1327–1337, 1994.
Jaecker-Voirol, A., Mirabel, P., and Reiss, H.: Hydrates in super-saturated binary sulfuric acid water vapor: a reexamination, J. Chem. Phys., 87, 4849–4852, 1987.
K¨archer, B., and Fahey, D. W.: The role of sulfur emission in volatile particle formation in jet aircraft exhaust plume, Geophys. Res. Let., 24, 389–392, 1997.
K¨archer, B., Yu, F., Schr¨oder, F. P., and Turco, R. P.: Ultrafine aerosol particles in aircraft plumes: Analysis of growth mech-anisms, Geophys. Res. Let., 25, 2793–2796, 1998.
K¨archer, B., Turco R. P., Yu, F., Danilin, M. Y., Weisenstein, D. K., Miake-Lye, R. C., and Busen, R.: A unified model for ultra-fine aircraft particles emissions, J. Geophys. Res., 105, 29 379– 29 386, 2000.
Katragkou, E., Wilhelm, S., Arnold, F., and Wilson, C.: First gaseous Sulfur (VI) measurements in the simulated inter-nal flow of an aircraft gas turbine engine during project PartEmis, Geophys. Res. Lett., Vol. 31, No. 2, L02117, 10.1029/2003GL018231, 2004.
Miake-Lye, R. C., Anderson, B. E., Cofer, W. R., Wallis, H. A., Nowicki, G. D., Ballenthin, J. O., Hunton, D. E., Knighton, W. B., Miller, T. M., Seeley, J. V., and Viggiano, A. A.: SOx
oxi-dation and volatile aerosol in aircraft exhaust plumes depend on fuel sulfur content, Geophys. Res. Let., 25, 1766–1680, 1998. Mirabel, P., and Katz, J. L.: Binary homogeneous nucleation as a
1138–1144, 1974.
Noppel, M., Vehkamaki, H., and Kulmala, M.: An improved model for hydrate formation in sulfuric acid water nucleation, J. Chem. Phys., 116, 218–228, 2002.
Petzold A., Stein , C., Nyeki, S., Gysel, M., Weingartner, E., Bal-tensperger, U., Giebl, H., Hitzenberger, R., D¨opelheuer, A., Vr-choticky, S., Puxbaum, H., Johnson, M., Hurley, C. D., Marsh, R., and Wilson, C. W.: Properties of jet engine combustor parti-cles during the PartEmis experiment, Part I: Microphysics and Chemistry, Geophys. Res. Let., 30, 10.1029/2003GL017283, 2003.
Schr¨oder, F., K¨archer, B., Petzold, A., Baumann, R., Busen, R., Hoell, C., and Schumann, U.: Ultrafine aerosol particles in air-craft plumes: in situ observations, Geophys. Res. Let., 25, 2789– 2792, 1998.
Schumann, U., Str¨om, J., Busen, R., Baumann, K., Gierens, K., Krautstrunk, F., Schr¨oder, F. P., and Stingl, J.: In situ observa-tions of particles in jet aircraft exhausts and contrails for different sulfur containing fuels, J. Geophys. Res., 101, 6853–6869, 1996. Schumann, U., Arnold, F., Busen, R., Curtius, J., K¨archer, B., Kiendler, A., Petzold, A., Schlager, H., Schr¨oder, F., and Wohl-from, K.-H.: Influence of fuel sulfur on the composition of air-craft exhaust plumes: The experiments SULFUR 1–7, J. Geo-phys. Res., 107, 10.1029/2001JD000813, 2002.
Sorokin, A. and Mirabel, P.: Ion recombination in Aircraft Exhaust Plumes, Geophys. Res. Let., 28, 955–958, 2001.
Sorokin, A., Vancassel, X., and Mirabel, P.: On volatile particle formation in aircraft exhaust plumes, Phys. Chem. Earth (C), 26, 557–561, 2001.
Stein, C., Schr¨oder, F., and Petzold, A.: The Condensation Particle Size Analyzer: A new instrument for the measurement of ultra-fine aerosol size distributions, J. Aerosol Sci., 32, S381–S382, 2001.
Taleb, D. E., McGraw, R., and Mirabel, P.: Time lag effects on the binary homogeneous nucleation of aerosols in the wake of an aircraft, J. Geophys. Res., 102, 12 885–12 890, 1997.
Van Dingenen, R. and Raes, F.: Determination of the condensation accommodation coefficient of sulphuric acid on water-sulphuric acid aerosol, Aero. Sci. Tech., 15, 93–106, 1991.
Weingartner, E., Gysel, M., and Baltensperger, U.: Hygroscopicity of aerosol particles at low temperatures 1. New low-temperature H-TDMA instrument: Setup and first applications, Environ. Sci. Technol., 36, 55–62, 2002.
Wilemski, G. and Wyslouzil, B. E.: Binary nucleation kinetics, I. Self consistent size distribution, J. Chem. Phys., 103, 1127– 1136, 1995.
Wilson C. W., Petzold A., Nyeki S., Schumann U., and Zellner R.: Measurement and Prediction of Emissions of Aerosols and Gaseous Precursors from Gas Turbine Engines (PartEmis): An Overview, Aerosp. Sci. Techn., 8, 131–143, 2004.
Yu, F.: A study of the formation and evolution of aerosols and con-trails in aircraft wakes: Development, validation and application of an advanced particle microphysics (APM) model, Ph.D. the-sis, Univ. of Calif., Los Angeles, 1998.
Yu, F. and Turco, R. P.: The role of ions in the formation and evolu-tion of particles in aircraft plumes, Geophys. Res. Let., 24, 1927– 1930, 1997.
Yu, F., Turco, R. P., K¨archer B., and Schr¨oder, F.: On the mecha-nisms controlling the formation and properties of volatile parti-cles in aircraft wakes, Geophys. Res. Lett., 25, 3839–3842, 1998. Yu, F., Turco, R. P., and K¨archer, B.: The possible role of organics in the formation and evolution of ultrafine aircraft particles, J. Geophys. Res., 104, 4079–4087, 1999.