Inluence of Si, Ce, Sb and Sn on
chunky graphite formation
Male, born in 1941, Dr. Eng., Professor. He was a senior researcher in Mechanical Eng. Res. Lab. Hitachi Ltd. from 1971 to 1983, and Director of KAGAMI Memorial Lab. for Materials Sci. and Tech., Waseda Univ. from 2003 to 2006. He has nearly 20 publications. His research interests mainly focus on the interface between solid and liquid and cast iron. He received six Best Paper Awards from Japan Foundry Eng., Soc. and Japan Institute of Metals. He was Past President of Japan Foundry Engineering Society.
E-mail: [email protected]
Received: 2010-07-06; Accepted: 2010-08-20 *Hideo Nakae
*Hideo Nakae1
, Masayuki Fukami2
, Takayuki Kitazawa3
and Ying Zou4
(1. Lab. for Mater. Sci. and Tech., Waseda Univ., Tokyo,Japan; 2. JFE Steel Corp., Japan; 3. Nippon Steel Corp., Japan; 4. Appl. Mech. and Eng., Waseda Univ., Tokyo,Japan)
S
pheroidal graphite (abbreviated SG) cast iron is widely used in industry due to its excellent mechanical properties and good castability. Nevertheless, it is well-known that the graphite morphology changes from SG to chunky graphite (abbreviated CHG) in heavy SG castings [1,2]. The motivationof this study is to elucidate the CHG formation mechanism. There are many reports that have described the alloying elements, such as Si, Ni, Ce and Ca, as the CHG formation elements and Sn, Sb and Te as the preventing elements[1-3].
The Si and Ni are graphitizing elements, the Ca and Ce are the spheroidizing elements and the Sn, Sb and Te are the elements that prevent spheroidizing. It is well known that the Sb and
Te can neutralize the inluence of Ce on the CHG formation.
Tsumura [4] reported the inluence of the Sb addition on the
Ce-treated SG iron. The inluence of Ca was reported by Church [5].
Abstract: The thirteen mother alloys, C%+1/3Si% = 4.45%, differing in their Si, Ce, Sb and Sn contents, were prepared. Seventy grams of these alloys was remelted in a high purity alumina crucible at 1,450ºC under an Ar atmosphere, and then cooled at 30 K/min for obtaining their cooling curves. Their graphite morphologies were observed using an optical microscope and an SEM. Their three-dimensional graphite shapes were observed by the
SEM using the samples whose matrices were etched off with an acid-aqua solution, to conirm the chunky graphite.
For discussing the influence of the Si and Ce contents on the chunky graphite formation, two experiments
were carried out. In the irst one, the Si contents were changed from 0 to 4% in the 0.15%Ce alloys, and for the
second one, the 3.5%Si and 4%Si samples that differed in the Ce contents of 0.1 and 0.2% were used. In the third
experiment, the inluence of Sb and Sn on the chunky graphite formation was investigated by using the 4%Si and
0.1%Ce samples. The results showed that with the increase of the Si content, the volume fraction of the chunky graphite increases, while the volume fraction of the ledeburite decreases, and the chunky graphite volume fraction in the 0.2%Ce samples is higher than that of the 0.1%Ce samples. The effect of the Sb and Sn additions on the
prevention of chunky graphite formation cannot be conirmed due to their high Si contents. Therefore, further studies will be needed in this ield.
Key words: chunky graphite; spheroidal graphite; graphite morphology; solidiication of cast iron
CLC number: TG143.5 Document code: A Article ID: 1672-6421(2011)01-096-05
Nevertheless, nobody has yet explained the formation mechanism of the CHG, therefore, we prepared Fe-C-Si-Ce samples for discussing the CHG formation mechanism using constant cooling rate experiments [3].
1 Experimental procedure
We prepared eight kinds of Fe-C-Si-Ce alloys with different
Si and Ce contents for discussing the inluence of Si and Ce on the CHG formation. Another ive samples, using the 4 mass% (abbreviated %) Si and 0.1%Ce alloys, the Sb-samples and Sn-samples, were prepared in order to study the inluence of Sb
and Sn on the CHG formation. To produce these samples, we
used electrolytic iron, high purity graphite (>99.99%), pure Si (>99.999%), pure Ce (>99.9%), pure Sb (>99.9%) and pure Sn (>99.9%). These alloys were melted using an Al2O3-lined 7 kg
high-frequency induction furnace under lowing Ar. The melts
were cast into ceramic molds that were 15 mm in diameter
and 300 mm in length. The chemical compositions of these
samples are shown in Table 1. Their sulfur contents were less
than 0.005%.
Seventy grams of these samples was remelted in a high
purity aluminum crucible under an Ar atmosphere at 1,450℃
using an electric furnace, as shown in Fig. 1, and the samples
cooling curves were measured by a B-type thermocouple located at the center of the sample in order to discuss the solidification mechanism. All of the graphite morphologies were observed using an optical microscope and a SEM. Their three-dimensional graphite shapes were observed by the SEM using the samples whose matrices were etched off with a hydrochloric aqua solution.
The volume fractions of the CHG portion were measured
using thirty microstructure photos of ifty magniication. The
cooling curves were differentiated to determine the transition points, namely the onset and end points of the SG and CHG formations.
Table 1: Chemical composition of samples (mass%)
Sample No. C Si Ce Sb Sn
0 Si 4.40 <0.005 0.16 -
2 Si 3.79 2.00 0.16 -
3 Si 3.50 3.00 0.17 -
4 Si 3.18 3.98 0.17 -
-3.5Si-0.15Ce 3.49 3.58 0.12 -
-3.5Si-0.25Ce 3.48 3.58 0.21 -
-4Si-0.15Ce 3.31 4.08 0.13 -
-4Si-0.25Ce 3.37 4.10 0.24 - - 4Si-0.1Ce 3.49 3.93 0.09 -
0.02Sb 3.23 4.11 0.08 0.02
0.14Sb 3.24 4.06 0.10 0.14
0.05Sn 3.25 4.19 0.11 - 0.05
0.10Sn 3.26 4.10 0.10 - 0.10
Fig. 1: Schematic of constant cooling rate experiment
2 Results and discussion
2.1 Inluence of Si on CHG formation
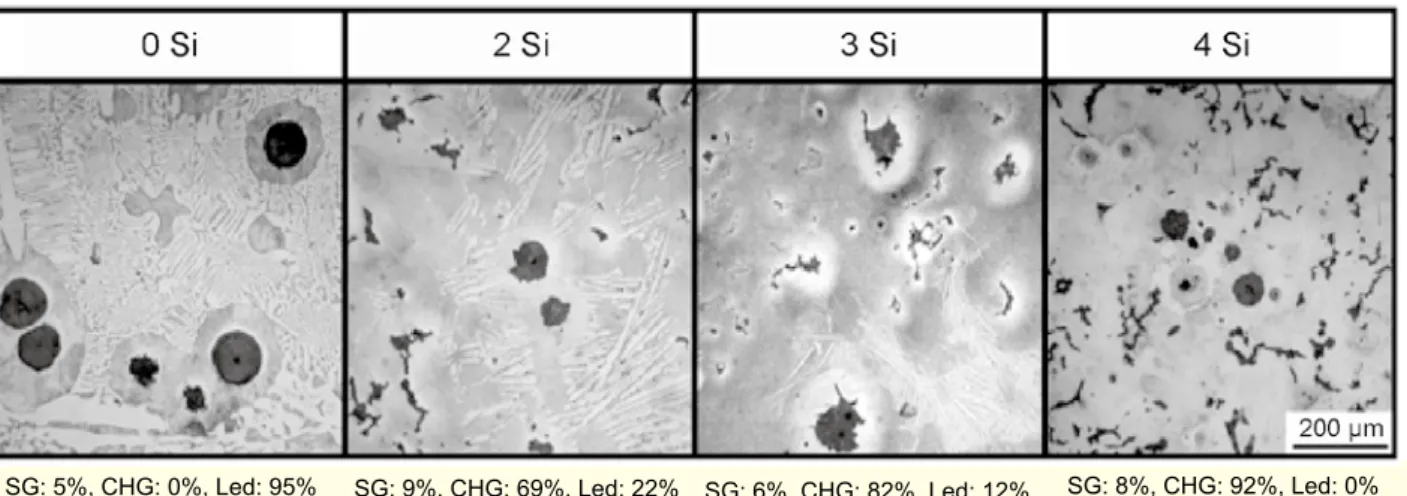
The inluences of the Si contents on the graphite morphology,
observed by an optical microscope and their fractions in each
graphite portion, are shown in Fig. 2. In this igure, SG, CHG
and Led mean the volume fractions of SG portion, CHG portion and ledeburite portion, respectively. There is no CHG
and 95% of the matrix is ledeburite in the 0 Si sample and the volume fraction of CHG in the 4 Si sample is 92%. The
CHG fraction increases with the increasing of the Si contents and that of the ledeburite decreases. Their three-dimensional shapes of the CHG, observed by SEM are shown in Fig. 3. As can be clearly seen, the graphites are highly continued each
other; therefore, we conirmed that they are CHG.
Fig. 2: Inluence of Si on CHG graphite formation
Fig. 3: Three dimensional graphite shapes of 2% to 4%Si samples
2.2 Interaction of Si and Ce on CHG formation
The interaction of Si and Ce for the 3.5%Si and 4%Si is shown
in Fig. 6. As can be clearly seen, the difference in the CHG
fraction is small; nevertheless, in the 0.25%Ce samples the volume fraction is slightly greater than that of the 0.10%Ce
samples. Moreover, a very small amount of ledeburite
formation in the 4%Si-0.25%Ce sample is conirmed by the
optical microscope. The cooling curves of these samples are shown in Fig. 4. The
cooling curves are slightly different from that of the sand mold castings [6]. Namely, the eutectic solidiication temperature of
the SG gradually decreases, but for the sand mold castings, it stays constant as Sertuucha et al.[7] reported. Nevertheless, the
CHG solidification temperature stays nearly constant with a
signiicant recalescence, the same as the solidiication of the
flake graphite. This means that the solidification rate of the CHG iron is much higher than that of the SG iron due to the
difference in the solidiication mode as shown in Fig. 5.
Fig. 4: Inluences of Si contents on cooling curves
Fig. 5: Schematic solidiication models of lake graphite, CHG and SG irons
Fig. 6: Inluence of Si and Ce contents on graphite
morphology
SG is directly crystallized from the melt and covered with
an austenite shell at the onset of the eutectic solidiication [8] as
shown in Fig. 5 [8,9]. Moreover, the thickness of the austenite shell for the SG increases with time up to 1.4 times of the graphite radius, r , for the pure Fe-C alloy. On the other hand, the thickness of the austenite layer at the tip of the CHG stays nearly constant during the eutectic solidification. Therefore,
the solidiication rate of SG is lower than that of the CHG due to the dificulty in carbon diffusion.
If we look at the cooling curves of these samples, shown in
Figs. 7 and 8, the formation of ledeburite in the 4%Si-0.25%Ce sample can be conirmed by the differentiated curve during the inal stage of the solidiication. Moreover, the differentiated values
in the SG formation period are less than zero while that in the CHG formation stage, the value is more than zero. This can be
explained by the solidiication mode of CHG mentioned in Fig. 5.
We show the volume fractions of the SG and CHG,
measured by the optical microscope, and by the solidiication time, in these igures. They are very similar to each other. This means that the solidiication time agrees with the volume of the solidiication due to the constant cooling rate.
Fig. 7: Cooling curve and the differentiated curve of 3.5Si-0.25Ce sample
2.3 Inluence of Sb and Sn on CHG formation
The microstructures of these five samples, the Sb-samples and the 3.5C-4Si samples, are shown in Fig. 9. The Sb and Sn are well known elements that prevent the CHG formation; nevertheless, we cannot confirm the effect based on the
igure and Table 2. The three dimensional shape of the CHG
observed by the SEM shows that these elements affect the
graphite size by making it much iner.
Table 2: Inluence of Sb and Sn addition on CHG formation
Sample No. ΔT (K) CHG (%)
3.5C-4Si 7.6 81
0.02 Sb 16.1 88 0.14 Sb 12.0 91 0.05 Sn 13.9 83 0.10 Sn 13.2 85
Fig. 9: Inluence of Sb and Sn on graphite morphology for 4%Si alloys
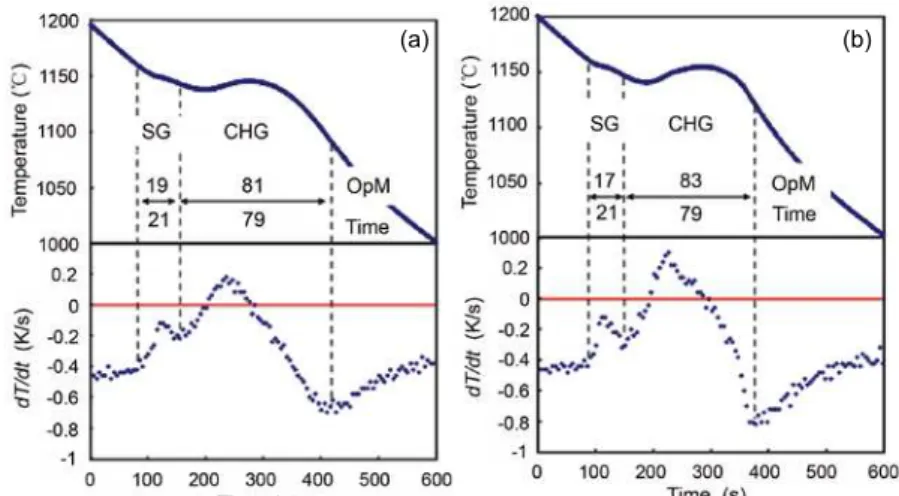
Fig. 10: Cooling curves and CHG and SG fraction of 3.5C-4.0Si (a) and
0.05Sn (b) samples If we look at the cooling curves of these
samples in Fig. 10, their addition produces
not only an increase in the CHG fraction, but
a signiicant recalescence for the formation of
CHG.
The recalescence, ΔT, was measured from the onset of the CHG formation and their maximum eutectic temperature for the morphological transition from SG to CHG. The easiness of solidification is the main reason for the CHG
formation. Nevertheless, the solidiication mode
transfers directly from SG to ledeburite only in the case of the pure Fe-C alloy or low silicon
alloys, as shown in Fig. 2, due to the dificulty
of graphitization. All of these results show that the significant undercooling during the
Fig. 8: Cooling curve and the differentiated curve of 4.0Si-0.25Ce sample
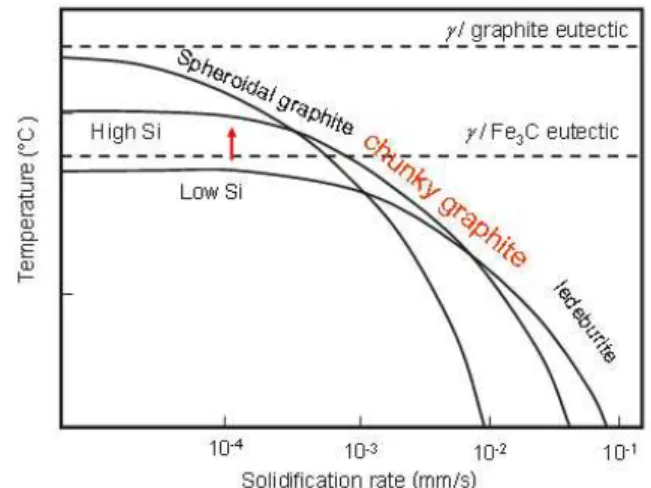
Fig. 11: Graphite morphological transition mechanism of SG to CHG and ledeburite
SG formation, due to the increase in the dificulty of carbon
diffusion, produces the CHG.
We then propose the morphological transition model in Fig. 11 [10] based on the difference in the solidiication mode of SG
and CHG, shown in Fig. 5. Nevertheless, these solidiication
rates are only reference values.
3 Conclusions
We discussed the influence of alloying elements on the
chunky graphite formation in view of the solidiication mode
of the spheroidal graphite cast iron and that of the chunky graphite cast iron. In this study, a number of experiments were conducted for clarifying the chunky graphite formation
mechanism. We can inally conclude that the signiicant under- cooling during the spheroidal graphite eutectic solidiication
produces the morphological transition from SG to CHG
and ledeburite due to the increase in the dificulty of carbon
diffusion. This is the main reason for the CHG formation.
References
[1] Karsay S I. Ductile Iron Production. Quebec Iron and Titanium Corp. , 1966.
[2] Basutkar P K and Loper C R. Predicting graphite nodularity in heavy section ductile iron by thermal analysis. AFS report of research project, 1971: 1-17.
[3] Nakae H, Jung S and Shin H C. Formation mechanism of chunky graphite and its preventive measure. J. Mater. Sci. Tech., 2008, 24: 289-295.
[4] Tsumura O, Ichinomiya Y, Narita H, Miyamoto T and Takenouchi T. Effects of rare earth elements and antimony on morphology of spheroidal graphite in heavy-walled ductile cast iron. Imono, 1995, 67(8): 540-545.
[5] Church N L and Schelleg R D. Detrimental effect of calcium on graphite structure in heavy section ductile iron. Modern Casting, 1970, (1): 5-8.
[6] Bäckerud L, Nilsson K and Steen H. Study of nucleation and growth of graphite in magnesium-treated cast iron. The Metallurgy of Cast Iron, B. Lux, I. Minkoff, F. Mollars (eds.), St. Saphorin (Switzerland): Georgi Pub. Co., 1975: 625-637. [7] Sertucha J, et al. Thermal analysis of the formation of chunky
graphite during solidification of heavy-section spheroidal graphite iron parts. ISIJ International 2009, 49: 220-228. [8] Nakae H and Yamauchi T. Effect of sulphur on growth
morphology of unidirectional solidified Fe-C alloys. J. Inst. Metals, 1994, 58: 30-36.
[9] Tatsuzawa Y, Jung S and Nakae H. Cooling curve and graphite morphology in Ni-C alloys. Intl. J. Cast Metals Research, 2008, 21: 17-22.
[10] Nakae H, Kitazawa T and Fukami M. Inluence of solidiication rate on graphite morphological change in cast iron. In: Proceedings of the 3rd International Conference on Processing Materials for Properties, 2009: 1085-1090.