ISSN 0976-2612, Online ISSN 2278–599X, Vol-7, Special Issue4-May, 2016, pp1-6
http://www.bipublication.com
Research Article
Investigation of the baffle effects on reactor of fluidized beds with circulating
flow along with ozone decomposition
E. Zohrabi1, A.R.Zahedipoor2, Sh.Eslami1, M.Shahamatpoor1 and S.R.Mehrnia3
1
Department of Chemical Engineering,
Mahshahr Branch, Islamic Azad University, Mahshahr, Iran 2Department of Chemical Engineering, Gachsaran Branch,
Islamic Azad University, Gachsaran, Iran
3Department of Geology, Payam Noor University (PNU), Tehran, Iran
ABSTRACT
Fluidized beds with circulating flow, as the gas-solid contactors, are widely used in physical and chemical processes such as drying of solids, pharmaceutical industries, coating solids, granulation, and water and wastewater treatment industry. In this study, numerical simulation using FLUENT software was conducted to investigate the distribution of solid particles of fluidized beds with circulating flow. To conduct simulation, Eulerian-Eulerian with the help of kinetic theory of granular flow was used. Various values of particle-wall elastic modulus were studied. After selecting the appropriate model to predict the particles flow behavior, ozone decomposition reaction was carried out in fluidized beds with circulating flow and they were solved by FLUENT software. The results showed that the location of ring baffles has the greatest impact on fluctuation of system pressure drop, and adverse mix of gas and increase of solid materials are tangible by baffles, resulting from regulation of bed and accumulation of circulating particles beside the wall.
Keywords: fluidized beds with circulating flow, hydrodynamic, kinetic theory of granular flow, chemical reaction.
1. INTRODUCTION
Baffles are vertical blades that are installed in the interior wall of reactor that change the direction fluid turbulence or cease it. Installing baffles increases the disturbance and displacement of fluid inside the riser, and the spiral movement of fluid inside the riser can be observed. The reason that solids fall is gravity baffle not only prevents the movement of particles to downside, but also it increases the the flow of mixed gas. Another task of baffles is bearing the weight of pipes and preventing them from bending when they are expanded and moved. What makes a complete distinction between this type of baffle and Vertical baffles are a complete radial flow. Thus, ozone
so complex and interdependent that their solutions for real fluids were not possible in 1960s and 1970s, even with computer. Jiang et al (1991) method was used to measure the ozone concentration in this study. Both axial and radial ozone concentrations profiles were provided. The baffle effects on reactor performance were examined under the different solid gas velocity and circulating flow velocity [1]. Benjapen et al (2010) examined the non-uniform distribution of solid particles in fluidized beds with circulating in two-dimensional form. They used Eulerian-Eulerian approach in their simulation and solved the ruling equations using FLUENT 6.1 software. The results showed that configuration of baffle ring had significant effect on reactive system [4]. Syamelal et al (1987) investigated the fluidized beds with circulating flow using two-phase fluid model (Euler-Euler) that includes the kinetic theory of granular flows. They also studied the function modeling parameters of drag and solid shear viscosity as well as Granular temperature to
optimize CFD model's predictions. The simulation results showed an important impact of functions of drag and solid shear viscosity on model predictions, particularly indiluted areas [2]. Zhang and Arastou Pour showed that larger particles have a greater tendency to accumulate near the wall than smaller particles. Therefore, the small particles used in modeling can reduce the effect of large particles accumulation near the wall. Solids flux was at its maximum near the center, and the downside flow of solid particles was predicted near the wall [3].
2- Creating geometric shape
For multiphase O'Leary computations, algorithms PCA-SIMPLE software uses [13] pressure-velocity coupling. PC-SIMPLE is expansion or developed SIMPLE [12] for multiphase flows. Velocities are coupled in the phases and solved, separately. Multi-mesh plan is used based on density 2 [6], to solve the vector equation resulting from velocity components of all phases simultaneously.
3. Ruling equations
Continuity equation : Gas phase
Solid phase
Momentum equations : Gas phase:
Solid phase
Continuity equation : The volume fraction of each phase is calculated using continuity equation:
Momentum exchange coefficient (the drag model) presented by Siamelal et al [7] is as follows: Drag model equations:
This model is based on the measurement of particles in the fluidized beds or sedimentation stated as a function of volume fraction and Reynolds number:
Fluid-solid exchange coefficient is as follows:
is the limit velocity equation for solid phase
With A=
And B=0.8
And B=
Radial distribution function : It uses the following equation for one solid phase [8]:
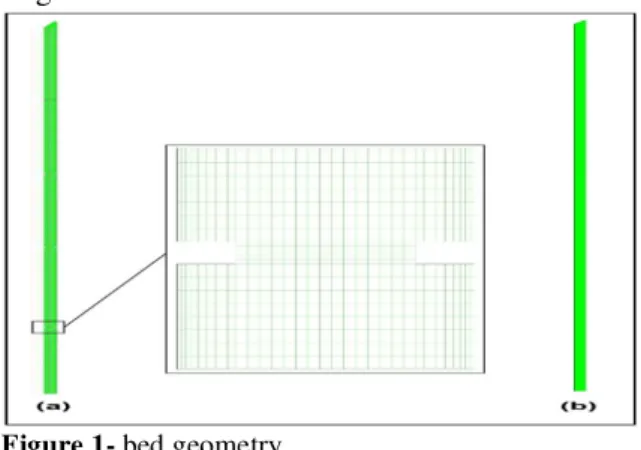
The first step in the simulation is making the geometry of the system and its mesh. We used Gambit software to draw geometry shape of the bed. Bed height was 6.1 m and its width was 0.076 m, that there is 46 mm of gap for entrance of gas end down of bed.
Figure 1- bed geometry
4 Validation of the results of system without baffle In this section, the aims to ensure the accuracy of the results obtained by simulation of system without baffle. For this purpose, the results of
Figure 2- comparison of the average time of particles volume fraction resulting from simulation with experimental results at a height of 3.8 m from the bed
Figure 3- comparison of the average time of particles velocity resulting from simulation with experimental results at a height of 3.8 m from the bed
5. The volume fraction of particles in baffled and non-baffled systems
In the baffled system, the volume fraction of particles has high concentration in the side of wall than its center in the entrance area. As we move from entrance area to upper side to reach the first baffle, it is seen that the behavior of particles is relatively uniform, but as we move from bottom to upper part, its concentration decreases slightly. The volume fraction of
particles in the side of wall, after passing through the baffle is severely reduced, since the baffle acts as a barrier for movement of particles in the side of wall.
Based on the Figure, volume fraction of particles in the next baffles decreases compared with previous baffle in the side of wall, which leads to more uniform distribution of volume fraction of particles. According to the Figure, the contour of the particles volume fraction in non- baffle system show that accumulation of particles is very high in the side of wall, but it suddenly decreases. In general, by comparing two systems, one can understand the behavior of particles in non-baffled system is relatively uniform, but in the baffled areas there is the highest non-uniformity of volume fraction of particles due to contact of particles with baffle, leading to irregularity in that area.
Figure 4-Contour of solid volume fraction (Figure a is baffled riser and (a-1) is the entrance section of rise and (a-2) is outlet section of riser and figure b is non-baffled riser and (b-1) is the entrance section of riser and (b-2) is the outlet section of the riser
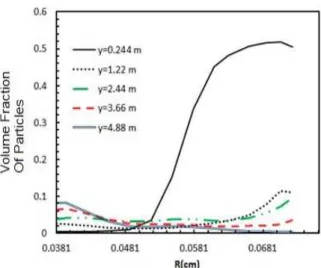
Figure 5- The average time of volume fraction of particles at different heights in baffled system
Figure 6- The average time of volume fraction of particles at different heights in non-baffled system However, according to Figure 6, in the non-baffled, the particle volume fraction in the side of wall is higher than its center in all selected heights, and as height increases this behavior does not change.
6. Mole fraction of ozone
Figure shows five sections of the riser that indicate the motion of particles in the walls and the center. In its center, there is the maximum mole fraction of ozone that is particles mole fraction of ozone is very lower in the walls than center of bed, and particles mole fraction of ozone is constantly ascending. Therefore, the baffled system is better than non-baffles system
since baffle prevents particles backing to the bottom of the riser.
Figure 7- Comparison of the contour of the ozone mole fraction of baffled system ((a) the entrance section of riser (b) and the first baffle and (c) the second baffle and (d) the third baffle and (e) the outlet section of riser
Figure 8- The radial distribution of baffled ozone concentration in a pivotal position before baffle (1.075), after (1.088) baffle, and middle of baffle (1.097)
irregularity due to reduction in the area of entrance. Before entering to the baffle, particles have evenly distribution of ozone concentration (in radial direction) and after the baffle, this evenly distribution is disrupted. However, the motion of particles is fully upward.
7. List of symbols and abbreviations
Symbol
Coefficient of drag
Diameter [m]
particle-particle modulus [-]
particle-wall modulus [-]
Acceleration of gravity [m / s2] g
Radial distribution function [-]
Pressure tensor [Pa]
Penetration coefficient of granular
temperature [kg / m s]
Gas-solid momentum exchange
coefficient [kg / m3 s]
Pressure [Pa] P
Solid pressure [Pa] Ps
Time [s] t
Superficial gas velocity [m / s] U
Temperature [K] T
Coefficient of drag
Diameter of particles [m]
8. REFERENCE
1. Jiang, p, Bi, Jean, R, Fan, L, 1991. Baffle effects on performance of catalytic circulating fluidized bed reactor. A. I. ch. E. Journal 37, 1392-1400.
2. M. Syamlal, T. O, Brien, Derivation of a drag coefficient from velocity– voidage correlation, U.S. Dept. of Energy, Office of Fossil Energy, National Energy Technology Laboratory, Morgantown, West Virginia, April, 1987. 3. Y. Zheng, X. Wan, Z. Qian, F. Wei, Y. Jin,
Numerical simulation of the gas–particle turbulent flow in risers reactor based on k–ɛ–
kp–ɛ p–Θ twofluid model, Chem. Eng. Sci. 56
(2001) 6813–6822.
4. B.Chalermsinsuwan, P.Kuchonthara and P.piumsomboon, chem. Eng. Process 49 (2010)1144-1160.
5. A. Neri, D. Gidaspow, Riser hydrodynamics: simulation using kinetic theory, AIChE J. 46 (2000) 52–67.
6. S. V. Patankar. (1980), “Numerical Heat
Transfer and Fluid Flow”, Hemisphere,
Washington, DC.
7. M. Syamlal, T. O, Brien, Derivation of a drag coefficient from velocity– voidage correlation, U.S. Dept. of Energy, Office of Fossil Energy, National Energy Technology Laboratory, Morgantown, West Virginia, April, 1987. 8. S. Ogawa, A. Umemura, and N. Oshima.
(1980), “ On the Equation of Fully Fluidized Granular Materials”. J. Appl. Math. Phys., 31:483.
9. Liu, J., Particle and gas dynamics of high density circulating fluidized beds, PhD Thesis 2001, The University of British Columbia. 10.J. Liu, J.R. Grace, H.T. Bi, Radial distribution
of local particle velocity in a high density circulating fluidized bed riser, 7th Circulating fluidized bed, CSChE national conference, 2002, Ottawa.
11. J. Liu, J. Grace, X. Bi, Novel multifunctional optical-fiber probe: II. high density CFB measurements, AICHE J. 49 (2003) 1421– 1432.
12.D. J. Gunn. (1978), “Transfer of Heat or Mass to Particles in Fixed and Fluidized Beds”,Int.
J. Heat Mass Transfer, 21:467-476.
13.S. A. Vasquez and V. A. Ivanov. (2000), “A Phase Coupled Method for Solving Multiphase Problems on Unstructured Meshes”, In
Proceedings of ASME FEDSM'00: ASME 2000 Fluids Engineering Division Summer