Experimental investigation of Dry Electrical
Discharge Machining on SS 316L
Rony Thomas Murickan
School of Mechanical and Building Sciences VIT University, Vellore, Tamilnadu, India
Lakshmi Pathi Jakkamputi School of Mechanical and Building Sciences
VIT University, Vellore, Tamilnadu, India
P. Kuppan
School of Mechanical and Building Sciences VIT University, Vellore, Tamilnadu, India
Abstract-Dry EDM is an environmental friendly machining process were liquid dielectric is replaced by gaseous dielectrics. This paper deals with the experimental investigation on stainless steel 316L grade by Dry EDM process using compressed air as the dielectric and a special copper electrode as the tool for blind hole EDM drilling process. The influence of discharge current, pulse-on time, duty factor and spindle speed on material removal rate (MRR) and tool wear rate (TWR) has been studied. Empirical models for MRR and TWR, has been developed using Response surface methodology (RSM) conducting designed experiment based on the Central Composite Design (CCD). From the results it is observed that a maximum MRR of 9.94 mm3/min is obtained and MRR is influenced by discharge current followed by Ton and duty factor. A minimum tool wear of 0.048 mm3/min is obtained and tool wear is influenced by discharge current and duty factor.
Keywords: Dry EDM, CCD, RSM, SS 316L
I. INTRODUCTION
Electrical discharge machining is an advanced machining process under the category of nontraditional machining process. Main area of application is tool and die making industry because of its ability to machine the difficult to cut materials and also due to its high precision. Mineral oil based liquid dielectrics in conventional EDM is replaced by gaseous fluids at high pressure due to the generation of toxic smoke and fumes due to the thermal decomposition of the dielectrics[1]. This method of EDM was proposed by researchers of NASA in 1985. They used Argon and He gases and they observed that compared to liquid EDM, MRR is less [12]. Thus researchers proposed this new method of Dry EDM as a new alternative to the onventional liquid EDM process. Lower tool wear, lower residual thermal stresses, no toxic fume, less white layer and higher precision are the main advantage of this process [5-8]. Improved EDM efficiency was observed when kunieda supplied oxygen gas into the discharge gap and he also found that MRR is high compared to conventional EDM [6]. Dry EDM with slotted electrodes was done by Govindan and Joshi and they found that slots in the periphery of electrode helps in effective debris removal and the flow of dielectric is more due to more space and hence improves the MRR [13]. It was observed from literatures of govindhan and joshi that dry EDMed surface also has surface drawbacks such as micro cracks due to thermal stress, the deposition of spherical particles and marks due to the gas entrapment in the machined surface [14]. Better process capabilities at special machining conditions has been observed by gaseous dielectrics further researches has to be carried out in this area. Experimental works in dry EDM is not so available and publications are very little available in this area.
This paper focuses mainly on Dry Electrical discharge machining of SS 316 L material using compressed air as the dielectric. Machining is done with a special three hole tubular copper electrode. . Design of experiments is done using central composite design (CCD) along with Response surface methodology (RSM) to develop the empirical models for MRR and TWR.
A. EXPERIMENTAL SETUP
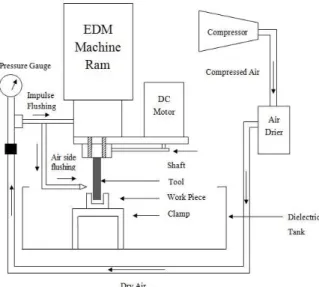
Experiments were performed on a PSR 35 model ram EDM machine manufactured by Electronica Industries, India. A servo controller controls the Z- axis and electrode is fed down towards the workpiece and the X and the Y-axis are controlled manually. A special machining unit known as dry EDM attachment is designed and developed for conducting the dry EDM process. The unit is attached to the existing oil EDM machine and the unit consists of a spindle, speed control unit and a timer belt drive mechanism. Basic purpose of the unit is to rotate the tubular electrode and to allow the high pressure gas dielectric to flow through the tubular electrode. Compressed air from an external air compressor is supplied to the dry EDM attachment. The tubular electrode mounted in the dry EDM attachment spindle receives the compressed air. A drying unit attached to the compressor line removes the moisture content in the compressed air. A pressure gauge and pressure valve are also fitted in the dielectric line to know the pressure and to control the pressure. The schematic diagram of experimental set-up is shown in the fig. 1.
Figure 1. Schematic diagram of Dry EDM setup
B. WORKPIECE, TOOL AND DIELECTRIC
Drilling of blind holes were conducted on SS 316L material with a density of 8000kg/m3. Table 1 shows the chemical composition of SS 316L. Three non central holes of 2mm diameter uniformly distributed are drilled into a solid copper electrode of 10 mm from one end. These holes open into a large central hole of 7mm diameter, which is drilled into the electrode from other end. The electrode tool is 99.9% pure electrolytic copper. Compressed air is used as the dielectric medium. Tool is shown in the figure 2.
C. EXPERIMENTAL PROCEDURE
Figure 2. Design of special Copper tool electrode
Calculation of material removal rate and tool wear rate was done by measuring the weight loss of the workpiece. Volumetric values of workpiece and tool are converted by dividing with the density of work piece and tool. The tool and workpiece are connected to positive and negative terminals of power supply respectively. Impulse flushing of dielectric gas at a pressure of 1.5 kgf/cm2 is done through the electrode and air side flushing is also provided to remove debris and for better flushing. Each drilling operation was conducted for 10 minutes. After each experiment workpiece was removed and cleaned with acetone and weighed.
D. PLAN OF EXPERIMENTS
Experiments were designed by central composite design (CCD). Process parameters like discharge current (I), pulse-on time (Ton), duty factor (η) and spindle speed (N) were chosen as controllable parameters for
experimentation. Dielectric pressure was kept constant (1.5 kgf/cm2), Anti- arc sensitivity and ram sensitivity were kept constant during machining. The values of various parameters on various levels are shown in the Table 2. This design consists of 31 experiments with 16 factorial points, 8 axial points with α= , 7 center points for replication. The experimental data obtained in the range of parameters from the CCD runs are shown in table 2.
Table 2:Range of parameter values in CCD
Level I(A) Ton (µs) η (%) N (rpm)
-2 4 50 60 300
-1 8 150 65 400
0 12 250 70 500
+1 16 350 75 600
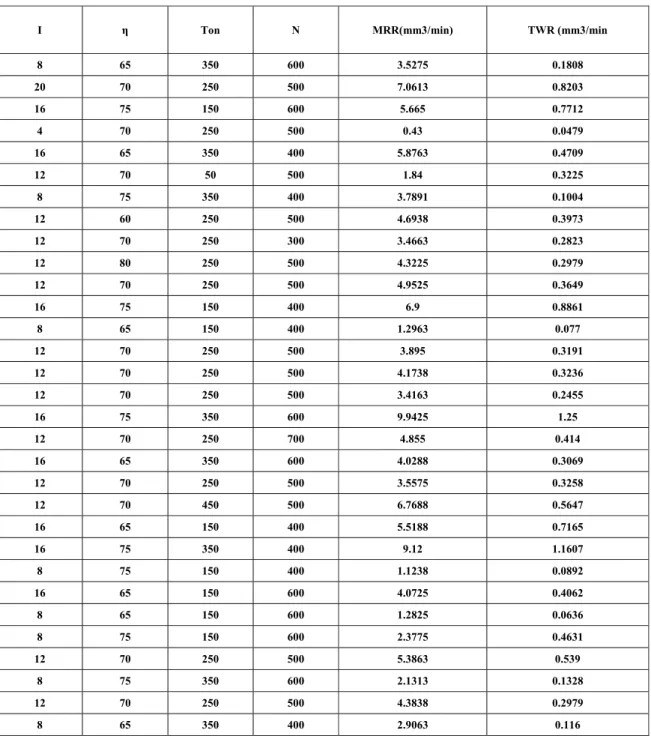
Table 2. Experimental parameters and results
I η Ton N MRR(mm3/min) TWR (mm3/min
8 65 350 600 3.5275 0.1808
20 70 250 500 7.0613 0.8203
16 75 150 600 5.665 0.7712
4 70 250 500 0.43 0.0479
16 65 350 400 5.8763 0.4709
12 70 50 500 1.84 0.3225
8 75 350 400 3.7891 0.1004
12 60 250 500 4.6938 0.3973
12 70 250 300 3.4663 0.2823
12 80 250 500 4.3225 0.2979
12 70 250 500 4.9525 0.3649
16 75 150 400 6.9 0.8861
8 65 150 400 1.2963 0.077
12 70 250 500 3.895 0.3191
12 70 250 500 4.1738 0.3236
12 70 250 500 3.4163 0.2455
16 75 350 600 9.9425 1.25
12 70 250 700 4.855 0.414
16 65 350 600 4.0288 0.3069
12 70 250 500 3.5575 0.3258
12 70 450 500 6.7688 0.5647
16 65 150 400 5.5188 0.7165
16 75 350 400 9.12 1.1607
8 75 150 400 1.1238 0.0892
16 65 150 600 4.0725 0.4062
8 65 150 600 1.2825 0.0636
8 75 150 600 2.3775 0.4631
12 70 250 500 5.3863 0.539
8 75 350 600 2.1313 0.1328
12 70 250 500 4.3838 0.2979
III. MATHEMATICAL MODELING:
A. REGRESSION ANALYSIS:
MINITAB computer software is used for developing mathematical models based on response surface methodology utilizing the responses obtained from the experimentation designed using central composite design. Fitted models obtained for MRR and TWR. Regression statistics values are compared and suitable model is selected. All terms in the fitted model might not have significant effects. Insignificant terms can be removed to get more fitting.
B. REGRESSION ANALYSIS FOR MRR:
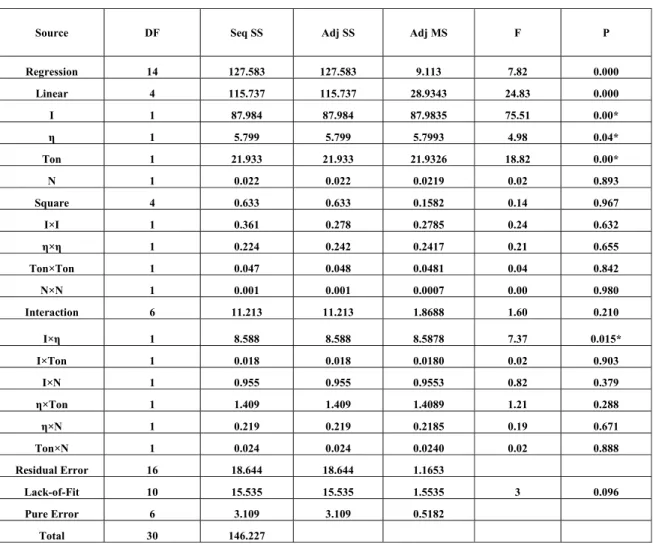
I, η and interaction terms such as I×ηhave significant effects in the MRR model since the P-values are less than 0.05. The regression equation for calculating MRR is
The values of R2 and R2(adj) for MRR model is 87.25% and 76.09% respectively. The F- value for the MRR model is 7.82. The lack of fit P-value calculated for MRR is 0.096, and thus lack of fit is insignificant as desired.
Table 2: ANOVA table for MRR
Source DF Seq SS Adj SS Adj MS F P
Regression 14 127.583 127.583 9.113 7.82 0.000
Linear 4 115.737 115.737 28.9343 24.83 0.000
I 1 87.984 87.984 87.9835 75.51 0.00*
η 1 5.799 5.799 5.7993 4.98 0.04*
Ton 1 21.933 21.933 21.9326 18.82 0.00*
N 1 0.022 0.022 0.0219 0.02 0.893
Square 4 0.633 0.633 0.1582 0.14 0.967
I×I 1 0.361 0.278 0.2785 0.24 0.632
η×η 1 0.224 0.242 0.2417 0.21 0.655
Ton×Ton 1 0.047 0.048 0.0481 0.04 0.842
N×N 1 0.001 0.001 0.0007 0.00 0.980
Interaction 6 11.213 11.213 1.8688 1.60 0.210
I×η 1 8.588 8.588 8.5878 7.37 0.015*
I×Ton 1 0.018 0.018 0.0180 0.02 0.903
I×N 1 0.955 0.955 0.9553 0.82 0.379
η×Ton 1 1.409 1.409 1.4089 1.21 0.288
η×N 1 0.219 0.219 0.2185 0.19 0.671
Ton×N 1 0.024 0.024 0.0240 0.02 0.888
Residual Error 16 18.644 18.644 1.1653
Lack-of-Fit 10 15.535 15.535 1.5535 3 0.096
Pure Error 6 3.109 3.109 0.5182
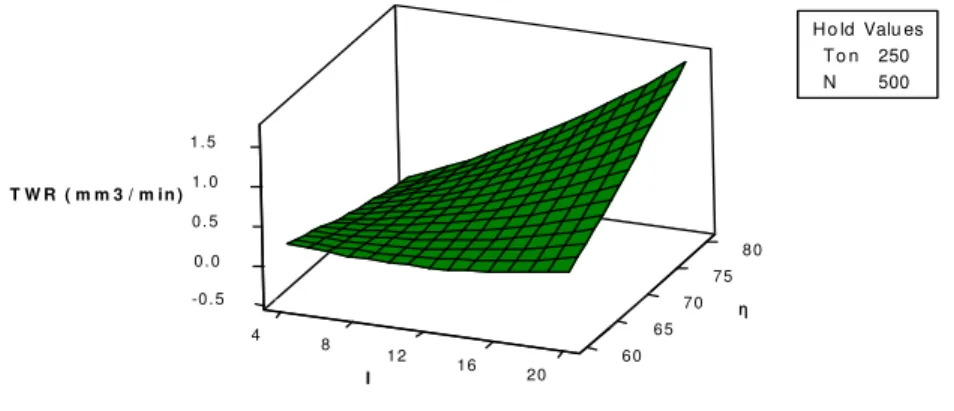
C. REGRESSION ANALYSIS FOR TWR:
I, V, Ton, η and higher order effects of I and interaction terms such as I×V, I×Ton have significant effects in the
TWR model since the P-values are less than 0.05. The regression equation for calculating TWR is
The values of R2 and R2(adj) for TWR models is 81.54% and 65.39% respectively. The F- value for the TWR
model is 5.05. The lack of fit P-value calculated for TWR is 0.025 and thus lack of fit is significant thus some parameters which are relevant is not selected.
.
Table 2: Anova table for TWR
Source DF Seq SS Adj SS Adj MS F P
Regression 14 2.3027 2.3027 0.16448 5.05 0.001
Linear 4 1.89661 1.89661 0.47415 14.55 0.000
I 1 1.64871 1.64871 1.64871 50.6 0.000*
η 1 0.22365 0.22365 0.22365 6.86 0.019*
Ton 1 0.0222 0.0222 0.0222 0.68 0.421
N 1 0.00204 0.00204 0.00204 0.06 0.806
Square 4 0.0564 0.0564 0.0141 0.43 0.783
I×I 1 0.02122 0.02855 0.02855 0.88 0.363
η×η 1 0.00096 0.00284 0.00284 0.09 0.771
Ton×Ton 1 0.0313 0.033 0.033 1.01 0.329
N×N 1 0.00292 0.00292 0.00292 0.09 0.768
Interaction 6 0.3497 0.3497 0.05828 1.79 0.165
I×η 1 0.20689 0.20689 0.20689 6.35 0.023*
I×Ton 1 0.02041 0.02041 0.02041 0.63 0.44
I×N 1 0.05731 0.05731 0.05731 1.76 0.203
η×Ton 1 0.02426 0.02426 0.02426 0.74 0.401
η×N 1 0.04036 0.04036 0.04036 1.24 0.282
Ton×N 1 0.00048 0.00048 0.00048 0.01 0.905
Residual Error 16 0.52131 0.52131 0.03258
Lack-of-Fit 10 0.46966 0.46966 0.04697 5.46 0.025
Pure Error 6 0.05165 0.05165 0.00861
IV. RESPONSE SURFACE ANALYSIS
A. MRR response surface
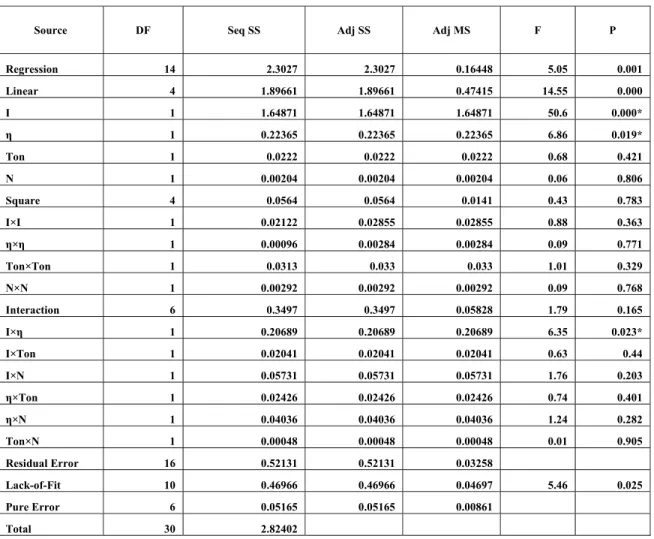
The response surface of MRR versus peak current and duty factor is shown in figure 4. From figure it is observed that current has significant effect on MRR when duty factor increases. At high currents MRR increase when duty factor increases. Possible reason for this is at high duty factor Ton increases which leads to more sparking and at high currents depth of crater formation is more and this leads to high MRR. At low duty factor and low currents MRR is less, do to less number of frequency of sparks. At low duty factor when current increases there is a slight increase in the MRR but at high duty factor MRR increases steeply this is due to the more frequency of sparks and less arcing due to more flushing at high duty factor.
80
75 0
70 3
6 9
4 65
12
8
12 60
16 20 M RR( m m 3 / m in)
η
I
Ton 250
N 500
Ho ld Valu es
Surface Plot of MRR( mm3 / min) vs η, I
Figure 4. Response surface of MRR versus peak current and duty factor
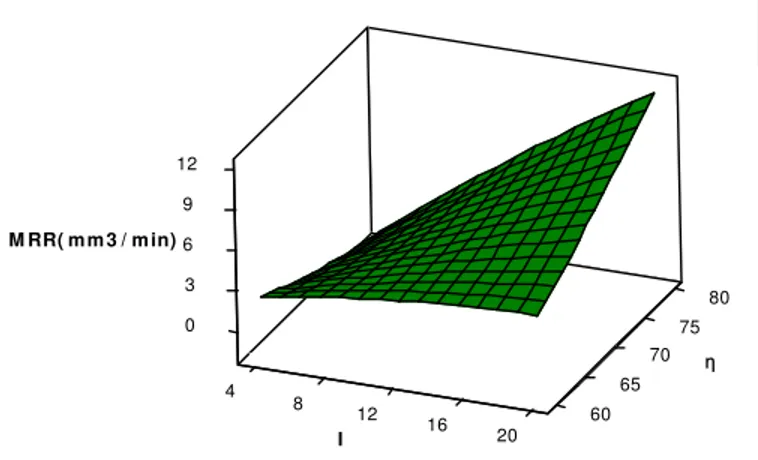
B. TWR response surface
8 0 7 5 -0 . 5
0 . 0
7 0 0 . 5
1 . 0
4 1 . 5
6 5 8
1 2 6 0
1 6 2 0
T W R ( m m 3 / m i n )
η
I
T o n 250
N 500
H o ld Valu es
Sur f a ce Pl ot of TW R ( mm3 / mi n) v s η, I
Figure 5. Response surface of TWR versus peak current and duty factor
V. CONCLUSION:
In this work experiments designed on central composite design (CCD) were conducted to develop empirical models for MRR and TWR using Response surface methodology. Following conclusions are derived based on results. A maximum MRR of 9.94 mm3/min is obtained and MRR is influenced by discharge current followed
by Ton and duty factor. The interaction effect of duty factor and discharge current is also significant and a minimum tool wear of 0.048 mm3/min is obtained and tool wear is influenced by discharge current and duty factor. The interaction effect of duty factor and discharge current is also significant.
REFERENCES
[1] Leao FN, Pashby IR A review on the use of environmentally friendly dielectric fluids in electrical discharge machining. Journal of Material Processing Technology;149(1-3):341–6. 2004
[2] S. Evertz, A. Eisentraeger, W. Dotti, F. Klocke, A. Karden, G. Antonoglou, Environmental and industrial hygiene in connection with electrical discharge machining at high discharge energies, in Proceedings of the 13th International Symposium on Electromachining (ISEM XIII), vol. I, pp. 193–210, 2001.
[3] B. Bommeli, Study of the harmful emanations resulting from the machining by electro-erosion, in: Proceedings of the Seventh International Symposium on Electromachining (ISEM VII), pp. 469– 478, 1983
[4] Grzegorz Skrabalak, Jerzy Kozak, Proceedings of the World Congress on Engineering 2010 Vol III WCE 2010, June 30 - July 2, London, U.K. (2010).
[5] Kunieda, M., Yoshida, M., Taniguchi, N, “Electrical discharge machining in gas”, CIRP Annals-Manufacturing Technology 46, 143-146. (1997)
[6] Kunieda M, Furuoya S, Taniguchi N. Improvement of EDM Efficiency by Supplying Oxygen Gas into Gap. CIRP Annals – Manufacturing Technology 40(1):215–218. (1991).
[7] Kunieda, M., Furudate, C., “High precision finish cutting by dry WEDM”, CIRP Annals - Manufacturing Technology 50 (1) ,121-124. (2001)
[8] Kunieda, M., Miyoshi, Y., Takaya, T., Nakajima, N., Bo, Y.Z., Yoshida, M., “High speed 3D milling by dry EDM”, CIRP Annals-Manufacturing Technology 52 (2003), 147-150.
[9] De Bruyn HN Slope Control: a great improvement in spark erosion. Annals of the CIRP 16:183–191, (1968)
[10] Rieder WF Low current arc modes of short length and time:a review. IEEE Trans Compon Packag Tech 23:286–292, (2000). [11] 11.Frohn-Villeneuve L, Curodeau A, Gagnon P, Laterreur V, Billette G, Coté J-F, Beaudoin L-P, Gagné D, Brault L Investigation of
dry electric discharge polishing. In: Proceedings of ISEM XV, Pittsburgh, USA, pp. 269–274. (2007)
[12] Ramani, V., Cassidenti, M. L., Inert-Gas Electrical Discharge Machining NASA, National Technology Transfer Center (NTTC), Wheeling, WV. (1985).
[13] Govindan, Puthumana and Suhas S. Joshi, Investigations into Performance of Dry EDM Using Slotted Electrodes. International journal of precision engineering and manufacturing vol. 12, no. 6, pp. 957-963 (2011)
[14] Govindan Puthumana and Suhas S. Joshi, Experimental characterization of material removal in dry electrical discharge drilling, International Journal of Machine Tools & Manufacture 50 431–443, (2010).