Article
J. Braz. Chem. Soc., Vol. 24, No. 3, 397-405, 2013. Printed in Brazil - ©2013 Sociedade Brasileira de Química 0103 - 5053 $6.00+0.00
A
*e-mail: [email protected]
Influence of Ethanol, Acidity and Chloride Concentration on the Corrosion
Resistance of AISI 316L Stainless Steel
Elivelton A. Ferreira,a,b Rodrigo Della Noce,b Cecílio S. Fugivarab and
Assis V. Benedetti*,b
aInstituto de Ciências Exatas, Universidade Federal de Alfenas, 37130-000 Alfenas-MG, Brazil
bDepartamento de Físico-Química, Instituto de Química, Universidade Estadual Paulista (UNESP),
14801-970 Araraquara-SP, Brazil
A influência do etanol, ácido sulfúrico e cloreto na resistência à corrosão do aço 316L foi investigada por meio de curvas de polarização e medidas de espectroscopia de impedância eletroquímica. No intervalo estudado, o potencial de corrosão do aço foi independente das concentrações de H2SO4 e NaCl em solução aquosa. Por outro lado, em solução contendo 65% (m/m)
de etanol e 35% (m/m) de água, os potencias de corrosão foram mais altos do que os observados em solução aquosa. Além disso, o potencial de corrosão do aço foi alterado pela adição de H2SO4
e NaCl em solução. Em soluções com e sem etanol, mais 0,35% (m/m) de NaCl, a presença de 1% (m/m) de H2SO4 inibiu o aparecimento de corrosão puntiforme.
The influence of ethanol, sulfuric acid and chloride on the corrosion resistance of 316L stainless steel was investigated by means of polarization curves and electrochemical impedance spectroscopy measurements. Over the studied range, the steel corrosion potential was independent of H2SO4 and NaCl concentrations in aqueous solution. On the other hand, in solution containing
65 wt.% ethanol and 35 wt.% water, the corrosion potentials were higher than those obtained in aqueous solution. Besides, the steel corrosion potential was affected by the addition of H2SO4 and
NaCl in solution. In solutions with and without ethanol, plus 0.35 wt.% NaCl, the presence of 1 wt.% H2SO4 inhibited the appearance of pitting corrosion.
Keywords: 316L stainless steel, electrochemical impedance spectroscopy, corrosion resistance, polarization curves
Introduction
Austenitic stainless steels were developed for use under both mild and severe corrosive conditions. Their high corrosion resistance is primarily due to the oxide layer formed on the surface, determined by the alloy composition and the environmental conditions in which the stainless steels (SS) are exposed to.1-4
Stainless steels, such as types 304 (UNS S30400) and 316 (UNS S31600), contain a variety of inclusions in the form of oxides, silicates, aluminates and sulfides. These are often present as mixed species, in which the sulfides form shells around the oxides, silicates and aluminates. The manganese sulfide shell represents a particularly favorable site for pit initiation. The dissolving shells are thought to
generate crevices between the insoluble oxide-silicate-aluminate cores and the stainless steel matrix, leading to appropriate conditions for the pitting propagation process.5-7
If corrosion potential (Ecorr) is close to pitting potential (Ep), any small change in the oxidizing power of the solution, such as the introduction of traces of oxidizers, can produce pitting by reducing the separation between
Ecorr and Ep. Alloy-environment combinations that are unlikely to cause pitting will have Ecorr significantly active to Ep. The value of Ecorr of stainless steels in oxygenated chloride solution may not change considerably from alloy to alloy. The difference between Ep or transpassivation potential, Et and repassivation potential, ER (the potential in which the film is repaired after damage) may be considered to be an indication of susceptibility to pitting corrosion of metallic materials. However, according to Sedriks,7 it has
the absolute value of Ep rather than Ep−Ecorr. Thus, it is generally accepted that the more noble the Ep value, the higher the pitting resistance.7 For 316L stainless steel, the
Ep− Ecorr difference is almost constant in chloride solutions (0 to 5000 ppm of Cl− ions) in the presence of oxygen at
different pH (2-12).8 For this reason, it was used the E p
values to indicate the susceptibility of this alloy to pitting corrosion.
Previous work has shown that the nitric acid passivation treatment raises the pitting potential of 316 stainless steel (316 SS) in de-aerated seawater by about +250 mV vs. Ag/AgCl/KClsat. in the noble direction.
9 Refaey et al.10
studied the corrosion of 316L SS in different NaCl concentrations (0.01 to 2.0 mol L-1), in the potential range
−700 to +2000 mV vs. Ag/AgCl/KClsat. at a scan rate of
20 mV s-1. They observed that NaCl concentration did
not affect the current vs. potential curves, which were characterized by the appearance of passive and transpassive regions. It was also noticed that the current increased suddenly, without any sign of oxygen evolution, indicating the breakdown of the passive layer and pitting corrosion nucleation.
Studies with 304 stainless steel in ethanolic solutions containing 0.5 mol L-1 HCl and controlled amounts of water
showed that no passivation occurred in the absence of water, while passivation was observed in 10 vol.% water.11 Other
work12 has shown that the passivation behavior of 304
stainless steel in ethanol/water mixtures with hydrochloric acid presents an active-passive transition, which is strongly dependent on the solution water content. Passive layers with high electronic conductivity and high resistance to cation transport (as in aqueous media) are not formed without the presence of water.12
De Anna13 studied the effects of water and chloride
ions on the electrochemical behaviour of iron and 304L stainless steel in alcohols. The media studied were methyl, ethyl, isopropyl, n-butyl and 2-chloroethyl alcohols. The presence of water, even at a very low concentration, strongly influenced the passivation of iron in protic alcoholic solutions. The kinetics of the oxidation reactions, in the presence of water and/or chloride ions, were a function of the specific alcohol.
There has recently been an increase in ethanol demand due to its use as vehicle fuel and, as a consequence of environmental concerns, studies on the corrosion resistance of the materials used in alcohol production plants as well as in transportation and storage equipment are needed. Furthermore, studies concerning the influence of aqueous-organic solvent mixtures on 316L stainless steel corrosion resistance are lacking in the literature. Our group has started a systematic study on the corrosion resistance of
316L SS in ethanolic solutions. Our lately work14 reported
the evaluation of 316L SS corrosion resistance in a solution that simulates the acid hydrolysis of biomass. In that case, the working solution was composed of 65 wt.% ethanol, 35 wt.% water, 1 wt.% H2SO4 and NaCl contents ranging
from 6 × 10⁻⁵ to 0.58 wt.%. In this sense, our study in the
present work was extended to evaluate the AISI 316L SS (UNS S31603) corrosion resistance in both ethanolic and aqueous solutions with higher chloride concentrations. Additionally, the role of H2SO4 content in the solutions
is also studied. Therefore, this work is aimed to study the influences of ethanol, sulfuric acid and chloride on the corrosion resistance of AISI 316L stainless steel by means of potentiodynamic polarization and electrochemical impedance spectroscopy measurements.
Experimental
Sample preparation
The working electrode was a 316L stainless steel (UNS S31603) provided by Dedini S/A (Piracicaba, São Paulo State, Brazil), with a nominal composition (wt.%) of 65.85 (Fe), 17.56 (Cr), 9.44 (Ni), 2.29 (Mo), 3.94 (Mn), 0.64 (S) and 0.25 (Si). A geometrical area of 1 cm2,
delimited by an O-ring, was exposed to the electrolyte. The electrode surface (2 cm length × 1.5 cm width × 2 mm thickness) was progressively polished, starting with 600 and 1200 grade emery papers and finishing with a 1 µm diamond suspension, using a polisher (Buehler®).
The electrodes were then washed and sonicated with acetone, and dried using oil-free compressed air.
Electrochemical cell
All electrochemical studies were carried out in a conventional three-electrode electrochemical cell. The counter electrode was a Pt grid, and all potentials were measured against an Ag/AgCl/KClsat. reference electrode
(+197 mV vs. SHE), connected to the solution via a Luggin capillary.
Procedure and equipment
Experiments were performed in aerated and unstirred 100 wt.% water, and a 35 wt.% water and 65 wt.% ethanol mixture, with 0.09 or 1 wt.% H2SO4 addition, and different
measurements were obtained using an EG&G Model 273A potentiostat and a Solartron-SI1255 system. Before measuring the polarization curves, the electrical circuit was kept open in the different solutions for 2 min. The anodic potential scan was then performed, at a scan rate of 0.166 mV s-1, starting at +50 mV vs. Ag/AgCl/KCl
sat.
below the corrosion potential (Ecorr), and scanning towards
positive potential, either until the appearance of localized corrosion or until the transpassive region was reached. It is very important to note that gas evolution was not observed, what means that neither oxygen nor carbon dioxide was formed. A test for the presence of acetaldehyde in the electrolyte solution before and after polarizing the electrode till +900 mV and +1500 mV vs. Ag/AgCl/KClsat. was also
performed using 2,4-dinitrophenylhydrazine according to the procedure previously described.15
The electrochemical impedance spectroscopy (EIS) measurements were carried out as follows: firstly, the potential was swept towards more positive values, all located in the passive region; second, the circuit was opened and the potential measured for 1 h; then, the impedance diagrams were recorded applying a sine wave of 10 mV rms on the corresponding open circuit potential values, Eoc. The experiments were performed in a frequency range of 100 kHz to 5 mHz, recording 10 points per
frequency decade. The electrical equivalent circuit was fitted to the experimental data using the non-linear least squares method with the software developed by Boukamp.16
Finally, in order to ensure reproducibility, a minimum of two runs were performed for each experiment.
Scanning electron microscopy (SEM) analysis
SEM micrographs of the electrode surface were taken using a scanning electron microscope (JEOL T330A and PHILIPS XL30FEG) after polarizing the electrode at different conditions.
Results and Discussion
Potentiodynamic polarization curves
Figure 1 shows the polarization curve obtained for 316L stainless steel in ethanol mixture (35 wt.% water + 65 wt.% ethanol), containing 1 wt.% H2SO4 and 0.35 wt.%
NaCl, at 25 oC.
The curve was divided into 5 different regions. Region A includes the cathodic part since the scan was initiated at 50 mV below the open circuit potential, Eoc, (or corrosion potential Ecorr) up to the Eoc. In this case, the change from cathodic to anodic current is directly correlated with the corrosion potential (Ecorr). In the polarization curve shown in Figure 1, this value is about +200 mV vs. Ag/AgCl/KClsat..
Region B corresponds to the scan from the corrosion potential to the potential at which the current density practically reached a plateau. In this region, the stainless steel is oxidized and passivation was observed, and the current measured with the applied potential is due to the injection of defects in the natural oxide previously formed before starting the polarization. For even more positive potential, the current densities remained almost constant (region C). For different stainless steels, this potential region was attributed to the increase in the thickness of the oxide film formed in region B.17-20 Some works20-24 considered that the film
thickness increased linearly as a function of potential, and consequently the electric field remained constant (at ca. 106-107 V cm-1) during the film formation process. Under
these conditions, the transfer of metallic cations to the electrolyte is inhibited by the presence of a passive film at the electrode surface. The current behavior in region C can be related to other factors: changes in the electronic
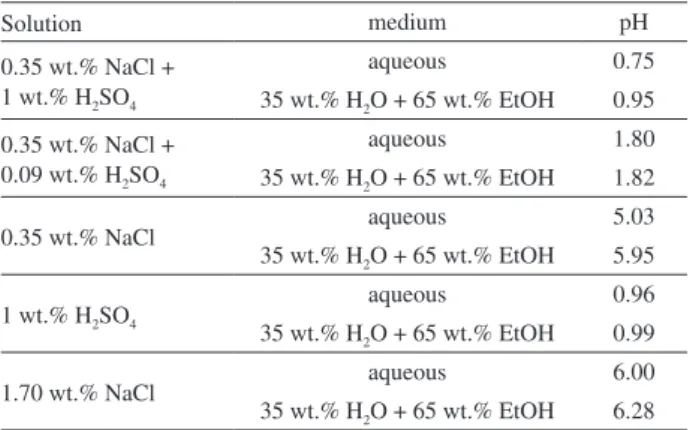
Table 1. Solutions used in the corrosion study of 316L stainless steel
Solution medium pH
0.35 wt.% NaCl + 1 wt.% H2SO4
aqueous 0.75
35 wt.% H2O + 65 wt.% EtOH 0.95
0.35 wt.% NaCl + 0.09 wt.% H2SO4
aqueous 1.80
35 wt.% H2O + 65 wt.% EtOH 1.82
0.35 wt.% NaCl aqueous 5.03
35 wt.% H2O + 65 wt.% EtOH 5.95
1 wt.% H2SO4 aqueous 0.96
35 wt.% H2O + 65 wt.% EtOH 0.99
1.70 wt.% NaCl aqueous 6.00
35 wt.% H2O + 65 wt.% EtOH 6.28
characteristics of the film, the increase in the homogeneity of the oxide film or the decrease in defects inside the film.25-28 Considering the results obtained until now, there
was no experimental support to choose one of these factors responsible for the current plateau observed in the passive region. For the SS used in the present work, the potential and current values attributed to the transition between regions B and C is close to +0.4 V vs. Ag/AgCl/KClsat. and
1 × 10⁻⁶ mA cm-2, respectively. At potentials higher than
approximately +850 mV vs. Ag/AgCl/KClsat., the current
density increased exponentially (region D). No gas evolution was observed in this potential region, and then oxygen evolution is improbable to occur. In the same way, carbon dioxide formation in the gas form was not observed. Since the current density has almost the same values in the presence and absence of ethanol, it is little probable that ethanol oxidation is significant. In order to investigate the possible oxidation of ethanol at high positive potentials, the electrode was polarized at +900 mV vs. Ag/AgCl/KClsat.
or at +1500 mV vs. Ag/AgCl/KClsat. for 30 min in the
ethanolic solution and the electrolyte was analyzed before and after polarization by means of a reaction with 2,4-dinitrophenylhydrazine. All solutions gave negative test for the presence of acetaldehyde. Considering that no gas evolution (CO2) was observed and that the presence of
acetaldehyde was not detected, it was concluded that the oxidation of ethanol, if occurs under these conditions, is of low significance and can be neglected.
In order to determine whether the increase in the current density in region D was associated with steel transpassivation, or it was due to localized corrosion, the potential scan was inverted (region E). In general, the transpassive region is characterized by a rapid process of passivation/metal dissolution at positive potentials, which is usually considered as a type of damage of the passivated metal.29 Transpassivation is a phenomenon that a passive
metal starts rapid dissolution if the electrode potential becomes too positive. It is believed that transpassivation is a process in which some chemical species in the original passive film turning into higher valence and more soluble products. As transpassivation is a rapid dissolution process, it is generally regarded as a type of corrosion damage to a passivated metal.29
The potential inversion can provide information about the feasibility of repairing the damaged film. Current density values higher than those obtained in the direct scan (before inverting the scan) indicate that the damaged passive film is not repaired and/or localized corrosion has started, while smaller current values reflect film repair under the same conditions, and therefore the pitting process (stable pit formation) is not initiated.14 As can be seen in Figure 1, in
the reverse scan, the current density decreased exponentially as the potential decreased, indicating that the current density increase in the direct scan was not associated with the localized corrosion, but with transpassivation of the steel.
In the potential range of the polarization curve, no oxygen evolution was observed. Studies carried out in our laboratory with 316L stainless steel in ethanolic solutions containing 65 wt.% ethanol, 35 wt.% water and 1 wt.% H2SO4 showed that no oxygen evolution occurred
up to 2000 mV vs. Ag/AgCl/KClsat., and therefore it was
concluded that the transpassivation region (about +900 to +2000 mV vs. Ag/AgCl/KClsat.) is not affected by the
oxygen reaction.14 Current density vs. potential profiles with
similar regions to those shown in Figure 1 were obtained in corrosion resistance studies of passive films on 216L and 316L stainless steels in 1 mol L-1 H
2SO4, in the presence of
different NaCl concentrations,30 and for 304L SS in aqueous
solution containing 0.05 mol L-1 H
2SO4 and 0.05 mol L -1
NaCl.31
Figures 2a, 2b, and 2c show the SEM micrographs for the polarized steel in the absence and presence of ethanol, respectively. According to X-ray microanalysis previously performed,14 both images show MnS inclusion
dissolution up to the transpassivation region (+1000 mV and +1500 mV vs. Ag/AgCl/KClsat.). Rounded holes can be seen
on the electrode surface which do not correspond to stable pit formation. In solutions containing 0.35 wt.% NaCl and low H2SO4 concentration (< 1 wt.%), pitting corrosion
was observed. Figures 3 shows cyclic polarization curves obtained in solutions comprising zero and 0.09 wt.% H2SO4
in aqueous and ethanolic solutions, respectively. In both curves a sharp increase of current density was observed for potentials around +400 and +500 mV vs. Ag/AgCl/KClsat.
(Table 2), respectively, suggesting localized corrosion, while no stable pits were observed with 1.0 wt.% H2SO4 (Figure 1).
Figures 4a and 4b depict SEM micrographs of the electrode surfaces where pits are observed, confirming the suggestion given by polarization curves.
Brooks et al.32 reported the incorporation of sulfate and
chromate in the oxide film grown on stainless steel during anodic oxidation in sulfuric acid, and concluded that the incorporation of these anions impeded the ingress of chloride ions into the film. As a consequence of the incorporation of these anions, a coulombic barrier against chloride adsorption is formed, which leads to a high resistance to stable pit formation.33 In the present work,
the anodic oxidation of stainless steel with 1 wt.% H2SO4
might have occurred similarly to the literature.32,33
In an ethanol/water mixture, the maximum amount of NaCl that can be solubilized is close to 2.0 wt.%,34 hence
added to ensure complete salt dissolution (Table 2). No H2SO4 was added since 1 wt.% of acid decreases the salt
solubility in an ethanol/water/NaCl mixture. By adding 1.70 wt.% NaCl to the solution, no ethanol influence was observed in the pitting potential (Table 2). Independently of the employed medium, it can be noted (Table 2) that the pitting potential decreased as the NaCl concentration increased from 0.35 to 1.70 wt.%, and the magnitude of
the pitting potential decrease also depends on the presence of sulfuric acid. Finally, stainless steel-environment combinations that are unlikely to cause pitting will have
Ecorr significantly active to Ep (Ecorr << Ep) or transpassive potential (Et) and only general corrosion commonly occurs.7
This behavior was observed for the solutions without chloride ions and with 0.35 wt.% NaCl + 1 wt.% H2SO4
(Table 2).
Electrochemical impedance spectroscopy measurements
EIS measurements were carried out in order to determine the influence of the solution in the characteristics of the passive film potentiodynamically formed at 0.166 mV s-1.
The potential scanning was performed from the open circuit potential (Ecorr) to three different final potentials (Ef) associated with steel passivation (Table 2), (Ef−Ecorr
was named overpotential from now on), hence avoiding occurrence of pitting or transpassivation (Table 3). The circuit was open and the potential measured for 1 h. The EIS diagrams were then obtained by applying the ac signal on that open circuit potential obtained after the polarization using six solutions, being three with ethanol.
The variation of the open circuit potential after pontentiodynamic polarization in the solutions with and without ethanol was related to differences in viscosity, density and dielectric constant, and possibly to the thickness of the films.
Figure 5 displays the experimental and fitted complex plane (Figure 5a) and Bode (Figure 5b) plots for 316L stainless steel, obtained in aqueous solution and in the 35 wt.% water and 65 wt.% ethanol mixture, both containing 1 wt.% H2SO4 plus 0.35 wt.% NaCl, at 25 oC.
Figure 2. SEM micrographs of 316L stainless steel after polarizing in aqueous solution up to 1000 mV vs. Ag/AgCl/KClsat. (a) and in ethanol mixture (35 wt.% water + 65 wt.% ethanol) up to 1000 mV vs.
Ag/AgCl/KClsat. (b) and ca. 1500 mV vs. Ag/AgCl/KClsat. (c), all solutions containing 1 wt.% H2SO4 and 0.35 wt.% NaCl, at 25 oC.
In these solutions, the oxide films were grown up to +600 mV vs. Ag/AgCl/KClsat., at 0.166 mV s-1, and before
starting the experiments, the sample was held at open circuit potential for 1 h.
Table 2. Parameters for 316L stainless steel obtained from polarization curves in aqueous and ethanolic solutions at 25 oC
Solution medium Ecorr / mV Ep / mV Etrans / mV
0.35 wt.% NaCl + 1 wt.% H2SO4 aqueous −173 ± 66 − +890
35 wt.% H2O + 65 wt.% EtOH +204 ± 6 − +876 ± 8
0.35 wt.% NaCl + 0.09 wt.% H2SO4 aqueous −180 ± 19 +516 ± 30 35 wt.% H2O + 65 wt.% EtOH +50 ± 45 +395 ± 25
0.35 wt.% NaCl aqueous −159 ± 13 +419 ± 56 −
35 wt.% H2O + 65 wt.% EtOH +117 ± 21 +434 ± 71 −
1 wt.% H2SO4 aqueous −158 ± 28 − +900
35 wt.% H2O + 65 wt.% EtOH +180 ± 74 − +874
1.70 wt.% NaCl aqueous −145 ± 34 +271 ± 92 −
35 wt.% H2O + 65 wt.% EtOH −91 ± 23 +266 ± 66 −
Figure 4. SEM micrographs of 316L stainless steel after polarizing up to the pitting corrosion region in aqueous solution (a) and in ethanol mixture (35 wt.% water + 65 wt.% ethanol) + 0.09 wt.% H2SO4 (b), both containing 0.35 wt.% NaCl, at 25 oC.
A simple and incomplete semi-circle in the complex plane plot is clearly seen, and similar impedance diagrams were recorded for all other conditions and studied solutions. According to Park et al.,35 in impedance experiments, a
simple semi-circle corresponds to a charge transfer reaction by means of ionic migration through the passive oxide film. The Bode plots show only one time constant with a phase angle around −80o that can be attributed to the oxide film
on steel (Figure 5b). The presence of only one time constant in Bode plots was also found by Wallinder et al.31 for 304L
stainless steel in aqueous solution containing 0.05 mol L-1
H2SO4 and 0.05 mol L
-1 NaCl, after exposing the sample for
90 min at open circuit potential and polarizing the electrode by applying the open circuit potential. Park et al.35 obtained
similar results for 316L stainless steel in aqueous solution containing 0.5 mol L-1 NaCl and 0.5 mol L-1 NaHCO
3,
applying different anodic potentials.
The electrical equivalent circuit (EEC, see Figure 5a) was fitted to the experimental data.16 The sum of square
deviations (χ2) around 10-3, the low errors (%) associated
with estimation of all the parameters (Table 3), and the good adjustment between the fitted and the experimental diagrams indicate the adequacy of the proposed EEC. The deviation between experimental and adjusted impedance data in Figure 5a in the presence of ethanol observed at low frequency is not clear yet. EEC consists of a constant phase element (CPE) that is composed by a term which is related to the capacitance of the passive film, Qf, and
n the exponent. The heterogeneity of the studied systems leads to non-ideal capacitive responses, thus the so-called constant phase element substitutes the capacitance.36 CPE
is in parallel with the polarization resistance, essentially the resistance of the oxide film. The Rfwas attributed to
the ionic migration inside the film and is in series with the solution resistance, Rsolution.
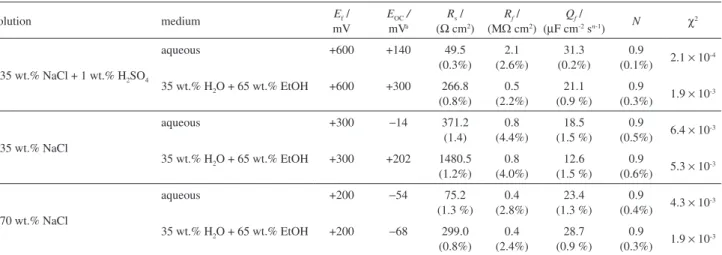
The resistances of the solutions are influenced by their viscosities, densities, dielectric constants and conductivities. Table 3 shows that the solution containing 0.35 wt.% NaCl plus 1 wt.% sulfuric acid presented higher conductivity than the solution without sulfuric acid, and the conductivity was lower when ethanol was present. Also, the solution containing 1.7 wt.% NaCl exhibited higher conductivity than the one with 0.35 wt.% NaCl. Then, it is clear that the presence of ethanol increased the resistivity of all solutions. The values of Rfand Qf present slightly influence of the electrolyte which means that the characteristics of the oxide film, reflected in the impedance diagrams, are practically independent of the Efvalues. The n values are 0.9 and the
phase angle values suggest a near-capacitor behavior.14
Table 4 shows the calculated capacitance and the thickness of the oxide films obtained from the frequency at the maximum imaginary impedance which was estimated from the EEC according to equations 1 and 2.37
C = Q(ωmax)
n-1 (1)
L =ε0ε/C (2)
where C corresponds to the interfacial capacitance,
Q is attributed to the CPE parameter of the interfacial capacitance, n is the exponent, ωmax is the characteristic
frequency at which the imaginary part of impedance reaches its maximum magnitude, L is the thickness of the oxide film, ε0 is the vacuum permittivity (8.854 × 10⁻¹⁴ F cm-1) and ε is
equal to 12 which is the relative dielectric constant of the iron oxide.38,39
Table 3. Selected Ef values and solutions, open circuit potentials applied for EIS measurements, and circuit element parameters (shown in Figure 5b) obtained from the adjustment of their responses to the experimental impedance data
Solution medium Ef /
mV
EOC / mVa
Rs / (Ω cm2)
Rf /
(MΩ cm2)
Qf /
(µF cm-2 sn-1) N χ2 0.35 wt.% NaCl + 1 wt.% H2SO4
aqueous +600 +140 49.5
(0.3%) 2.1 (2.6%) 31.3 (0.2%) 0.9
(0.1%) 2.1 × 10 -4
35 wt.% H2O + 65 wt.% EtOH +600 +300 266.8 (0.8%) 0.5 (2.2%) 21.1 (0.9 %) 0.9
(0.3%) 1.9 × 10 -3
0.35 wt.% NaCl
aqueous +300 −14 371.2
(1.4) 0.8 (4.4%) 18.5 (1.5 %) 0.9
(0.5%) 6.4 × 10⁻³
35 wt.% H2O + 65 wt.% EtOH +300 +202 1480.5 (1.2%) 0.8 (4.0%) 12.6 (1.5 %) 0.9
(0.6%) 5.3 × 10 -3
1.70 wt.% NaCl
aqueous +200 −54 75.2
(1.3 %) 0.4 (2.8%) 23.4 (1.3 %) 0.9
(0.4%) 4.3 × 10 -3
35 wt.% H2O + 65 wt.% EtOH +200 −68 299.0 (0.8%) 0.4 (2.4%) 28.7 (0.9 %) 0.9
(0.3%) 1.9 × 10 -3
aEIS measurements were obtained polarizing the electrode at these potentials, the E
Before discussing the data presented in Table 4, some explanations are needed. It is probably that both the capacitance of the oxide film and the electrical double layer are influencing the CPE (Qf and n) values obtained, mainly if they are similar in magnitude. Then, as both are in series, to have the capacitance of the oxide film only it must be much lower than the electrical double layer capacitance.27 Therefore, it means that the corresponding
thickness estimated from the capacitance values (Table 4) may be not realistic. Also, it is important to note that the anodic potential limits during electrode polarization were chosen to represent a condition in which no pitting or transpassivation phenomena occur. For instance, in the presence of sulfuric acid and 0.35wt.% NaCl, the film was formed by potential sweeping from the Ecorr value (Table 2) to +600 mV considering that no pitting attack was observed. The transpassive potential is higher than +600 mV vs. Ag/AgCl/KClsat. and almost the same in the
presence and absence of ethanol. Hence, the same anodic potential limit was applied when ethanol was added to the aqueous solution. However, even considering that the same final potential was applied, the overpotential (Ef−Ecorr) was different for these two solutions, being higher for aqueous solution, which may result in a thicker film. Thus, a thinner film should be expected for the solution containing ethanol, which cannot be seen in Table 4. Also, it is possible that the electrical double layer is influencing the C value, which could occur if large quantity of defects is present in the oxide film.40
For the other solutions (Table 2), pitting attack was observed, and then, the anodic polarization was limited to a potential around 0.1 V lower than the pitting potential. The anodic potential limits in which +300 and +200 mV, respectively for the solutions with 0.35 and 1.70 wt.% NaCl without sulfuric acid. For the solution with 0.35 wt.% NaCl, the capacitance value in the presence of ethanol led to the formation of a thicker film than in its absence, and no significant influence of ethanol was observed in the solution with 1.7 wt.% NaCl. In the last solution, the overpotential in
the absence and presence of ethanol was almost the same, around +300 mV.
Electrochemical and X-ray photoelectron spectroscopy (XPS) studies of passive films formed on stainless steel in solutions containing borate buffer and chloride showed that film composition is dependent on its thickness and the electrolyte.41 Thus, the oxide films formed on 316L stainless
steel immersed in different electrolytes may have different compositions, as well as thickness, and consequently different electrical properties.
Conclusions
In conclusion, the influence of ethanol, acidity and chloride concentration on the corrosion resistance of AISI 316L stainless steel was investigated by means of polarization curves and electrochemical impedance spectroscopy. The electrochemical results evidenced the presence of an oxide layer onto the 316L stainless steel (316 SS) which in conjunction with pitting potential values ensures the corrosion resistance of this kind of SS in different media (ethanolic and aqueous solutions) at room temperature. Independently of the employed media, it was found that pitting potential decreased as the NaCl concentration increased, from ca. +400 mV vs. Ag/AgCl/KClsat. (0.35 wt.% NaCl)
to approximately +250 mV vs. Ag/AgCl/KClsat.
(1.70 wt.% NaCl). In both solutions, with and without ethanol, plus 0.35 wt.% NaCl, the presence of 1 wt.% H2SO4
inhibited the appearance of pitting corrosion at 25 oC.
The electrical equivalent circuit adjusted for the impedance data was (Rsolution[RfQf]), which consists of a CPE in parallel with the polarization resistance, being in series with the solution resistance, Rsolution. CPE is composed by a term related to the capacitance of the passive film,
Qf, and n the exponent. The Rf was attributed to the ionic migration inside the film, essentially the resistance of the oxide film. Based on the Qf value the capacitance of the film, Cfwas calculated, which allowed estimating the oxide film thickness.
Table 4. Capacitance values and estimated oxide thickness calculated from equation 1 and 2 for the aqueous and ethanolic solutions studied in this work at 25 oC
Solution medium Cf / (µF cm-2) L / nm
0.35 wt.% NaCl + 1 wt.% H2SO4 aqueous 45.2 23
35 wt.% H2O + 65 wt.% EtOH 31.9 33
0.35 wt.% NaCl aqueous 29.3 36
35 wt.% H2O + 65 wt.% EtOH 19.1 56
1.70 wt.% NaCl aqueous 35.4 30
Acknowledgements
The authors gratefully acknowledge financial support and scholarships from the Brazilian funding agencies FAPESP (proc. No. 2008/50579-7) and CNPq (proc. Nos. 305890/2010-7 and 150729/2011-1).
References
1. Pardo, A.; Merino, M. C.; Coy, A. E.; Viejo, F.; Arrabal, R.; Matykina, E.; Corros. Sci.2008, 50, 780.
2. Sugimoto, K.; Sawada, Y.; Corros. Sci.1977, 17, 425. 3. Leygraf, C.; Hulquist, G.; Olefjord, I.; Elfstrom, B. O.;
Knyazheva, V. M.; Plaskeyev, A. V.; Kolotyrkin, Y. M.; Corros. Sci.1979, 19, 343.
4. Jargelius-Petterson, R. F. A.; Pound, B. G.; J. Electrochem. Soc.
1998, 145, 1462.
5. Scotto, V.; Ventura, G.; Traverso, E.; Corros. Sci.1979, 19, 237. 6. Szklarska-Smialowska, Z.; Corrosion1972, 18, 388.
7. Sedriks, A. J.; Corrosion of Stainless Steels; John Wiley & Sons, Inc.: New York, USA, 1996, p. 105.
8. Lothongkum, G.; Vongbandit, P.; Nongluck, P.; Anti-Corros. Methods Mater. 2006, 53, 169.
9. Barbosa, M. A.; Corros. Sci.1983, 23, 1293.
10. Refaey, S. A. M.; Taha, F.; Abd El-Malak, A. M.; Int. J. Electrochem. Sci.2006, 1, 80.
11. Kelly, R. G.; Moran, P. J.; Corros. Sci.1990, 30, 495. 12. Elsener, B.; Virtanen, S.; Boehni, H.; Electrochim Acta1987,
32, 927.
13. De Anna, P. L.; Corros. Sci.1985, 25, 43.
14. Ferreira, E. A.; Noce, R. D.; Fugivara, C. S.; Benedetti, A. V.;
J. Electrochem. Soc.2011, 132, 2854.
15 Pavia, D. L.; Lampman, G. M.; Kriz, G. S.; Engel, R. G.;
Introduction to Organic Laboratory Techniques; Saunders
College Publishing: Philadelphia, USA, 1998. 16. Boukamp, B. A.; Solid State Ionics1986, 18, 136. 17. Song, G. L.; Corros. Sci.2005, 47, 1953. 18. Stern, M.; J. Electrochem. Soc.1959, 106, 376.
19. Olefjord, I.; Brox, B.; Jelvestam, U.; J. Electrochem. Soc.1985,
132, 2854.
20. Fattah-Alhosseini, A.; Saatchi, A.; Golozar, M. A.; Raeissi, K.;
J. Appl. Electrochem.2010, 40, 457.
21. Sato, N.; Corros. Sci.1990, 31, 1.
22. Chao, C. Y.; Lin, L. F.; Macdonald, D. D.; J. Electrochem. Soc.
1981, 128, 1187.
23. Ferreira, E. A.; Rocha-Filho, R. C.; Biaggio, S. R.; Bocchi, N.;
Corros. Sci.2010, 52, 4058.
24. Sun, E. X.; Nowak, W. B.; Corros. Sci.2001, 43, 1801. 25. Schultze, J. W.; Lohrengel, M. M.; Electrochim. Acta1987, 45,
2499.
26. Schmidt, A. M.; Azambuja, D. S.; Martini, E. M. A.; Corros. Sci.2006, 48, 2901.
27. Fattah-Alhosseini, A.; Golozar, M. A.; Saatchi, A.; Raeissi, K.;
Corros. Sci.2010, 52, 205.
28. Bojinov, M.; Fabricius, G.; Kinnunen, P.; Laitinen, T.; Mäkelä, K.; Saario, T.; Sundholm, G.; J. Electroanal. Chem.
2001, 504, 29.
29. Song, G. L.; Corros. Sci.2005, 47, 1953.
30. Rao, V. S.; Singhal, L. K.; J. Mater. Sci.2009, 44, 2327. 31. Wallinder, D.; Pan, J.; Leygraf, C.; Delblanc-Bauer, A.; Corros.
Sci.2000, 42, 1457.
32. Brooks, A. R.; Clayton, C. R.; Doss, K.; Lu, Y. C.;
J. Electrochem. Soc.1986, 133, 2459.
33. Barbucci, A.; Cerisola, G.; Cabot, P. L.; J. Electrochem. Soc.
2002, 149, B534.
34. Galleguillos, H. R.; Taboada, M. E.; Graber, T. A.; Bolado, S.;
J. Chem. Eng. Data2003, 48, 405.
35. Park, J. J.; Pyun, S. I.; Lee, W. J.; Kim, H. P.; Corrosion1999,
55, 380.
36. Macdonald, J. R.; Impedance Spectroscopy - Emphasizing Solid Materials and Systems; John Wiley & Sons, Inc.: New York,
USA, 1987.
37. Orazem, M. E.; Tribollet, B.; Electrochemical Impedance Spectroscopy; John Wiley & Sons, Inc.: New York, USA, 2008.
38. Goodlet, G.; Faty, S.; Cardoso, S.; Freitas, P. P.; Simoes, A. M. P.; Ferreira, M. G. S.; Belo, M. D.; Corros. Sci.2004,
46, 1479.
39. Nicic, I.; Macdonald, D. D.; J. Nucl. Mater. 2008, 54, 379. 40. Morrison, S. R.; Electrochemistry of Semiconductor and
Oxidized Metal Electrodes; Plenum Press: New York, USA,
1984.
41. Kocijan, A.; Donik, C.; Jenko, M.; Corros. Sci.2007, 49, 2083.
Submitted: September 20, 2012
Published online: March 5, 2013