Resistance to Gray Leaf Spot of Maize:
Genetic Architecture and Mechanisms
Elucidated through Nested Association
Mapping and Near-Isogenic Line Analysis
Jacqueline M. Benson1*, Jesse A. Poland2, Brent M. Benson3, Erik L. Stromberg4, Rebecca J. Nelson1
1School of Integrative Plant Sciences, Cornell University, Ithaca, New York, United States of America,2
Department of Agronomy, Kansas State University, Manhattan, Kansas, United States of America,3203 Solutions LLC, Baltimore, Maryland, United States of America,4Department of Plant Pathology, Physiology and Weed Science, Virginia Polytechnic Institute, Blacksburg, Virginia, United States of America
Abstract
Gray leaf spot (GLS), caused byCercospora zeae-maydisandCercospora zeina, is one of the most important diseases of maize worldwide. The pathogen has a necrotrophic lifestyle and no major genes are known for GLS. Quantitative resistance, although poorly under-stood, is important for GLS management. We used genetic mapping to refine understanding of the genetic architecture of GLS resistance and to develop hypotheses regarding the mechanisms underlying quantitative disease resistance (QDR) loci. Nested association mapping (NAM) was used to identify 16 quantitative trait loci (QTL) for QDR to GLS, includ-ing seven novel QTL, each of which demonstrated allelic series with significant effects above and below the magnitude of the B73 reference allele. Alleles at three QTL,
qGLS1.04,qGLS2.09, andqGLS4.05, conferred disease reductions of greater than 10%. In-teractions between loci were detected for three pairs of loci, including an interaction be-tweeniqGLS4.05andqGLS7.03. Near-isogenic lines (NILs) were developed to confirm and fine-map three of the 16 QTL, and to develop hypotheses regarding mechanisms of resis-tance.qGLS1.04was fine-mapped from an interval of 27.0 Mb to two intervals of 6.5 Mb and 5.2 Mb, consistent with the hypothesis that multiple genes underlie highly significant QTL identified by NAM.qGLS2.09, which was also associated with maturity (days to anthesis) and with resistance to southern leaf blight, was narrowed to a 4-Mb interval. The distance between major leaf veins was strongly associated with resistance to GLS atqGLS4.05. NILs forqGLS1.04were treated with theC.zeae-maydistoxin cercosporin to test the role of host-specific toxin in QDR. Cercosporin exposure increased expression of a putative flavin-monooxygenase (FMO) gene, a candidate detoxification-related gene underlying
qGLS1.04. This integrated approach to confirming QTL and characterizing the potential un-derlying mechanisms advances the understanding of QDR and will facilitate the develop-ment of resistant varieties.
OPEN ACCESS
Citation:Benson JM, Poland JA, Benson BM, Stromberg EL, Nelson RJ (2015) Resistance to Gray Leaf Spot of Maize: Genetic Architecture and Mechanisms Elucidated through Nested Association Mapping and Near-Isogenic Line Analysis. PLoS Genet 11(3): e1005045. doi:10.1371/journal. pgen.1005045
Editor:Gunther Doehlemann, Max Planck Institute for Terrestrial Microbiology, Germany
Received:August 27, 2014
Accepted:January 30, 2015
Published:March 12, 2015
Copyright:© 2015 Benson et al. This is an open access article distributed under the terms of the
Creative Commons Attribution License, which permits unrestricted use, distribution, and reproduction in any medium, provided the original author and source are credited.
Data Availability Statement:All relevant data are within the paper and its Supporting Information files.
Author Summary
Gray leaf spot (GLS), a necrotrophic, foliar fungal disease of maize, contributes to maize yield losses worldwide. We identified and characterized regions of the maize genome that confer resistance to GLS and gained insight into the mechanisms associated with these quantitative trait loci (QTL). We provide evidence for structural and detoxification-related mechanisms underlying quantitative resistance. The distance between major veins of the maize leaf was positively correlated with the quantity of fungal conidiophores (reproduc-tive structures) produced. Four of the GLS QTL were associated with inter-vein distance, and co-localization was confirmed for one of these QTL in near-isogenic lines. In addition, up-regulation of a putative detoxification-related flavin-monooxygenase gene was corre-lated with a fine-mapped QTL. Plant breeding decisions regarding development and deployment of disease resistance traits can be improved with better understanding of the mechanisms underlying quantitative disease resistance.
Introduction
Plants resist attack by many plant pathogens by inducing localized cell death. This strategy can provide effective defense against pathogens that require living host tissue (biotrophs or hemi-biotrophs) and is the basis for most monogenic resistance. However, it is not effective for path-ogens that feed on dead tissue (necrotrophs) [1]. For this reason, complete, single-gene resistance is typically unavailable for diseases caused by necrotrophic pathogens [2,3]. Gray leaf spot (GLS), a foliar disease of maize caused by the polycyclic pathogensCercospora
zeae-maydisandCercospora zeina[4,5], is a necrotrophic pathogen that is mostly controlled by
quantitative forms of host plant resistance. Understanding the mechanisms underlying resis-tance to GLS may further elucidate the biology of host-pathogen interactions since there are contrasting mechanisms of defense against necrotrophic and biotrophic pathogens [6]. GLS is one of the most important maize diseases in the United States and in maize-growing regions worldwide [7]. It can cause yield losses over 70% due to associated severe blighting, stalk deteri-oration and lodging [8,9].
Although it is critical for the management of most plant diseases (not only those caused by necrotrophic pathogens), the genetic basis of quantitative disease resistance is not well under-stood. A better understanding of the genetic architecture and the underlying genes and mecha-nisms could contribute to crop improvement and disease management. Previous QTL studies have improved understanding of the genetic architecture by identifying regions of the genome that confer resistance to GLS [4,10–22]. The aim of this study was to improve understanding of the locations, sizes and interactions among loci controlling GLS resistance using nested associ-ation mapping (NAM) [23] and to develop hypotheses concerning the underlying mechanisms of resistance.
Quantitative resistance can be divided into a range of sub-phenotypes at the macroscopic and microscopic levels. These phenotypes include reduction in total number of infections, re-duction in lesion expansion, rere-duction of sporulation, lengthening of the latent period, and in-creasing the number of propagules necessary to establish infection [24]. Individual QTL may differentially affect specific sub-phenotypes [25]. Poland et al. [26] provided six hypotheses re-garding mechanisms that underlie QDR loci: (1) genes that underlie plant development and ar-chitecture, (2) genes with mutations or allelic changes in genes involved in basal defense, (3) genes involved in secondary metabolite production known to fend off pathogen attacks, (4) genes involved in signal transduction, (5) weak forms ofR-genes, and (6) genes previously
Food and Agriculture (NIFA) or the United States Department of Agriculture (USDA). This research was also supported (in part) by the McKnight Foundation (http://www.mcknight.org/) and Cornell University (http://www.cornell.edu). These funders had no role in study design, data collection and analysis, decision to publish, or preparation of the manuscript.
unassociated with pathogen defense. Cloning of several disease QTL has provided hints about the underlying molecular mechanisms involved in resistance [27–32].
Poland’s third hypothesis above indicates that such mechanisms might include those in-volved in chemical warfare between plant pathogens and their hosts. For example, genes for re-sistance might mitigate the damaging effects of microbial compounds on host tissues. Plant pathogens produce an array of toxic molecules and enzymes that aid in host infection [33]. These products come in diverse chemical forms and are either host non-specific or specific.
Cercospora zeae-maydis, the predominant causal agent of GLS in the United States, produces
the non-host-selective toxin cercosporin. Cercosporin is a photo-activated perylenequinone that converts molecular oxygen to active oxygen species, including singlet oxygen [34]. Plant carotenoids play a key role in quenching singlet oxygen before it damages the chloroplast or other machinery within the plant cell [35] and are hypothesized to play a role in defense against toxins that produce reactive oxygen species [36]. Additional enzymes and metabolites, such as oxidoreductases and secondary metabolites with antioxidant properties, may be involved in cercosporin detoxification or in reducing damage caused by cercosporin [37–39]. We explored the hypothesis that detoxification could play a role in GLS resistance by analyzing the annota-tion and expression of genes underlying one of the detected GLS loci.
It has also been proposed that some genes conferring quantitative disease resistance are related to morphological and developmental processes such as leaf structure and flowering time [40,41]. GLS symptoms include tan-colored, rectangular-shaped lesions that elongate parallel to the leaf venation. Lesions appear to be bounded by major veins [42]. We hypothe-sized that inter-vein distance (IVD) could act as a resistance-related parameter for GLS, be-cause the width of GLS lesions is defined by IVD. Although there is evidence that lesion expansion can contribute significantly to disease epidemics caused byCercospora spp., to our knowledge, no studies have examined the relationship between leaf venation structure and le-sion development.
Results
Heritability of resistance
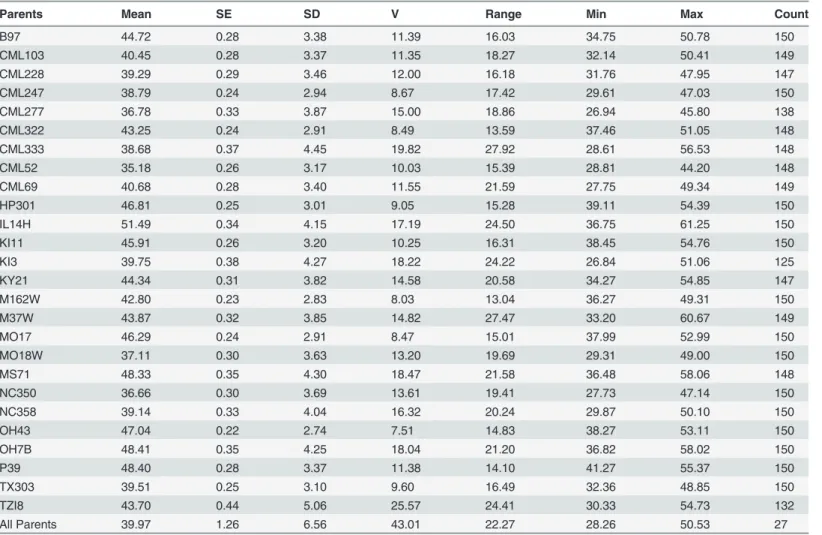
The NAM population was screened for GLS in Blacksburg, VA, and exhibited a wide range of disease levels among parental lines within and among populations (Table 1). Parental line AUDPC varied from 35.2 to 51.5 at the point of maximum variance identified among BLUPs. Mean NAM population AUDPC was 42.6 (σ2= 13.2). Broad sense heritability on an individual plot basis was 0.72, while on a line mean basis, correcting for the unbalanced design of the ex-periment, it was 0.83 [43]. Additive genetic variance was responsible for 52% of the phenotypic variance as determined by calculating the correlation between the sum of all parental effects and the parental phenotypic BLUPs.
Disease resistance loci and interactions
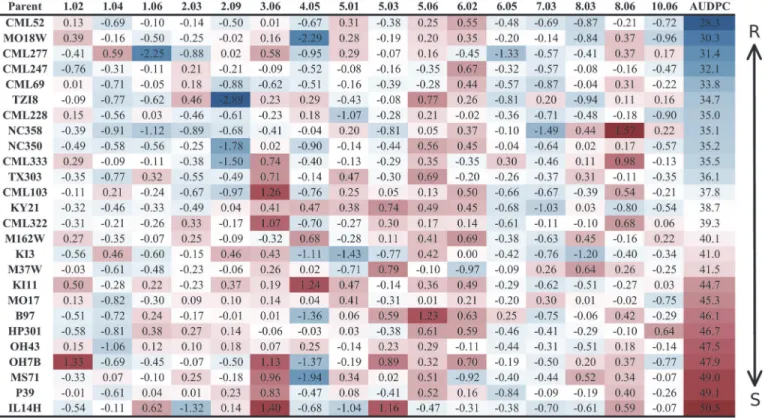
Significant model-selected QTL explained 78.5% of the phenotypic variation within the pop-ulation, while inclusion of all QTL (p<0.05) explained 82.2% of the variation. The parental LSM of AUDPC for each locus was used to estimate the effect of each allele on disease levels. Alleles at three loci,qGLS1.04,qGLS2.09andqGLS4.05, were predicted to confer disease re-duction of greater than 10% (Fig. 2). The greatest change in disease reduction was predicted to be 11.7% for the TZI8 allele atqGLS2.09.
All possible two-way interactions were entered one-by-one as predictors of AUDPC in the GLM model containing main-effect QTL and the parameters DTA and population. Three alle-lic interactions were detected. One pair of interacting loci involved two markers within signifi-cant disease QTL confidence intervals. There was a signifisignifi-cant interaction between the two Table 1. AUDPC summary statistics for the nested association mapping population.
Parents Mean SE SD V Range Min Max Count
B97 44.72 0.28 3.38 11.39 16.03 34.75 50.78 150
CML103 40.45 0.28 3.37 11.35 18.27 32.14 50.41 149
CML228 39.29 0.29 3.46 12.00 16.18 31.76 47.95 147
CML247 38.79 0.24 2.94 8.67 17.42 29.61 47.03 150
CML277 36.78 0.33 3.87 15.00 18.86 26.94 45.80 138
CML322 43.25 0.24 2.91 8.49 13.59 37.46 51.05 148
CML333 38.68 0.37 4.45 19.82 27.92 28.61 56.53 148
CML52 35.18 0.26 3.17 10.03 15.39 28.81 44.20 148
CML69 40.68 0.28 3.40 11.55 21.59 27.75 49.34 149
HP301 46.81 0.25 3.01 9.05 15.28 39.11 54.39 150
IL14H 51.49 0.34 4.15 17.19 24.50 36.75 61.25 150
KI11 45.91 0.26 3.20 10.25 16.31 38.45 54.76 150
KI3 39.75 0.38 4.27 18.22 24.22 26.84 51.06 125
KY21 44.34 0.31 3.82 14.58 20.58 34.27 54.85 147
M162W 42.80 0.23 2.83 8.03 13.04 36.27 49.31 150
M37W 43.87 0.32 3.85 14.82 27.47 33.20 60.67 149
MO17 46.29 0.24 2.91 8.47 15.01 37.99 52.99 150
MO18W 37.11 0.30 3.63 13.20 19.69 29.31 49.00 150
MS71 48.33 0.35 4.30 18.47 21.58 36.48 58.06 148
NC350 36.66 0.30 3.69 13.61 19.41 27.73 47.14 150
NC358 39.14 0.33 4.04 16.32 20.24 29.87 50.10 150
OH43 47.04 0.22 2.74 7.51 14.83 38.27 53.11 150
OH7B 48.41 0.35 4.25 18.04 21.20 36.82 58.02 150
P39 48.40 0.28 3.37 11.38 14.10 41.27 55.37 150
TX303 39.51 0.25 3.10 9.60 16.49 32.36 48.85 150
TZI8 43.70 0.44 5.06 25.57 24.41 30.33 54.73 132
All Parents 39.97 1.26 6.56 43.01 22.27 28.26 50.53 27
Descriptive statistics for area under the disease progress curve within the nested association mapping sub-populations (sub-population is indicated by the non-B73 parent) and among the parental lines.
SE = Standard Error SD = Standard Deviation V = Variance
Min = minimum Max = maximum
QTL significant for disease atqGLS4.05andqGLS7.03. The other two pairs involved interac-tions between significant and non-significant markers atp<1.0x10⁻⁵. One of these interactions was betweenqGLS2.03and maize bin 7.06 (175.8 Mb) while the other was betweenqGLS6.02
and8.02(12.3 Mb).
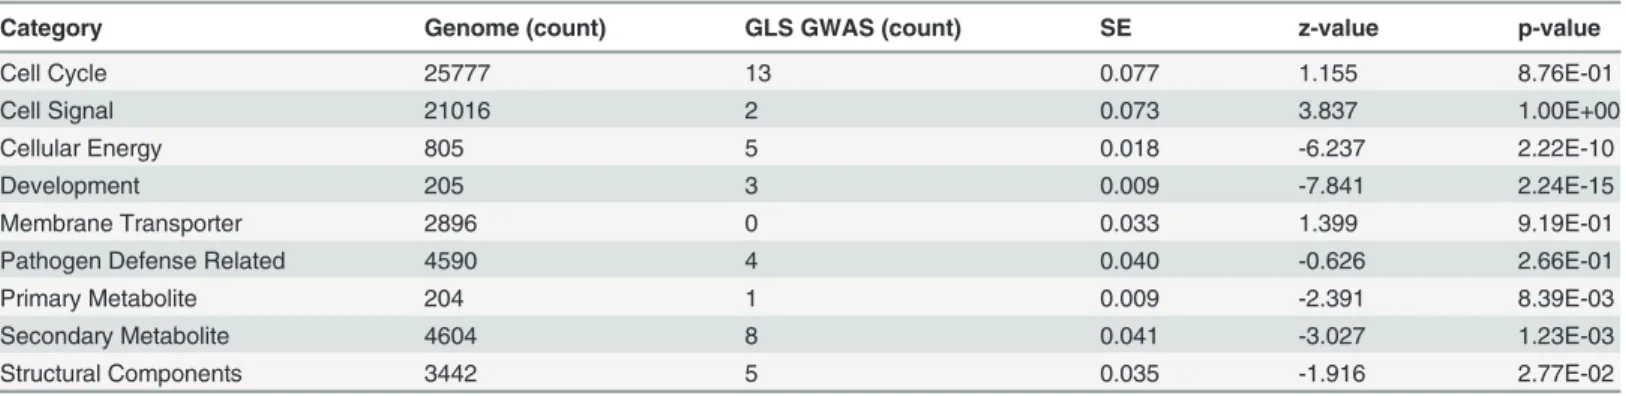
In addition to joint linkage, The NAM population was used to identify loci associated with resistance to GLS based on a genome-wide association study (GWAS). GWAS revealed a total of 145 single-nucleotide polymorphisms (SNPs) that were significantly associated with the GLS phenotype (S1 Table). One or more genes were identified within a 20 kb window of the signifi-cant association (hit) for 63 of the 145 GWAS hits (S1 Table). Characterized functional annota-tions based on the gene sequence provided in the maize B73 reference genome (V2) were detected for 41 of the 63 genes located within 20 kb of a GWAS hit. A proportions test was con-ducted for the gene ontology (GO) terms in each of these 41 genes to determine whether the observed frequency of the evaluated gene type associated with GLS QTL exceeded the frequen-cy that would be expected at random, based on the frequenfrequen-cy of the evaluated gene type in the maize genome (Table 3). Genes related to cellular energy, development, and secondary metab-olites were statistically overrepresented categories withp-values of 2.22 x 10⁻¹⁰, 2.24 x 10⁻¹⁵, and 1.23x10⁻³, respectively.
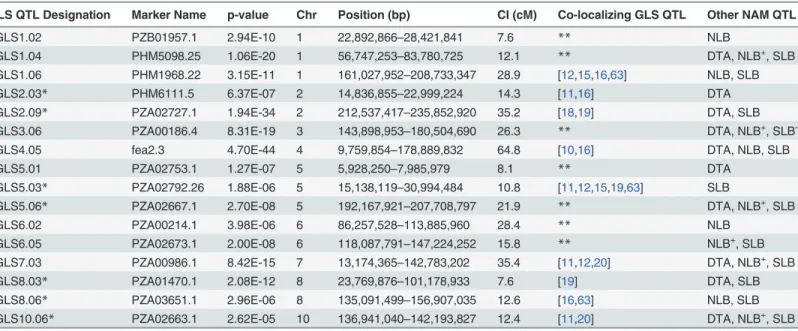
Table 2. Summary of resistance to gray leaf spot (GLS) in the nested association mapping population.
GLS QTL Designation Marker Name p-value Chr Position (bp) CI (cM) Co-localizing GLS QTL Other NAM QTL
qGLS1.02 PZB01957.1 2.94E-10 1 22,892,866–28,421,841 7.6 ** NLB
qGLS1.04 PHM5098.25 1.06E-20 1 56,747,253–83,780,725 12.1 ** DTA, NLB+, SLB
qGLS1.06 PHM1968.22 3.15E-11 1 161,027,952–208,733,347 28.9 [12,15,16,63] NLB, SLB
qGLS2.03* PHM6111.5 6.37E-07 2 14,836,855–22,999,224 14.3 [11,16] DTA
qGLS2.09* PZA02727.1 1.94E-34 2 212,537,417–235,852,920 35.2 [18,19] DTA, SLB
qGLS3.06 PZA00186.4 8.31E-19 3 143,898,953–180,504,690 26.3 ** DTA, NLB+, SLB
-qGLS4.05 fea2.3 4.70E-44 4 9,759,854–178,889,832 64.8 [10,16] DTA, NLB, SLB
qGLS5.01 PZA02753.1 1.27E-07 5 5,928,250–7,985,979 8.1 ** DTA
qGLS5.03* PZA02792.26 1.88E-06 5 15,138,119–30,994,484 10.8 [11,12,15,19,63] SLB
qGLS5.06* PZA02667.1 2.70E-08 5 192,167,921–207,708,797 21.9 ** DTA, NLB+, SLB
qGLS6.02 PZA00214.1 3.98E-06 6 86,257,528–113,885,960 28.4 ** NLB
qGLS6.05 PZA02673.1 2.00E-08 6 118,087,791–147,224,252 15.8 ** NLB+, SLB
qGLS7.03 PZA00986.1 8.42E-15 7 13,174,365–142,783,202 35.4 [11,12,20] DTA, NLB+, SLB
qGLS8.03* PZA01470.1 2.08E-12 8 23,769,876–101,178,933 7.6 [19] DTA, SLB
qGLS8.06* PZA03651.1 2.96E-06 8 135,091,499–156,907,035 12.6 [16,63] NLB, SLB
qGLS10.06* PZA02663.1 2.62E-05 10 136,941,040–142,193,827 12.4 [11,20] DTA, NLB+, SLB
Quantitative trait loci (QTL) were identified by nested association mapping of GLS resistance. Model selection results are given in relation to the co-localizing QTL associated with previously published studies.p<0.0001, Chr = Chromosome
CI = Confidence Interval
DTA = Blacksburg (Whitethorne Farms)-specific days to anthesis Southern Leaf Blight (SLB) QTL Source: [46]
Northern Leaf Blight (NLB) QTL Source: [40] Asterisks indicate better resolved QTL
double asterisks denote QTL reported here for thefirst time
+,-indicates signi
ficant positive, negative association of allelic effects, respectively.
Disease QTL confirmation and pleiotropic loci
The three most significant QTL based on the predictive model,qGLS1.04,qGLS2.09,qGLS4.05, were confirmed using near-isogenic line pairs (NILs) extracted from heterogeneous inbred fami-lies (HIFs; [44]) (Table 2). Two of these QTL for GLS were previously reported, whileqGLS1.04
is reported here for the first time. The families were composed of RIL that had been selfed for seven generations. Lines of the original S5generation that were heterozygous at one of the three
loci of interest were identified. Corresponding S7lines were genotyped. For each HIF, at least six
lines resulting from independent recombination events (three with the B73 allele and three with the alternate allele) were identified for further analysis of the three loci of interest.
The observed levels of disease were significantly different among the NILs for the B73 and other parent alleles (Fig. 3;p<0.05). The observed allelic effects were higher than those ex-pected based on model predictions. NILs with the CML228 allele atqGLS1.04exhibited an av-erage of 12% less disease compared to NILs carrying the B73 allele at the same locus, while the model predicted a 2.5% disease reduction. Lines with the CML333 allele atqGLS2.09exhibited an average of 22% less disease while the model predicted a 5.2% reduction. Finally, lines with the KI11 allele atqGLS4.05exhibited an average disease increase of 8.4% relative to lines with the B73 allele at the same locus, while the model predicted a 5.1% increase in disease.
Buckler et al. [45] previously identified flowering time QTL using the NAM population. Days to anthesis (DTA) data from that study (obtained from Aurora, NY) as well as from the present study were analyzed in relation to GLS disease progress data. A quadratic relationship was identified when the DTA data from Buckler et al. [45] were associated with disease Fig 1. Parental allelic effects at quantitative trait loci.The bin number is listed in the respective column header between the first and last columns. Two sets of data are presented in this figure. Estimated allelic effects relative to the B73 allele of parental lines atqGLSbinfor relative change in disease are listed. The values in the table are the coefficients of the general linear model parameter while the color coding is indicative of area under the disease progress curve. R = resistant; S = susceptible.
progress collected in Blacksburg, while the relationship between DTA and disease progress in Blacksburg was linear. A linear relationship is preferred for general linear modeling, so the only DTA dataset used in this study was collected from the Blacksburg location. Ten of the GLS QTL had confidence intervals that overlapped with those of DTA QTL (Table 2). The DTA allelic effects were predicted to be significant atqGLS1.04CML228(p= 0.0402) and
qGLS4.05KI11(p= 0.0244). Although DTA differences were significant among the NILs (p=
0.0263), the LSM differences in disease between the two alleles atqGLS4.05KI11did not change when DTA was removed from the model.
In addition to DTA, QTL for northern leaf blight (NLB) and southern leaf blight (SLB) were previously identified using the NAM population [40,46]. The QTL count and absolute value of the QTL effect size were analyzed across GLS, NLB, SLB and DTA. There were significant dif-ferences in QTL effect size across all four traits (Fig. 4;p= 6.33x10⁻³⁰). Fewer, significantly larger effect QTL were identified for GLS than for NLB and SLB. NLB and SLB QTL counts were similar, but effect sizes for SLB were significantly smaller. There was evidence of pleiotro-py at several loci, based on correlations among allele effects for the different diseases. Allelic ef-fects of GLS QTL were positively correlated with those of NLB QTL at six loci (Table 2;
p<0.05). GLS QTL were negatively associated with allelic effects of SLB QTL at one locus (Table 2;p<0.05).
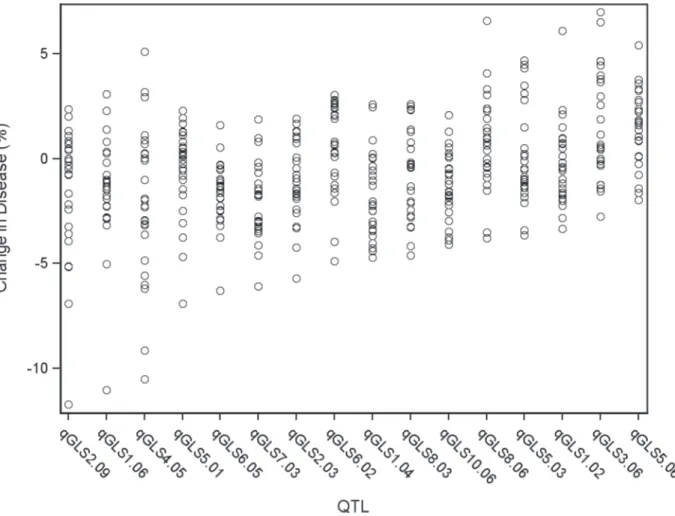
Fig 2. General linear model predicted percent change in disease across significant disease quantitative trait loci (QTL).Each circle indicates the predicted change in disease of a single allele. There are 26 circles for each QTL, each representating the allele from one of the nested association mapping parental sources.
qGLS1.04
CML228: fine-mapping and flavin-monooxygenase expression
NIL pairs were developed for theqGLS1.04CML228locus. The allelic effect of the locus on GLS disease progress was determined, as noted above, and the locus was subsequently fine-mapped Table 3. Summary statistics of functionally annotated and categorized genome wide association hits.
Category Genome (count) GLS GWAS (count) SE z-value p-value
Cell Cycle 25777 13 0.077 1.155 8.76E-01
Cell Signal 21016 2 0.073 3.837 1.00E+00
Cellular Energy 805 5 0.018 -6.237 2.22E-10
Development 205 3 0.009 -7.841 2.24E-15
Membrane Transporter 2896 0 0.033 1.399 9.19E-01
Pathogen Defense Related 4590 4 0.040 -0.626 2.66E-01
Primary Metabolite 204 1 0.009 -2.391 8.39E-03
Secondary Metabolite 4604 8 0.041 -3.027 1.23E-03
Structural Components 3442 5 0.035 -1.916 2.77E-02
Significant GWAS hits were functionally annotated using basic local alignment search tool. These annotations were categorized into biological groups, which include: structural components, secondary metabolites, primary metabolites, genes previously implicated in pathogen-defense, membrane transporter, development, cellular energy, cell signaling, and cell cycle. The genes on the inter-pro hit list (www.maizesequence.org) were also categorized into these same categories. The genome count indicates the total number of genes within the genome in the given category, and the GLS (Count) indicates the number of annotated GLS GWAS hits in a given category. A proportion z-test was used to test the abundance of genes in a given category relative to the overall abundance predicted in the maize genome. SE: standard error.
doi:10.1371/journal.pgen.1005045.t003
Fig 3. Confirmation of three disease quantitative trait loci using near isogenic lines.Disease development [area under the disease progress curve (AUDPC)]is indicated among heterogeneous inbred family lines across three gray leaf spot quantitative trait loci.
using derivatives of the same HIF population. The QTL interval spanned from 56,747,253 Mb to 83,780,725 Mb. The estimated recombination rate at this locus was 0.236 cM/Mb. The QTL was fine-mapped to two intervals of 77,242,690 to 83,780,725 Mb and 88,849,284 to 94,085, 195 Mb, referred to asqGLS1.04_1andqGLS1.04_2(Table 4). TheqGLS1.04_1interval con-tained 99 genes based on version 2 of the maize genome (www.maizesequence.org), while the
qGLS1.04_2interval contained 51 genes. The genes within these regions were functionally
anno-tated using BLAST. Both intervals in the 1.04 region were observed to have a high density of de-fense response (DR) genes. Genes implicated in detoxification constituted 13% of genes at the
qGLS1.04_1locus and 9.8% at theqGLS1.04_2locus. Proportion tests revealed that putative
glu-tathione-S-transferase genes were significantly more numerous than expected (Table 5). Fig 4. Absolute value of quantitative trait loci (QTL) effect size across three diseases and flowering time.Effect sizes of QTL for gray leaf spot, northern leaf blight, southern leaf blight and Blacksburg specific days to anthesis were significantly different (p= 6.33x10⁻³⁰).
doi:10.1371/journal.pgen.1005045.g004
Table 4. Markers and associated p-values from the qGLS1.04fine-mapping analysis.
Marker Chromosome Location p-value
PZA03168.5 1 51514741 0.808
PZA01267.3 1 77242690 0.5963
PZA00752.1 1 82019775 8.687E-08
PZA01135.1 1 83780725 0.1703
PZE0188095678 1 88095678 0.2202
PZB01235.4 1 93909140 0.0007
PZE0194085195 1 94085195 0.3395
PZA02750.3 1 101421637 0.549
NILs were treated with cercosporin to test for DR genes playing a role in disease resistance. Expression was up-regulated 3.4-fold for GRMZM2G425719, a putative flavin-monooxygenase (FMO;Fig. 5). Up-regulation of other DR genes in the regions was not detected. Forty-four polymorphisms within the FMO were identified using HMPv2. Twenty of these polymor-phisms were identified in the promoter region of the gene. G to A substitution was identified using a plant promoter algorithm to detect functional changes between the B73 and CML228 promoter regions. This change led to the detection of a putative functional TATA box within the CML228 allele. No significant difference was detected in carotenoid levels among the treat-ed NILs.
Table 5. Summary statistics for detoxification-related genes underlying qGLS1.04.
Category Genome (count) qGLS1.04 (count) SE z-value p-value
1-deoxy-D-xylulose 5-phosphate synthase 4 2 0.058 -0.229 0.409
Glutathione-s-transferase 573 11 0.031 -2.100 0.018
Oxidoreductase 214 4 0.031 -0.751 0.226
Phytoene synthase 4 4 0.081 -0.328 0.372
Summary statistics for functionally annotated and categorized genes within the qGLS1.04 quantitative trait loci hypothesized as putative detoxifi cation-related genes.
SE = standard error.
doi:10.1371/journal.pgen.1005045.t005
Fig 5. Analysis of flavin-monooxygenase expression at qGLS1.04.Expression differences were detected for the putative flavin-monooxygenase among heterogeneous inbred family lines segregating atqGLS1.04for the B73 or CML228 maize alleles. The heterogenous inbred family lines were treated with cercosporin or the acetone control on either side of the maize leaf midrib. There was a significant difference between the CML228 samples treated with cercosporin and the other samples in the experiment (p= 0.0012).
qGLS2.09
CML333and
qGLS4.05
KI11: fine-mapping
NIL pairs developed to be 99% isogenic were used to confirm and further fine-map
qGLS2.09CML333andqGLS4.05KI11. The fine-mapping population forqGLS2.09CML333had
poor seed set and was susceptible to drought stress. Only 375 plants survived from the 2450 kernels planted for fine-mapping during the 2011 field season. Irrigation needs were more closely monitored in 2012 to ensure higher survival rates (>95%). The GLS QTL interval was reduced from 13 Mb to 4 Mb. This region had a recombination frequency of 0.908 cM/Mb and was predicted to contain 290 protein-coding genes.
qGLS4.05KI11was initially considered an attractive target for fine-mapping because of its
maximum LOD score of 44. The breakpoint density of this centromeric QTL could not be in-creased, however, due to the low recombination frequency of 0.05cM/Mb. This region had an estimated size of 140 Mb and contained as many as 7,500 protein-coding genes.
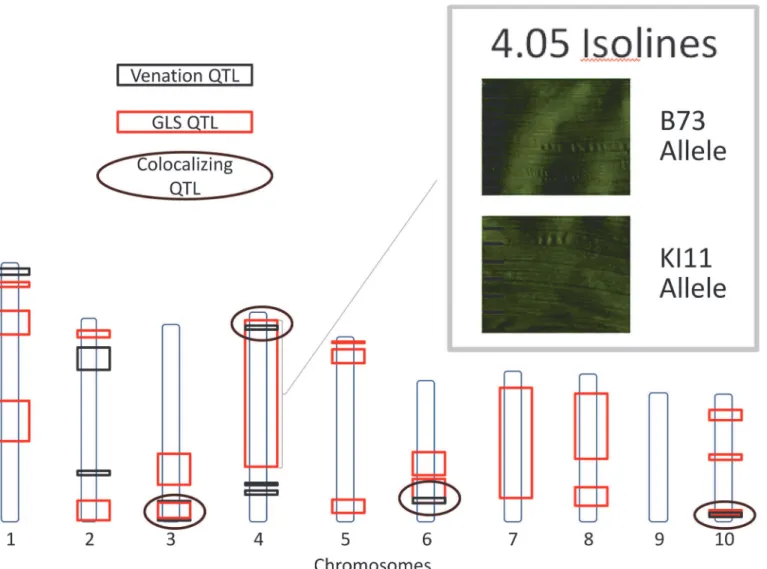
Loci affecting inter-vein distance and conidiophore development
Scanned images of GLS infection on maize leaves were analyzed using image analysis software. The distance between three major and three minor veins was measured for each leaf sample at the widest point of the leaf blade. A significant positive relationship between disease develop-ment (AUDPC) and the distance between major veins (IVD) was detected in the NAM popula-tion (p<0.0001). A significant relationship was not observed between minor vein distance and disease development. The observation that narrow IVD was associated with lower disease levels supported the hypothesis that this morphological trait could influence disease progression [26], and further suggested that QTL for disease and IVD might co-localize. To test this hy-pothesis, loci affecting IVD were analyzed using a model selection approach. Nine markers, lo-cated on six of the 10 chromosomes, were found to be associated with IVD. Similar to the disease QTL, effect sizes for IVD QTL across parental lines varied at each locus, and there were allelic effects significantly above and below the effect of the B73 allele. QTL for IVD and disease development co-localized at four intervals (Fig. 6). One of these QTL co-localized with
qGLS4.05KI11. NILs for this locus were planted in the greenhouse and the average distance
be-tween veins was measured. A significant difference was detected bebe-tween NILs containing the KI11 allele and those containing the B73 allele at the 4.05 locus (p<0.05).
To assess the epidemiological relevance of narrow IVD, lesion parameters and conidiophore counts were collected from 2011 lesion samples. The conidiophore counts and IVDs for NAM parental lines were compared (Fig. 7). IVD accounted for 46% of variation in conidiophore count. A significant positive correlation was detected between IVD and the number of conidio-phores per lesion (p= 2.34x10⁻¹⁴). This correlation suggests that the smaller the distance be-tween the major veins, the lower the conidiophore count. IVD remained significant in a model predicting conidiophore count, with lesion length, lengthIVD and pedigree as additional fixed effects (Table 6). There was a strong relationship between pedigree and IVD, such that IVD be-came less significant in a model with pedigree (p<0.0001). Lesion length and IVD were entered into the model to determine the effect of IVD when conidiophore variation attributed to length was taken into account. In this case, IVD accounted for 41% of the variation for conidiophore count.
Discussion
were not finely resolved due to the low recombination rates in the intervals. McMullen et al. [23] identified heavy segregation distortion on chromosome 4 within the B73 x KI11 family, and found that this region had a significantly greater proportion of B73 alleles than KI11 al-leles. All QTL mapped by Maroof et al. [16] were identified using the NAM strategy. Our study was performed on the same field site over a decade later and, although it appears that the path-ogen population had changed from one with bothCercospora zeae-maydisandC.zeinato one dominated byC.zeae-maydis, similar QTL and presumably similar plant resistance mecha-nisms appear to function.
Evidence was obtained for pleiotropic responses across diseases. Several loci appeared to condition resistance to both GLS and NLB; six of the 16 QTL showing positively correlated al-lelic effects. A locus may condition resistance to one or more diseases while acting as a suscepti-bility factor for another disease. For example, GLS parental allelic effects atqGLS3.06were negatively associated with SLB effects while positively associated with NLB.
Heritability of GLS resistance was high across the NAM population, and the QTL effects were generally large. Similar heritability estimates have been reported for other foliar diseases Fig 6. Gray leaf spot (GLS) and venation quantitative trait loci.Quantitative trait loci for GLS and inter-vein distance (IVD) are indicated. Circles designate co-localizing areas. Scanned leaf images (upper-right corner) demonstrate the difference between IVD from maize leaves with B73 and KI11 alleles at
qGLS4.05.
scored across the NAM population [40,46], despite differences in disease and rating methodol-ogy. For the three loci tested both in the NAM and in NILs, the estimated allelic effects were much larger based on NILs. The BLUPs of disease index ratings reduced the estimated vari-ance, and allelic effect estimates were further deflated when maturity was taken into account. There were fewer QTL with larger effect estimates for GLS than for NLB and SLB, although each of these diseases was scored in the one location across three sequential field seasons. This may reflect the more recent emergence of GLS; it is possible that the pathogen population has Fig 7. Relationship between conidiophore count and intervein distance.Significant relationship was detected between inter-vein distance and square root (sqrt) of the conidiophore counts (r2= 0.43;p<0.0001).
doi:10.1371/journal.pgen.1005045.g007
Table 6. Model results with conidiophore count (square root) as the response variable and lesion parameter predictors.
Model Source DF Sum of Squares F Ratio Prob>F SS/TSS
1 Pedigree 21 964 6 2.03x10⁻⁹ 0.5906
1 Length 1 566 73 5.83x10⁻¹³ 0.3467
1 IVD 1 47 6 0.0159 0.0287
1 Length*IVD 1 55 7 0.0089 0.0340
2 Length 1 929 57 1.70x10⁻¹¹ 0.5898
2 IVD 1 646 40 7.16x10⁻⁹ 0.4102
IVD = intervein distance DF = degrees of freedom Prob = probability SS = sum of squares TSS = total sum of squares.
had less time to co-evolve to partially overcome the resistance QTL compared to NLB and SLB. Similarly, the shorter time since emergence of the disease may mean that breeders have had less opportunity to accumulate minor resistance factors in maize germplasm.
In the NAM analyses of SLB and NLB, no interactions among disease QTL were detected [40,46]. Here we report interactions involving loci not directly contributing to resistance. In other systems, interactions have been reported to exist among functionally similar genes, often those that act in the same pathway [47] and can be elucidated using RNA interference method-ologies [48], among others. Without further fine mapping, there were too many genes underly-ing the interactunderly-ing loci to allow us to speculate on the pathways involved.
This study revealed a relationship between leaf structure (the distance between major veins) and GLS disease development. The 4.05 locus had pleiotropic effects on both disease and IVD. There was a positive correlation between IVD and disease development, suggesting that IVD-based lesion restriction may serve as a host resistance mechanism. Tropical germplasm tended to have greater IVD than temperate germplasm among the inbreds observed. These findings suggest that a lesion on an inbred with narrow veins produces fewer conidiophores than a le-sion on an inbred with wide veins, resulting in reduced production of inoculum. The effect of reduced conidiophore production would be compounded across multiple reproductive cycles within one season, becauseCercospora zeae-maydisis a polycyclic pathogen. Shorter IVD may decrease fungal reproduction via reduced lesion size (lower area available for fungal nourish-ment) and may also have indirect effects on fungal development via other morphological traits such as stomatal density (this could influence conidial production). A leaf width QTL identified in bin 4.05 [49] co-localized with GLS and venation QTL found in this study. Correlated effects of IVD and leaf width might influence yield through effects on photosynthetic capacity and/or harvest index. The pleiotropic effects of morphological phenotypes influencing disease and other traits merit greater investigation.
qGLS1.04, which was identified for the first time in this study, was validated and
fine-mapped. Fine-mapping this locus provides breeders with markers that are closely linked to gene(s) conditioning the disease resistance phenotype. The novel QTL interval was fine-mapped from an initial interval of 27.0 Mb to two intervals of 6.5 Mb and 5.2 Mb, suggesting that multiple genes may underlie original QTL identified by NAM. Similar QTL fractionation has been identified in other quantitative disease resistance studies [50–52]. Increased marker density may help resolve one QTL into two (or more) if there is sufficient recombination in the region among the NAM founders.
Our findings lend preliminary support to the hypothesis that genes underlying quantitative disease resistance are involved in mitigating the effects of microbial compounds deployed dur-ing the pathogenesis process [26]. Other studies have implicated genes related to detoxification of microbial compounds in resistance to GLS. In a multivariate analysis of resistance to GLS, NLB and SLB, Wisser et al. [58] identified a significant association across all three diseases with a glutathione-S-transferase. This gene lies within the confidence interval ofqGLS7.03and is considered responsible for reducing oxidative stress and detoxification of microbial com-pounds. The development of aqGLS1.04FMO mutant for disease resistance studies would pro-vide more epro-vidence needed to validate the findings. Multiple genes are likely to be involved in conferring resistance atqGLS1.04, because there are multiple fine-mapping intervals underly-ing resistance at this locus.
The results of this study provide a more thorough and higher-resolution understanding of the genetic architecture of GLS resistance and provide initial support for the hypothesis that structural and detoxification mechanisms underlie quantitative resistance to GLS of maize. Plant breeding decisions regarding development and deployment of resistance will be im-proved with better understanding of the mechanisms underlying quantitative disease resis-tance, especially as the mechanisms relate to important agronomic traits such as leaf anatomy and days to maturity.
Materials and Methods
Plant materials and field site
The NAM population was developed by the Maize Diversity Project as a public resource (www. panzea.org) [23]. The NAM population consists of 25 recombinant inbred line (RIL) families derived from crossing each of 25 diverse maize lines with a single reference parent (B73) [23]. The majority of the NAM population (3,678 lines) was planted at Virginia Polytechnic Insti-tute’s Whitethorne Research Farm located in Blacksburg, VA. In addition, 150 lines of the Intermated B73 x Mo17 population (IBM) were included. Line selection was based on seed availability and predicted experimental power [59]. Three replications of the populations were planted in 2008, 2009 and 2010 (one replication/year). Sixteen kernels were planted in 2.4-m long rows with 0.3-m row spacing for each line. The population was arranged in an incomplete block design, augmented by blocks that contained two parental checks. The blocks were ar-ranged by families within the NAM.
The Whitethorne Research Farm was chosen for high and consistent disease pressure that is routinely observed from natural inoculum. Maize had been continuously planted in the field under no-till conditions since 1985. The field had been manually inoculated for three seasons (1985, 1986, and 1987) prior to dependence on natural inoculum. The isolates originally used to inoculate the field (VA-1, VA-2 and VA-3) were collected from maize fields located in Montgomery County and Wythe County, Virginia, in 1985. These isolates were initially identi-fied as onlyCercospora zeae-maydis, but were later found to be a mixture ofC.zeae-maydisI
andC.zeae-maydisII.C.zeae-maydisII has subsequently been reclassified asC.zeina[4].
distinguishing the two species [60]. The majority of samples (90–95%) were identified asC.
zeae-maydis.
Phenotypic assessment
A disease rating methodology was modified to include increments of 0.25 on a 0–5 scale [16]. Using this 21-point scale, each line was scored three times at seven-day intervals. Ratings were made after flowering time (dehiscence) for most lines (S2 Table,S1 Dataset). Area under the disease progress curve (AUDPC) was calculated from the resulting disease scores for each line. Days to anthesis (DTA) data, defined as days from planting to anthesis of 50% of row plants, were also collected (S2 Dataset).
Scanned images of GLS infection on maize leaves were collected in 2009 and 2010. Ear leaves were sampled from each RIL three times at 10-d intervals. These leaves were collected after flowering time, when the GLS symptoms began to develop. Leaves were transferred to the lab on the day of sampling, mounted on a white sheet of paper, and scanned with the corre-sponding identification. We developed digital image analysis software to analyze scanned leaf images. The software measured the distance between three major and three minor veins on each leaf sample, and the values were averaged for each NAM line. Venation structure was measured at the widest part of the leaf right above the midrib, because leaves within the popu-lation varied in size and shape (S3 Table,S3 Dataset). The software also measured the dimen-sions of each lesion and the number of ledimen-sions within a defined area.
Lesion samples were collected in 2011 from the parents of the NAM population to assess sporulation in relation to lesion size. Samples were boiled in 1 M KOH and then rinsed with fresh, sterile, autoclaved water. The rinse was repeated several times over a two week period, re-sulting in cleared leaf samples that were devoid of chlorophyll and other pigments. Each sam-ple was then mounted on a slide and examined under a light microscope. Conidiophores within the lesions were counted using a manual counter and the computer-projected image (S4 Table). Distance between the major veins was measured using a standard metric ruler.
Analysis
Best linear unbiased predictions (BLUPs) of the GLS disease scores were acquired using ASReml3 statistical software as described by Poland et al. [40]. BLUPs extracted from this model were used to calculate AUDPC, which was used as the response variable in the PROC GLMSELECT stepwise selection procedure in SAS 9.3 (SAS Institute Inc., Cary, NC). Covari-ates included family and DTA. Common-parent-specific markers (n= 1,106) were also used as predictor variables with a selection threshold (p= 1 x 10⁻⁴). QTL mapping was undertaken using a general linear modeling approach with PROC GLM in SAS 9.3 (SAS Institute Inc., Cary, NC).
narrow sense heritability. Confidence intervals were identified by removing one marker at a time from the full linear model and inserting the associated flanking markers individually until the flanking markers failed to significantly describe the response variable atp<0.0001 [40]. QTL-QTL interactions and interactions between QTL-associated markers and non-significant markers were included in the GLM to identify significant interactions (p<0.00001). Pleiotropic loci and alleles affecting both flowering time and disease development were identified by substituting DTA for AUDPC as the response variable in the GLM described above.
Residuals for each chromosome were extracted from the GLM by removing physically linked markers, one linkage group at a time, from the model (S4 Dataset). These residuals were submitted to NAM-Genome Wide Association Study (NAM-GWAS) at BioHPC for genome-wide single nucleotide polymorphisms (SNP) association using the bootstrap regression analy-sis option [49]. Significant GWAS hits were functionally annotated using basic local alignment search tool (BLAST). The sequence of each gene associated with a significant GWAS hit was pulled from the maize B73 reference genome (V2). The gene sequences were then populated in the gene ontology BLAST search and run using the default settings of 0.1 Expect threshold, 50 Max # alignments and“all”selected for gene product types, data sources, species, ontology and evidence code (AmiGO 1.8;http://amigo1.geneontology.org/cgi-bin/amigo/blast.cgi?). These annotations were categorized into biological groups, which included: structural components, secondary metabolites, primary metabolites, genes previously implicated in pathogen defense, membrane transporter, development, cellular energy, cell signaling, and cell cycle. The genes on the inter-pro hit list (www.maizesequence.org) were also categorized into the same groups. A proportion z-test was used to test the abundance of genes in a given category relative to the overall abundance predicted in the maize genome.
Heterogenous inbred family development, QTL confirmation &
fine-mapping
Specific RILs composing the NAM were selected for heterogenous inbred family (HIF) devel-opment [44]. Forty-three lines met the criteria of segregating at one of three QTL and being fixed at all other significant QTL. The three QTL of interest were those that corresponded to the three markers that most significantly described GLS AUDPC. These lines were selected from six subpopulations of the NAM based on the predicted effect of the allele at the specific locus on disease development. The derived lines contrasting for each QTL are hereafter re-ferred to as near isogenic lines (NILs).
The selected lines were selfed and then genotyped in 2009 at Cornell University’s Musgrave Research Farm in Aurora, NY. Heterozygous plants at the loci of interest were selfed in 2010 winter nursery. Fixed lines were selected for random placement in one of six pedigree-based Latin square designs on Whitethorne Farm in summer 2010. These lines were genotyped and scored using the disease rating methodology described above. Lines within the same HIF were analyzed for significant phenotype and genotype association at loci of interest. Heterozygous lines in the region implicated in disease resistance were again advanced in a winter field season, genotyped and planted in an incomplete block design that included both heterozygous and fixed lines in the 2011 and 2012 field seasons. A total of 1,750 and 6,175 plants were screened and genotyped in the 2011 and 2012 field seasons, respectively, in order to increase statistical power and to increase the likelihood of identifying an advantageous recombination breakpoint.
genotypes flanking the segregating regions. The experimental units were analyzed using PROC GLM in SAS 9.3 (SAS Institute Inc., Cary, NC). Disease development (AUDPC) was the re-sponse variable and predictors were the genotypes within the QTL confidence or fine-mapping interval. False discovery rate (FDR) was calculated independently for each year based on the number of markers analyzed and used as a threshold for significant associations between the disease phenotypes and marker genotypes.
Venation confirmation at the 4.05 locus
One of the venation QTL co-localized withqGLS4.05KI11and with a fine-mapping population al-ready developed for this locus, the NILs were planted in the greenhouse to measure average dis-tance between veins. The experiment was set up in a complete randomized block with 10 replications of 7 HIF lines. The plants were grown to just beyond the R1stage when all lines had reached the point of anthesis. As with the scanning protocol described above, leaves were trans-ferred to the lab on the day of sampling, mounted on a white sheet of paper, and scanned with the corresponding identification. The software measured the distance between three major and three minor veins and the values were averaged for each NAM line. Venation structure was mea-sured at the widest part of the leaf right above the midrib, because leaves within the population varied in size and shape. A t-test was used to detect a significant difference between the isolines.
Functional annotation of NAM-GWAS and genes within the fine-mapping
interval
A list of genes within theqGLS1.04fine-mapping intervals (1:77,242,690 to 1:83,780,725 Mb and 1:88,849,284 to 1:94,085,195 Mb) was exported from the maize genome browser (www. maizesequence.org). These genes were functionally annotated using BLAST and compared to the maize top 500 inter-pro hit list. An initial inspection indicated that the region was rich in detoxification-related genes. The z-test is used to determine if the hypothesized population proportion is significantly different from the sampled proportions and as such, it was used to evaluate the genome abundance of detoxification-related (DR) genes compared to the observed sample differences. Specific gene families identified by sequence inspection were tested for en-richment using the z-test.
Cercosporin treatment of 1.04 isolines
Twenty-four near isogenic lines (F6:8NILs) developed using the HIF strategy were grown in the greenhouse under standard maize growing conditions. Lines were organized in a random-ized complete block design (4 blocks). Three of the six plants in each block contained the sus-ceptible B73 allele, and the other three contained the resistant CML228 allele. Different lines in the same HIF family were used to account for residual background effect resulting from regions that may still have been segregating (estimated at less than 0.5%).
At flowering time, two ear leaves on each plant were treated with 0.1 ml of 100μM
cercos-porin in acetone and an acetone control using a procedure modified from Batchvarova et al. [61]. Treatment and control were infiltrated using a needleless syringe. The control and cercosporin treatments were applied to the same leaf on either side of the midrib. Plants were placed in con-stant light for 24 h in order to activate the cercosporin. After this time period, 10 leaf punches of 6-mm diameter were collected directly around each treated site using a paper punch (2 controls and 2 treatments per plant). Samples collected from the lower ear leaf were used for carotenoid detection and samples from the upper ear leaf were used for expression analysis.
of pre-weighed tissue was homogenized with 50μl of a 0.3% MgCO3solution (w:v) and 300μl
of tetrahydrofuran (THF). Homogenization was repeated after addition of 300μl of 0.5%
butyl-ated hydroxyl-toluene/methanol (w:v). An additional 600μl of THF was added to the extract,
which was then filtered. To the filtered extract, 50μl of 25% NaCl and 600μl of petroleum
ether were added and the sample was vortexed well. The upper phase was dried down and 500μL HPLC grade ethyl acetate was added in preparation for the column; this was mixed well
and filtered. A sample of the extract was added to a YMC C30column for reverse-phase high
performance liquid chromatography (RP-HPLC).
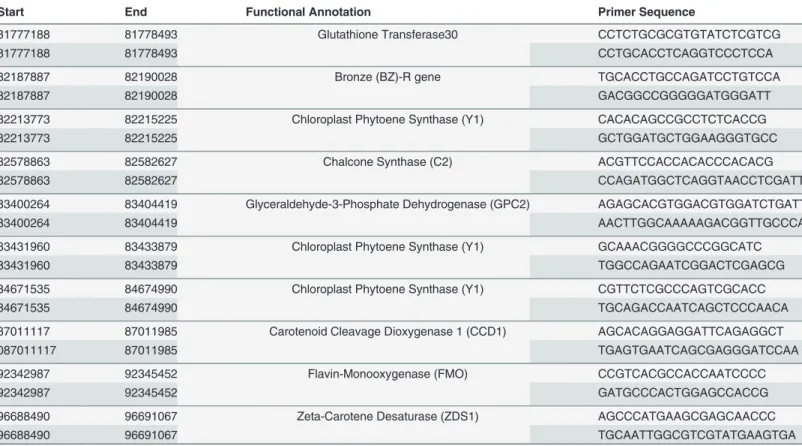
Real-time quantitative PCR (qRT-PCR) was performed on cercosporin- and control-treated HIFs to test for expression differences across genes hypothesized to play a role in cercosporin detoxification. Total RNA was purified from maize leaf tissue using the RNEasy Mini Kit (Qia-gen). The same kit was used for DNase I digestion. The cDNA was prepared using the Super-Script III First-Strand Synthesis SuperMix for qRT-PCR (Invitrogen). Primer pairs were designed for candidate detoxification-related genes (Table 7) and used for RT-PCR with Power SYBR Green PCR Master Mix (Invitrogen). Data were analyzed using the Comparative CT method [62] (S7 Table).
Flavin-monooxygenase single nucleotide polymorphisms
SNPs between B73 and CML228 within the putative flavin-monooxygenase gene were identi-fied using maize Haplotype Map Version 2 (HMPv2;www.panzea.org). The B73 and CML228
Table 7. Primer sequences used for qGLS1.04CML228expression tests.
Start End Functional Annotation Primer Sequence
81777188 81778493 Glutathione Transferase30 CCTCTGCGCGTGTATCTCGTCG
81777188 81778493 CCTGCACCTCAGGTCCCTCCA
82187887 82190028 Bronze (BZ)-R gene TGCACCTGCCAGATCCTGTCCA
82187887 82190028 GACGGCCGGGGGATGGGATT
82213773 82215225 Chloroplast Phytoene Synthase (Y1) CACACAGCCGCCTCTCACCG
82213773 82215225 GCTGGATGCTGGAAGGGTGCC
82578863 82582627 Chalcone Synthase (C2) ACGTTCCACCACACCCACACG
82578863 82582627 CCAGATGGCTCAGGTAACCTCGATT
83400264 83404419 Glyceraldehyde-3-Phosphate Dehydrogenase (GPC2) AGAGCACGTGGACGTGGATCTGATT
83400264 83404419 AACTTGGCAAAAAGACGGTTGCCCA
83431960 83433879 Chloroplast Phytoene Synthase (Y1) GCAAACGGGGCCCGGCATC
83431960 83433879 TGGCCAGAATCGGACTCGAGCG
84671535 84674990 Chloroplast Phytoene Synthase (Y1) CGTTCTCGCCCAGTCGCACC
84671535 84674990 TGCAGACCAATCAGCTCCCAACA
87011117 87011985 Carotenoid Cleavage Dioxygenase 1 (CCD1) AGCACAGGAGGATTCAGAGGCT
087011117 87011985 TGAGTGAATCAGCGAGGGATCCAA
92342987 92345452 Flavin-Monooxygenase (FMO) CCGTCACGCCACCAATCCCC
92342987 92345452 GATGCCCACTGGAGCCACCG
96688490 96691067 Zeta-Carotene Desaturase (ZDS1) AGCCCATGAAGCGAGCAACCC
96688490 96691067 TGCAATTGGCGTCGTATGAAGTGA
List of gene locations on chromosome one and primer sequences used for expression tests on heterogeneous inbred family lines treated with cercosporin.
gene sequences were developed by aligning SNP calls with the sequence provided by the Maize Genome Sequence Consortium. The B73 SNP calls from HMPv2 matched the B73 reference genome. The promoter region sequence for the B73 and CML228 alleles was analyzed using plant promoter prediction software (Prediction of PLANT Promoters using RegSite Plant DB, Softberry Inc.) to detect putative functional differences in the promoter region between the parental lines.
Supporting Information
S1 Table. Genome wide association hits for resistance to gray leaf spot.Functionally anno-tated genome wide association hits. A 10 Kilobase window on either side of the GWA hit was screened for genes. Chr = Chromosome; BPP = Bootstrap posterior probability.
(DOCX)
S2 Table. Raw gray leaf spot data collected on the nested association mapping population. (XLSX)
S3 Table. Raw venation data collected on nested association mapping population. (XLSX)
S4 Table. Inter-vein distance and associated conidiophore count for nested association mapping parental line leaf tissue samples.
(XLSX)
S5 Table. Quantitative trait loci effect estimates for days to anthesis, venation, northern leaf blight and southern leaf blight.
(XLSX)
S6 Table. Model predictions for the percent change in disease across parental alleles at each significant locus.
(XLSX)
S7 Table. Expression data for putative flavin-monooxygenase for near isogenic lines treated with cercosporin.
(XLSX)
S1 Dataset. Best linear unbiased predictors for gray leaf spot, northern leaf blight and southern leaf blight.
(TXT)
S2 Dataset. Best linear unbiased predictors for days to anthesis at the Blacksburg, VA loca-tion.
(TXT)
S3 Dataset. Best linear unbiased predictors for venation. (TXT)
S4 Dataset. Gray leaf spot residuals used in the genome wide nested association analysis. (TXT)
Acknowledgments
resources and assistance with GWAS analysis. We thank three anonymous reviewers for their thoughtful input and inquiries. We are grateful to Keenan McRoberts for his editorial input.
Author Contributions
Conceived and designed the experiments: JMB JAP RJN. Performed the experiments: JMB. An-alyzed the data: JMB. Contributed reagents/materials/analysis tools: ELS BMB RJN. Wrote the paper: JMB RJN.
References
1. Wen L (2013) Cell death in plant immune response to necrotrophs. J Plant Biochem Physiol 1: 1–3. 2. Lai Z, Wang F, Zheng Z, Fan B, Chen Z (2011) A critical role of autophagy in plant resistance to
necro-trophic fungal pathogens. Plant J 66: 953–968. doi:10.1111/j.1365-313X.2011.04553.xPMID:
21395886
3. Sivasithamparam K, Barbetti MJ, Li H (2005) Recurring challenges from a necrotrophic fungal plant pathogen: a case study withLeptosphaeria maculans(causal agent of blackleg disease in Brassicas) in Western Australia. Ann Bot 96: 363–377. PMID:15994842
4. Crous PW, Groenewald JZ, Groenewald M, Caldwell P, Braun U, et al. (2006) Species of Cercospora associated with grey leaf spot of maize. Stud Mycol: 189–197.
5. Tehon L, Daniels E (1925) Notes on parasitic fungi of Illinois. Mycologia 71: 240–249.
6. Glazebrook J (2005) Contrasting mechanisms of defense against biotrophic and necrotrophic patho-gens. Annu Rev Phytopathol 43: 205–227. PMID:16078883
7. Ward JMJ, Stromberg EL, Nowell DC, Nutter FW (1999) Gray leaf spot—A disease of global
impor-tance in maize production. Plant Dis 83: 884–895.
8. Latterell FM, Rossi AE (1983) Gray leaf spot of corn: A disease on the move. Plant Dis 67.
9. Ngoko Z, Cardwell KF, Marasas WFO, Wingfield MJ, Ndemah R, et al. (2002) Biological and physical constraints on maize production in the Humid Forest and Western Highlands of Cameroon. Eur J Plant Pathol 108: 893–902.
10. Balint-Kurti PJ, Wisser R, Zwonitzer JC (2008) Use of an advanced intercross line population for pre-cise mapping of quantitative trait loci for gray leaf spot resistance in maize. Crop Sci 48: 1696–1704. 11. Bubeck DM, Goodman MM, Beavis WD, Grant D (1993) Quantitative trait loci controlling resistance to
gray leaf spot in maize. Crop Sci 33: 838–847.
12. Clements MJ, Dudley JW, White DG (2000) Quantitative trait loci associated with resistance to gray leaf spot of corn. Phytopathology 90: 1018–1025. doi:10.1094/PHYTO.2000.90.9.1018PMID:
18944528
13. Danson J, Lagat M, Kimani M, Kuria A (2008) Quantitative trait loci (QTLs) for resistance to gray leaf spot and common rust diseases of maize. Afr J Biotechnol 7: 3247–3254.
14. Juliatti FC, Pedrosa MG, Silva HD, da Silva JVC (2009) Genetic mapping for resistance to gray leaf spot in maize. Euphytica 169: 227–238.
15. Lehmensiek A, Esterhuizen AM, van Staden D, Nelson SW, Retief AE (2001) Genetic mapping of gray leaf spot (GLS) resistance genes in maize. Theor Appl Genet 103: 797–803.
16. Maroof MAS, Yue YG, Xiang ZX, Stromberg EL, Rufener GK (1996) Identification of quantitative trait loci controlling resistance to gray leaf spot disease in maize. Theor Appl Genet 93: 539–546. doi:10.
1007/BF00417945PMID:24162345
17. Pozar G, Butruille D, Silva HD, McCuddin ZP, Penna JCV (2009) Mapping and validation of quantitative trait loci for resistance toCercospora zeae-maydisinfection in tropical maize (Zea maysL.). Theor Appl Genet 118: 553–564. doi:10.1007/s00122-008-0920-2PMID:18989654
18. Gordon SG, Bartsch M, Matthies I, Gevers HO, Lipps PE, et al. (2004) Linkage of molecular markers to
Cercospora zeae-maydisresistance in maize. Crop Sci 44: 628–636.
19. Zhang Y, Xu L, Fan X, Tan J, Chen W, et al. (2012) QTL mapping of resistance to gray leaf spot in maize. Theor Appl Genet: 1–12.
21. Chung CL, Poland J, Kump K, Benson J, Longfellow J, et al. (2011) Targeted discovery of quantitative trait loci for resistance to northern leaf blight and other diseases of maize. Theor Appl Genet 123: 307–
326. doi:10.1007/s00122-011-1585-9PMID:21526397
22. Zwonitzer JC, Coles ND, Krakowsky MD, Arellano C, Holland JB, et al. (2010) Mapping resistance quantitative trait Loci for three foliar diseases in a maize recombinant inbred line population-evidence for multiple disease resistance? Phytopathology 100: 72–79. doi:10.1094/PHYTO-100-1-0072PMID:
19968551
23. McMullen MD, Kresovich S, Villeda HS, Bradbury P, Li H, et al. (2009) Genetic properties of the maize nested association mapping population. Science 325: 737–740. doi:10.1126/science.1174320PMID:
19661427
24. Berger R (1977) Application of epidemiological principles to achieve plant disease control. Annu Rev Phytopathol 15: 165–181.
25. Chung CL, Longfellow JM, Walsh EK, Kerdieh Z, Van Esbroeck G, et al. (2010) Resistance loci affect-ing distinct stages of fungal pathogenesis: use of introgression lines for QTL mappaffect-ing and characteriza-tion in the maize-Setosphaeria turcica pathosystem. BMC plant biology 10: 103. doi: 10.1186/1471-2229-10-103PMID:20529319
26. Poland JA, Balint-Kurti PJ, Wisser RJ, Pratt RC, Nelson RJ (2009) Shades of gray: the world of quanti-tative disease resistance. Trends Plant Sci 14: 21–29. doi:10.1016/j.tplants.2008.10.006PMID:
19062327
27. Fu D, Uauy C, Distelfeld A, Blechl A, Epstein L, et al. (2009) A kinase-START gene confers tempera-ture-dependent resistance to wheat stripe rust. Science 323: 1357–1360. doi:10.1126/science.
1166289PMID:19228999
28. Fukuoka S, Saka N, Koga H, Ono K, Shimizu T, et al. (2009) Loss of function of a proline-containing protein confers durable disease resistance in rice. Science 325: 998–1001. doi:10.1126/science.
1175550PMID:19696351
29. Krattinger SG, Lagudah ES, Spielmeyer W, Singh RP, Huerta-Espino J, et al. (2009) A putative ABC transporter confers durable resistance to multiple fungal pathogens in wheat. Science 323: 1360–
1363. doi:10.1126/science.1166453PMID:19229000
30. Manosalva PM, Davidson RM, Liu B, Zhu X, Hulbert SH, et al. (2009) A germin-like protein gene family functions as a complex quantitative trait locus conferring broad-spectrum disease resistance in rice. Plant Physiol 149: 286–296. doi:10.1104/pp.108.128348PMID:19011003
31. Cook DE, Lee TG, Guo X, Melito S, Wang K, et al. (2012) Copy number variation of multiple genes at
Rhg1mediates nematode resistance in soybean. Science 338: 1206–1209. doi:10.1126/science.
1228746PMID:23065905
32. St. Clair DA(2010) Quantitative disease resistance and quantitative resistance loci in breeding. Annu Rev Phytopathol 48: 247–268. doi:10.1146/annurev-phyto-080508-081904PMID:19400646 33. Kimura M, Anzai H, Yamaguchi I (2001) Microbial toxins in plant-pathogen interactions: Biosynthesis,
resistance mechanisms, and significance. J Gen Appl Microbiol 47: 149–160. PMID:12483615 34. Daub M (1982) Cercosporin, a photosensitizing toxin fromCercosporaspecies. Phytopathology 72:
370–374.
35. Ramel F, Birtic S, Cuiné S, Triantaphylidès C, Ravanat JL, et al. (2012) Chemical quenching of singlet oxygen by carotenoids in plants. Plant Physiol 158: 1267–1278. doi:10.1104/pp.111.182394PMID:
22234998
36. Daub ME, Payne GA (1989) The role of carotenoids in resistance of fungi to cercosporin. Phytopatholo-gy 79: 180–185.
37. Daub ME, Leisman GB, Clark RA, Bowden EF (1992) Reductive detoxification as a mechanism of fun-gal resistance to singlet oxygen-generating photosensitizers. Proc Natl Acad Sci 89: 9588–9592.
PMID:1409670
38. Daub ME (1987) The fungal photosensitizer cercosporin and its role in plant disease. In: Heitz JR, Downum KR, editors. Light-activated pesticides. Washington, DC: ACS Symposium Series, American Chemical Society. pp. 271–280.
39. Ververidis P, Davrazou F, Diallinas G, Georgakopoulos D, Kanellis A, et al. (2001) A novel putative re-ductase (Cpd1p) and the multidrug exporter Snq2p are involved in resistance to cercosporin and other singlet oxygen-generating photosensitizers inSaccharomyces cerevisiae. Curr Genet 39: 127–136.
PMID:11409174
41. Wisser RJ, Balint-Kurti PJ, Nelson RJ (2006) The genetic architecture of disease resistance in maize: a synthesis of published studies. Phytopathology 96: 120–129. doi:10.1094/PHYTO-96-0120PMID:
18943914
42. Berger R, Filho AB, Amorim L (1997) Lesion expansion as an epidemic component. Phytopathology 87: 1005–1013. doi:10.1094/PHYTO.1997.87.10.1005PMID:18945033
43. Hung H, Browne C, Guill K, Coles N, Eller M, et al. (2012) The relationship between parental genetic or phenotypic divergence and progeny variation in the maize nested association mapping population. He-redity 108: 490–499. doi:10.1038/hdy.2011.103PMID:22027895
44. Tuinstra M, Ejeta G, Goldsbrough P (1997) Heterogeneous inbred family (HIF) analysis: a method for developing near-isogenic lines that differ at quantitative trait loci. Theor Appl Genet 95: 1005–1011. 45. Buckler ES, Holland JB, Bradbury PJ, Acharya CB, Brown PJ, et al. (2009) The genetic architecture of
maize flowering time. Science 325: 714–718. doi:10.1126/science.1174276PMID:19661422 46. Kump KL, Bradbury PJ, Wisser RJ, Buckler ES, Belcher AR, et al. (2011) Genome-wide association
study of quantitative resistance to southern leaf blight in the maize nested association mapping popula-tion. Nature Genet 43: 163–168. doi:10.1038/ng.747PMID:21217757
47. Tong AHY, Lesage G, Bader GD, Ding H, Xu H, et al. (2004) Global mapping of the yeast genetic inter-action network. Sci STKE 303: 808. PMID:14764870
48. Byrne AB, Weirauch MT, Wong V, Koeva M, Dixon SJ, et al. (2007) A global analysis of genetic interac-tions inCaenorhabditis elegans. J Biol 6. doi:10.1186/jbiol60PMID:18177504
49. Tian F, Bradbury PJ, Brown PJ, Hung H, Sun Q, et al. (2011) Genome-wide association study of leaf ar-chitecture in the maize nested association mapping population. Nature Genet 43: 159–162. doi:10.
1038/ng.746PMID:21217756
50. Studer AJ, Doebley JF (2011) Do large effect QTL fractionate? A case study at the maize domestication QTL teosinte branched1. Genetics 188: 673–681. doi:10.1534/genetics.111.126508PMID:21515578 51. Johnson EB, Haggard JE, Clair DAS (2012) Fractionation, stability, and isolate-specificity of QTL for
re-sistance toPhytophthora infestansin cultivated tomato (Solanum lycopersicum). G3 (Bethesda) 2: 1145–1159. doi:10.1534/g3.112.003459PMID:23050225
52. Jamann TM, Poland JA, Kolkman JM, Smith LG, Nelson RJ (2014) Unraveling genomic complexity at a quantitative disease resistance locus in maize. Genetics: In press.
53. Hansen BG, Kliebenstein DJ, Halkier BA (2007) Identification of a Flavin-monooxygenase as the S-ox-ygenating enzyme in aliphatic glucosinolate biosynthesis in Arabidopsis. Plant J 50: 902–910. PMID:
17461789
54. Li J, Hansen BG, Ober JA, Kliebenstein DJ, Halkier BA (2008) Subclade of flavmonooxygenases in-volved in aliphatic glucosinolate biosynthesis. Plant Physiol 148: 1721–1733. doi:10.1104/pp.108.
125757PMID:18799661
55. Mithen R (1992) Leaf glucosinolate profiles and their relationship to pest and disease resistance in oil-seed rape. Euphytica 63: 71–83.
56. Mishina TE, Zeier J (2006) The Arabidopsis flavin-dependent monooxygenase FMO1 is an essential component of biologically induced systemic acquired resistance. Plant Physiol 141: 1666–1675.
PMID:16778014
57. Taylor TV, Mitchell TK, Daub ME (2006) An oxidoreductase is involved in cercosporin degradation by the bacteriumXanthomonas campestrispv.zinniae. Appl Environ Microbiol 72: 6070–6078. PMID:
16957231
58. Wisser RJ, Kolkman JM, Patzoldt ME, Holland JB, Yu J, et al. (2011) Multivariate analysis of maize dis-ease resistances suggests a pleiotropic genetic basis and implicates a GST gene. Proc Natl Acad Sci 108: 7339–7344. doi:10.1073/pnas.1011739108PMID:21490302
59. Yu J, Holland JB, McMullen MD, Buckler ES (2008) Genetic design and statistical power of nested as-sociation mapping in maize. Genetics 178: 539–551. doi:10.1534/genetics.107.074245PMID:
18202393
60. Hsieh L-S (2011) Coexistence of sibling species ofCercosporacausing gray leaf spot on maize in southern New York State [Master's]. Ithaca, NY: Cornell University. 90 p.
61. Batchvarova R, Reddy V, Bennett J (1992) Cellular resistance in rice to cercosporin, a toxin of Cercos-pora. Phytopathology 82: 642–646.
62. Schmittgen TD, Livak KJ (2008) Analyzing real-time PCR data by the comparative CT method. Nat Pro-toc 3: 1101–1108. PMID:18546601