Quantitative Proteomics Analysis of the
Hepatitis C Virus Replicon High-Permissive
and Low-Permissive Cell Lines
Fei Ye1☯, Zhongshuai Xin2☯, Wei Han1, Jingjing Fan4, Bin Yin1, Shuzhen Wu3, Wei Yang4,
Jiangang Yuan1, Boqin Qiang1, Wei Sun3*, Xiaozhong Peng1*
1The State Key Laboratory of Medical Molecular Biology, Department of Molecular Biology and
Biochemistry, Institute of Basic Medical Sciences, Chinese Academy of Medical Sciences and Peking Union Medical College, Beijing, China,2Division of Hormone, National Institute for Food and Drug Control, Beijing, China,3Core facility of instrument, Institute of Basic Medical Sciences, Chinese Academy of Medical Sciences and Peking Union Medical College, Beijing, China,4MOH Key Laboratory of Systems Biology of Pathogens, Institute of Pathogen Biology, Chinese Academy of Medical Sciences and Peking Union Medical College, Beijing, China
☯These authors contributed equally to this work.
*[email protected](XP);[email protected](WS)
Abstract
Chronic hepatitis C virus (HCV) infection is one of the leading causes of severe hepatitis. The molecular mechanisms underlying HCV replication and pathogenesis remain unclear. The development of the subgenome replicon model system significantly enhanced study of HCV. However, the permissiveness of the HCV subgenome replicon greatly differs among different hepatoma cell lines. Proteomic analysis of different permissive cell lines might pro-vide new clues in understanding HCV replication. In this study, to detect potential candi-dates that might account for the differences in HCV replication. Label-free and iTRAQ labeling were used to analyze the differentially expressed protein profiles between
Huh7.5.1 wt and HepG2 cells. A total of 4919 proteins were quantified in which 114 proteins were commonly identified as differentially expressed by both quantitative methods. A total of 37 differential proteins were validated by qRT-PCR. The differential expression of Gluta-thione S-transferase P (GSTP1), Ubiquitin carboxyl-terminal hydrolase isozyme L1 (UCHL1), carboxylesterase 1 (CES1), vimentin, Proteasome activator complex subunit1 (PSME1), and Cathepsin B (CTSB) were verified by western blot. And over-expression of CTSB or knock-down of vimentin induced significant changes to HCV RNA levels. Addition-ally, we demonstrated that CTSB was able to inhibit HCV replication and viral protein trans-lation. These results highlight the potential role of CTSB and vimentin in virus replication.
Introduction
Hepatitis C virus (HCV) is a positive-stranded RNA virus that causes acute and chronic hepati-tis. A striking feature of HCV infection is the high risk of contracting liver diseases in
OPEN ACCESS
Citation:Ye F, Xin Z, Han W, Fan J, Yin B, Wu S, et al. (2015) Quantitative Proteomics Analysis of the Hepatitis C Virus Replicon High-Permissive and Low-Permissive Cell Lines. PLoS ONE 10(11): e0142082. doi:10.1371/journal.pone.0142082
Editor:Koichi Watashi, National Institute of Infectious Diseases, JAPAN
Received:January 29, 2015
Accepted:October 16, 2015
Published:November 6, 2015
Copyright:© 2015 Ye et al. This is an open access article distributed under the terms of theCreative Commons Attribution License, which permits unrestricted use, distribution, and reproduction in any medium, provided the original author and source are credited.
Data Availability Statement:All relevant data are within the paper and its Supporting Information files.
Funding:This study was supported by National Basic Research Program of China (973 Program) Grant No. 2011CB504902 and Major infectious diseases project, Grant No. 20132X10004601-002. The funders had no role in study design, data collection and analysis, decision to publish, or preparation of the manuscript.
persistently infected patients, up to 60–80% of infected adults progress to liver cirrhosis and hepatocellular carcinoma [1]. With over 180 million people currently infected, HCV represents a growing world health problem [2]. Although many issues have been addressed since HCV was first identified, the lack of a virus culture system was a serious handicap in the fight against HCV infection. The development of an HCV replicon system enabling HCV subgenomic RNA replication in Huh7 human hepatoma cells allowed the study of mechanisms underlying HCV replication [3]. The initial functional replicon that was previously reported is HCV genotype 1, and efficient replication of this replicon has been accomplished only in limited human hepato-cyte-derived cell lines [4–6]. Kato et al. developed an HCV genotype 2a replicon (JFH-1) that replicates efficiently in Huh7 cells and other human hepatocyte-derived cells lines (HepG2 and IMY-N9) [7–9] and nonhepatic cells lines (HeLa and HEK293) [10,11] without adaptive muta-tions. Although these cell lines can uptake the HCV subgenomic replicon, the efficiency of repli-cation in cells differs significantly because of host cell permissiveness. In 2005, an efficient virus production system using the JFH1 strain was developed using Huh7-derived cell lines [12,13]. In this system, Huh7 is the only cell line that enables persistent HCV production without addi-tional host factors [14], although a new human hepatoma cell line (Li23), was recently reported to enable genome-length HCV RNA replication [15,16]. Other hepatocyte-derived cells, such as HepG2 cells, support the HCV 2a subgenomic replicon with lower efficiency compared to Huh7. HepG2 cells differ by up to two orders of magnitude in their level of permissiveness [9]. To date, there is still no evidence to support robust replication of the HCV genotype 1 subge-nomic replicon or 2a gesubge-nomic replicon in HepG2 cells without the addition of external factors.
The permissiveness of the host cell critically contributes to the different efficiency of RNA replication [17,18]. However, the mechanisms behind the different levels of permissiveness in the two cell lines are unknown. Evidence suggests that the level of permissiveness is determined by the availability of host cell factor(s) required for RNA replication, presumably limiting repli-cation in cells with low permissiveness [18]. One important finding is that liver-specific micro-RNA 122 (miR-122) is highly expressed in Huh7 cells and absent in HepG2 cells [19]. MiR-122 can facilitate replication of HCV viral RNA, suggesting one possible cause of the different levels of permissiveness between the two cell lines. Hepatic cell lines transfected with miR-122 were able to support the entire HCV life cycle. However, long-term multi-cycle HCV spread was less efficient in HepG2 cells expressing miR122 compared with Huh7.5.1 cells [16,20]. In addition to microRNA, a number of other host cell factors may also be involved in facilitating HCV replication or translation.
Proteomic analysis provides a large-scale view of proteins expression in cells or tissues. Therefore, differential proteomic analysis might identify disease-related proteins and provide possible clues to their functions. Proteomic technology has been employed to find potential pro-teins that associate or interact with HCV [21–24]. Jacobs et al. analyzed HCV replicon-positive and negative Huh7.5.1 cells and identified changes in expression of proteins involved in lipid metabolism [21]. Xun et al. examined the differential expression of proteins in Huh7 cells and Huh7 cells harboringin vitro-transcribed full-length HCV 1b RNA (Huh7-HCV) and found 13 differential proteins related to HCV replication [22]. The above reports added new information to the understanding of HCV and may provide new clues for the treatment of HCV infection.
proteins were identified. QRT-PCR and western blot were used to verify expression levels of these proteins. However, CTSB and vimentin were identified as regulators of HCV replication by protein functional studies, and may therefore be potential molecular targets for HCV treatment.
Materials and Methods
Cells and Virus
Huh7.5.1 human hepatoma cells were kindly provided by Francis Chisari (Scripps Research Institute, La Jolla, CA, USA) and were maintained in complete DMEM. HepG2 (ATCC), Hep3b and SMMC7721 were maintained in MEM medium while L-02 were maintained in RPMI1640 medium supplemented with 2 mM L-glutamine, 100 U/ml of penicillin, 100 mg/ml of streptomycin and 10% FBS [25,26]. Hep3b, SMMC7721 and L-02 were obtained from Cell culture center of Chinese Academy of Medical Sciences and Peking Union Medical College. R1b cells expressing an HCV pooled subgenome replicon were developed in our laboratory as described previously [3,27] and maintained with an additional 500μg/mL G418 supplement.
To obtain cured Huh7.5.1 wt cells, R1b cells were treated with 1000 IU/ml of IFN-αin the absence of G418. The treatment was continued for 2 weeks with the addition of IFN-αat 3-day intervals. Clearance of HCV RNA in these cured cells was confirmed by qRT-PCR.
Apparatus
An LTQ Velos Orbitrap and a TripleTOF 5600 mass spectrometer were from Thermo fisher (Bremen, Germany) and ABsciex (Framingham, USA). An ACQUITY UPLC system was pur-chased from Waters (Milford, MA). An ADVANCE CaptiveSpray source for Thermo and C18 reverse phase (RP) capillary were purchased from Michrom Bioresources (Auburn, CA).
Reagents
Deionized water from a MilliQ RG ultrapure water system (Millipore, MA) was used at all times. HPLC grade I and formic acid, ammonium bicarbonate, iodoacetamide, DTT, sequenc-ing grade modified trypsin, and protease inhibitor PMSF were purchased from Sigma
(St. Louis MO, USA).
Protein Sample
Cell population were harvested in 50 ml tubes by centrifugation for 5 min at 400 ×g, washed five times with phosphate-buffered saline, and lysed with lysis buffer (7 M urea, 2 M thiourea, 50 mM tris, 50 mM DTE, 1 mM PMSF, 1 mM Rnase and 1 mM Dnase) in a homogenizer on ice. The lysate was centrifuged for 10 min at 12,000×g, and the supernatant was collected. The radford method was used to determine the protein concentration.
Protein Digestion
The protein samples were digested using the filter-aided sample preparation method [28]. Briefly, the protein sample were first reduced with 20 mM DTT at 95°C for 3–5 min, and then washed once with 8M urea on 10Kda filter (Pall) at 14,000 g for 40 min. The mixture was alkyl-ated with 55 mM iodoacetamide for 30 min in the dark, and washed twice with 8 M urea. The protein sample were washed with 50 mM ammonium bicarbonate once, and then digested with trypsin (1μg/50μg protein) overnight at 37°C. The peptide mixtures were desalted on an
iTRAQ labeling
The two digested samples were mixed at equal amount as an internal standard. The two sam-ples and the internal standard were labeled with 115, 116 and 117 iTRAQ. Labeling was per-formed according to the manufacturer’s protocol (Absciex). The three samples were pooled into one sample at equal peptide amounts and lyophilized.
LC-MS/MS analysis
Label-free approach. The two digested samples were analyzed using an RP C18 capillary LC column from Michrom Bioresources (100μm×150 mm, 3μm). The gradient was eluted in
5–30% buffer B1 (0.1% formic acid, 99.9% I; flow rate, 0.5μL/min) for 100 min. Each sample
was run three times. Orbitrap-LTQ-CID mode was used to acquire raw data. Precursors were scanned with an Obitrap analyzer and then fragmented and scanned with an LTQ analyzer. MS data were acquired using the following parameters: 20 data-dependent CID MS/MS scans per every full scan, full scans were acquired in Orbitrap at resolution 60,000, 35% normalized collision energy in CID included internal mass calibration (445.120025 ion as lock mass with a target lock mass abundance of 0%), charge state screening (excluding precursors with unknown charge state or +1 charge state) and dynamic exclusion (exclusion size list 500, exclusion dura-tion 30 s).
iTRAQ approach. The pooled mixture from three labeled samples was first fraction with a high-pH RPLC column from Waters (4.6 mm×250 mm, C18, 3μm). The samples were loaded
onto the column in buffer A2 (100% H2O, pH = 10). The gradient was eluted in 5–30% buffer
B2 (90%CAN; pH = 10, flow rate 1 mL/min) for 60 min. The eluted peptides were collected as one fraction per minute, and the 60 fractions were pooled into 20 samples. Each sample was analyzed using a RP C18 capillary LC column from Michrom Bioresources (100μm×150 mm,
3μm). The gradient was eluted in 5–30% buffer B1 (0.1% formic acid, 99.9% I; flow rate,
0.5μL/min) for 100 min. TripleTOF 5600 was used to analyze the samples. MS data were
acquired with the high sensitivity mode using the following parameters: 30 data-dependent MS/MS scans per every full scan; full scans acquired at resolution 40,000 and MS/MS scans at 20,000; 35% normalized collision energy, charge state screening (including precursors with +2 to +4 charge state) and dynamic exclusion (exclusion duration 15 s); MS/MS scan range was 100–1800 m/z and scan time was 100 ms.
Database search
The MS/MS spectra were searched against the SwissProt human database from the Uniprot website (www.uniprot.org) using Mascot software version 2.3.02 (Matrix Science, UK). Trypsin was chosen as cleavage specificity with a maximum number of allowed missed cleavages of two. Carbamidomethylation I and the iTRAQ 4-plex label were set as fixed modifications for the iTRAQ labeling approach. The searches were performed using a peptide tolerance of 5 ppm and a product ion tolerance of 0.5 Da in a label-free approach, and peptide and product ion tolerance of 0.05 Da in the iTRAQ method. Scaffold was used to further filter the database search results using the decoy database method. A 1% false positive rate at the protein level was used as a filter, and each protein contained at least 2 unique peptides.
Quantitation analysis
among different LC/MS/MS runs was normalized. Alignment was achieved by use of the auto-mated alignment algorithm within Progenesis LC-MS. Features were filtered for charge state (+2 to +5). To integrate MS features with protein identities, MS/MS spectra from all runs were exported and searched against the SwissProt human database using Mascot. The results were imported back into Progenesis LC-MS and the peptide identifications were mapped onto the quantitative peptide data. Peptide quantitative results were converted into protein quantitative results by peptide reassignment with Progenesis LC-MS. Proteins with a fold change>2 and p-value<0.05 were considered as significant.
The database search results from iTRAQ-labeling approach were imported into Scaffold for further analysis. After filtering the results by above database search filter, the peptide dances in different reporter ion channels of MS/MS scan were normalized. The protein abun-dance ratio was based on unique peptide results. Proteins with a fold change>2 were considered significant.
GO functional analysis
Differential proteins (Table 1) identified by two proteomic analysis approaches were assigned their gene symbol via the Panther database (http://www.pantherdb.org/). Protein classification was performed based on functional annotations using Gene Ontology (GO) for biological pro-cess and molecular function. When more than one assignment was available, all of the func-tional annotations were considered in the results.
IPA network analysis
The SwissProt accession numbers of differential proteins (Table 1) were inserted into the Inge-nuity Pathway Analysis (IPA) software (IngeInge-nuity Systems, Mountain View, CA). This soft-ware categorizes gene products based on the location of the protein within cellular components and suggest possible biochemical, biological and molecular functions. Proteins were mapped to genetic networks available in the Ingenuity and other databases and ranked by score. These genetic networks describe functional relationships between gene products based on known interactions in literature. The newly formed networks were associated with known biological pathways with the IPA software.
Real-time qRT-PCR analysis
Differential proteins were verified by qRT-PCR analysis. Briefly, cells were cultured for RNA isolation using Trizol reagent (Invitrogen, USA) following the manufacturer’s protocol. Then 1μg total RNA was reverse transcribed to cDNA using random primers and first-strand cDNA
synthesis superMix (TransGen biotech, China). QRT-PCR was performed on a C1000 Thermal cycler (Bio-rad, USA) with SYBR Green Mix (Takara Bio INC, Japan) as a previously described method [27]. The qRT-PCR procedure was as follow: an initial step of 1 min at 95°C, followed 40 cycles for 10 s at 95°C and 30 s at 60°C. The disassociation analysis was routinely carried out by acquiring a fluorescent reading from 55°C to 95°C. All qRT-PCR products were verified by
Table 1. The qualitative and quantitative results from the label-free and 4-plex iTRAQ methods.
Method Qualitative result Quantitative result
Protein peptide Spectrum total differential common
Label-free 1467 8118 52993 1416 393 114
iTRAQ 4944 38,191 215,287 4900 457 114
melting curve analysis. Primers sequences are provided in the supporting information. The fold-relative enrichment was quantified with normalization to the GAPDH level. Each experi-ment was repeated at least three times.
Over-expression or knockdown of differential proteins
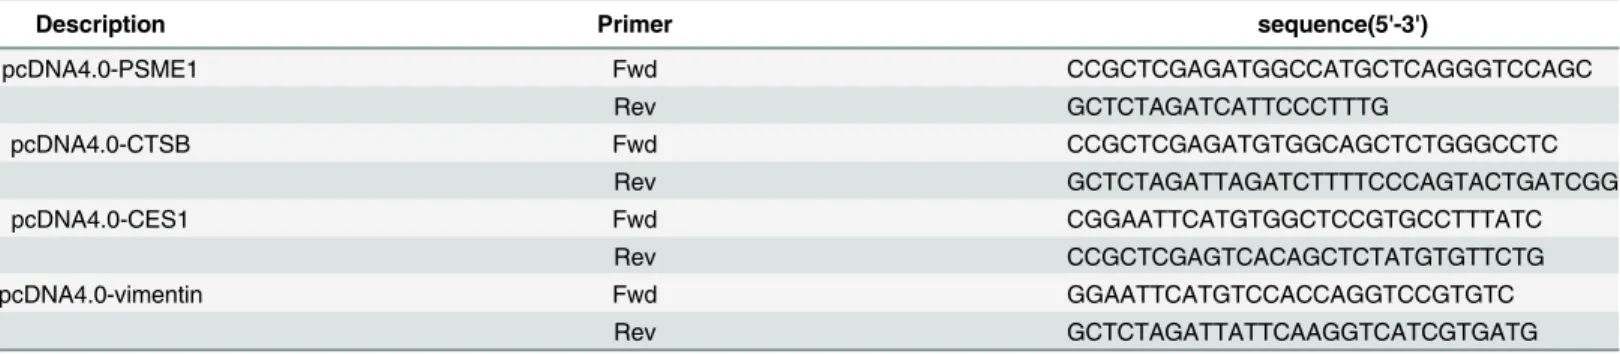
To test the key differential proteins function to HCV subgenome replication, R1b cells were transfected with 20 nM siRNAs targeting GSTP1 [29], UCHL1 [30], vimentin [31] or plasmids over-expressing CES1, PSME1, CTSB using Lipofection 2000 (Invitrogen, USA) according to the manufacturer’s protocol. The primers of over-expression for CTSB, CES1, vimentin, and PSME1 were described inTable 2. Western blot and qRT-PCR analysis were used to analyze levels of each proteins,β-actin, HCV RNA, and GADPH mRNA.
Cell Culture-derived HCV (HCVcc) and Luciferase reporter assays
To demonstrate the key differential proteins to HCVcc replication, Huh7.5.1 cells were trans-fected with 20 nM siRNA, and a second siRNA transfection was processed after 24 h. Then cells were infected with Jc1-Luc HCVcc after 48 h, and Luciferase activity was measured 48 h later (Promega, USA). The production and infection procedures of HCV JFH1 were described previously [32]. And the production of Jc1-luc chimeric HCV cell culture (HCVcc) was per-formed as previously described [33].
In vitro
transcription
To verified the key differential proteins to HCV subgenome replication, HepG2 cells were transfected with 20 nM siRNAs targeted to CTSB [34] or over-expression plasmids of vimen-tin, and cells were transfected with HCV 1b RNA using Interferin (Polyplus-transfection Inc, USA) 12 h later and harvested for protein extraction and total mRNA isolation after 24 and 48 h. Non-related control siNC (Genepharma, China) and pcDNA3.1 were used as negative controls.
ScaI-digested replicon constructs were further purified with ethanol and sodium acetate and used as templates forin vitroRNA synthesis using the RiboMAX™Large Scale RNA Production System-T7. Synthesized HCV subgenomic RNA was treated with Dnase I (Promega, USA) fol-lowed by acid phenol extraction to remove any remaining template DNA.
Western blot analysis
Western blot was performed following a previously described method [35]. The dilution of pri-mary antibodies as below: UCHL1 (diluted in 1:1000, Enzo life sciences), GSTP1 (diluted in
Table 2. Primers used in this study.
Description Primer sequence(5'-3')
pcDNA4.0-PSME1 Fwd CCGCTCGAGATGGCCATGCTCAGGGTCCAGC
Rev GCTCTAGATCATTCCCTTTG
pcDNA4.0-CTSB Fwd CCGCTCGAGATGTGGCAGCTCTGGGCCTC
Rev GCTCTAGATTAGATCTTTTCCCAGTACTGATCGG
pcDNA4.0-CES1 Fwd CGGAATTCATGTGGCTCCGTGCCTTTATC
Rev CCGCTCGAGTCACAGCTCTATGTGTTCTG
pcDNA4.0-vimentin Fwd GGAATTCATGTCCACCAGGTCCGTGTC
Rev GCTCTAGATTATTCAAGGTCATCGTGATG
1:1000, Calbiochem), Vimentin and CES1 (diluted in 1:500, Santa Cruz Biotechnology), CTSB and PSME1 (diluted in 1:500, Epitomics Biotechnology). The HCV core (diluted in 1:1000, Thermo Fisher Scientific), Mouse monoclonalβ-actin antibody (diluted in 1:3000, Sigma). HRP-linked anti-IgG ECL reagent (Amersham Biosciences, UK) was used as the substrate for detection, and the membrane was exposed to an X-ray film for visualization.
Statistical Analysis
The qRT-PCR and Western blot assay were performed in triplicate. The data were analyzed using a two-tailed paired Student’s t test, and Values withP<0.05were considered to be significant.
Results
Proteomic analysis to detect differentially proteins
To achieve a comprehensive differential proteomic analysis, two quantitative approaches were used in this work. The first is a label-free method based on peptide peak area, whereas the sec-ond is a labeled method based on iTRAQ labeling.
Label-free approach. The two samples (Huh7.5.1 wt and HepG2 cells) were analyzed by 1D LC-MS/MS. A total of 6 LC-MS/MS runs (3 for each cell line) were imported into Progen-esis LC-MS and subjected to alignment with a reference run. MS feature detection was filtered by peptide charge state (+2 to +5) and resulted in 40,444 features. The features from the MS/ MS scan were exported from Progenesis LC-MS for a Mascot database search. A total of 103,610 MS/MS spectra were searched against the SwissProt database and 52,993 spectra were identified. The results were further filtered by Scaffold with 1% FDR at the protein level and 2 unique peptides for each identification, resulting in 8118 peptides and 1467 proteins (Table 1, detailed data inS1 Table). A total of 1416 proteins could be used for quantitative analysis. The mean protein abundance CV was 11.57%.
S1 Figcompared the protein abundance ratio of any two inter-run analyses using linear regression. The abundance ratio of replicate experiments performed very well with R2above 0.99, which showed the good experimental reproducibility of this study.
To evaluate the false positive frequency in protein abundance changes based on peptide peak area criteria, the three runs for each sample were mutually compared. The average false positive frequency of inter-run analysis was 1.71% (false positive frequency is the protein num-ber with an abundance change greater than 2-fold divided by the total protein numnum-ber in any two runs of a given sample; detailed data for each sample not shown).
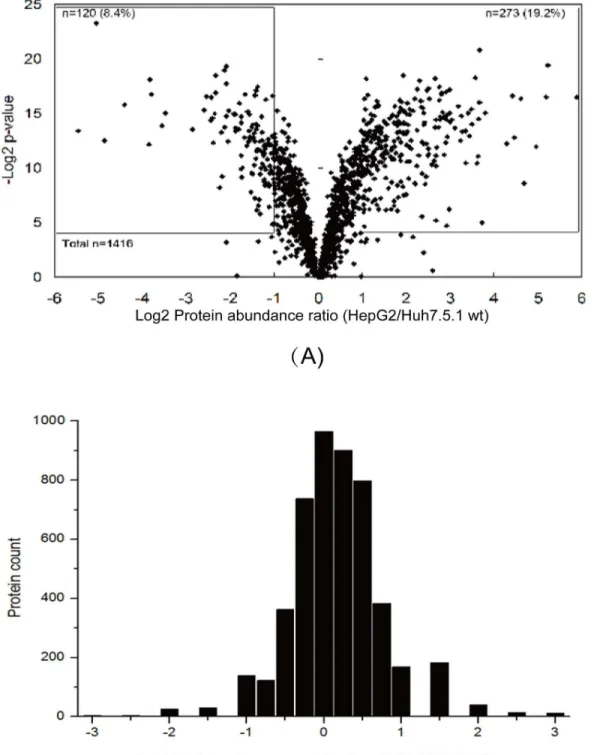
The inter-sample analysis is visualized using a volcano plot comparing the fold change and t-test p-value (Fig 1). A total of 393 proteins were determined to be modulated more than 2-fold with t-test p-value less than 0.05 (S1 Table).
A total of 773,191 MS/MS were used for the database search and 215,287 spectra, 38,191 unique peptides and 4944 proteins were identified (Table 1, detailed data inS1 Table). From this dataset, 4900 proteins could be used for quantitative analysis. The protein abundance ratio distribution of the two cell lines is shown inFig 2. The normal distribution of the protein abun-dance ratio and the greater than 90% ratio between -1 to +1 indicated that the iTRAQ-labeling approach provided good quantitative information. The differential proteins with over 10 fold change were manually validated and found they were artifacts by data processing, therefore, they were excluded from the final list. Total 451 differential proteins were found (S2 Table), 201 protein up-regulated and 250 down-regulated.
Combination of label-free and iTRAQ-labeling approaches
When combined the results from the label-free and iTRAQ-labeling approaches were combined, a total of 730 differentially expressed proteins were identified. Among them 114 were regarded as differential by both approaches, and showed the same expression trend. A total of 56 proteins were identified as differential with one approach (44 and 12 from the label-free and iTRAQ approaches, respectively), but the other approach showed the reverse trend. To exclude false posi-tive identification, these proteins were excluded from the following functional analyses. Therefore, a total of 674 proteins were considered as differentially expressed proteins for functional analysis.
GO analysis
To gain a functional understanding of the possible roles of the differentially expressed proteins, GO annotation was performed using“biological process”and“molecular function”. The 674
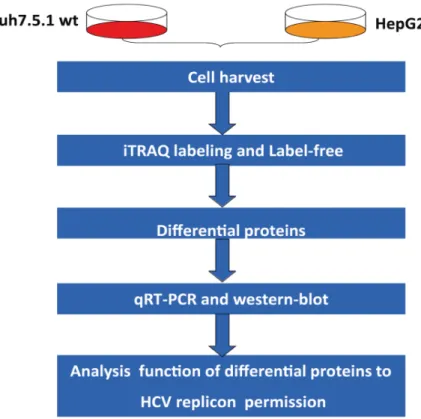
Fig 1. The overall workflow.Huh7.5.1 wt and HepG2 whole-cell proteins were harvested and analyzed using the Label-free and iTRAQ proteomic approaches, and the differential proteins were verified by qRT-PCR and western blot. The functions of selected differential proteins in HCV replication were analyzed further.
Fig 2. Quantitative analysis of proteins abundance changes detected using the label-free and iTRAQ approaches.(A) The volcano plot shows t-test p-values plotted against log2 values of protein fold changes. Data points in the lower center area of the plot have a log2 value close to 0 and apvalue approaching 1 and indicate no significant change, whereas points in the upper left and upper right quadrants indicate significant negative and positive changes in protein abundance, respectively. (B) The iTRAQ ratio was transformed by log2 analysis. The proteins with abundance ratio within the range from -1 to +1 indicate no significant changes, and values larger than +1 or lower than -1 indicate significant positive and negative changes in protein abundance, respectively.
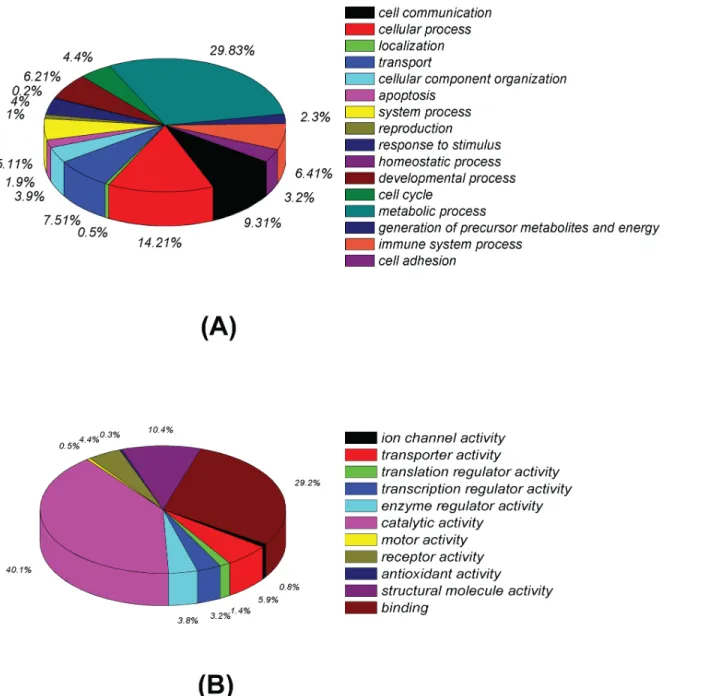
differential proteins were clustered according to their biological processes and molecular func-tion (Fig 3). Proteins were involved in several biological processes that are relevant for HCV infection, especially growth and inflammation. A significant number of identified proteins (29.8%) were engaged in metabolic process, while the next top five biological process categories were cellular process (14.2%), cell communication (9.3%), transport (7.5%), immune system process (6.4%) and developmental process (6.2%) (Fig 3A). In the molecular function distribu-tion category, the majority of the proteins were associated with three funcdistribu-tions: catalytic activ-ity (40.1%), binding (29.2%) and structural molecule activactiv-ity (10.4%) (Fig 3B).
Fig 3. Classification of differentially expressed proteins based on GO annotation.(A) Categorization based upon biological process analysis of total differential protein expression. (B) Categorization based upon molecular function analysis of total differential protein expression. The distribution frequencies in regard to the specified categories within the given charts are indicated in % of the total number of protein entries.
IPA network analysis
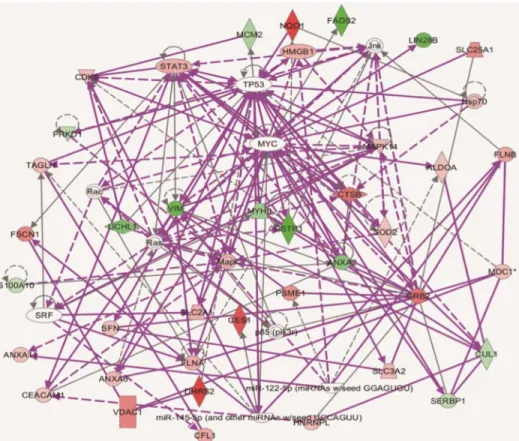
Ingenuity Pathway Analysis (IPA) was used to determine whether proteins that changed in abundance could be mapped to specific functional networks. IPA analysis revealed that many of the differential proteins were located in networks of Cancer, Gastrointestinal and Hepatic System Disease (Fig 4). Several differential proteins including vimentin, CTSB, UCHL1, CES1, PSME1 and GSTP1, were key proteins in the merged network. These proteins interacted with each other or with important cell factors either directly or indirectly. Whether these networks target HCV or impact the permission of cells for HCV infection needed to elucidated.
Validation of differential proteins by qRT-PCR and western blot analysis
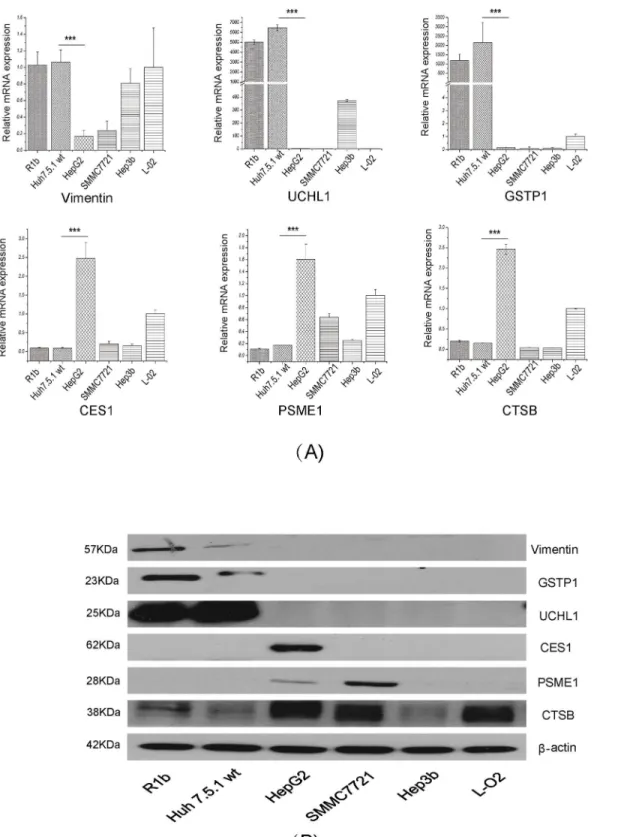
A total of 37 differential proteins which were located in the merged networks or related with virus infection were selected for qRT-PCR analysis. The 37 proteins showed the same expres-sion trend in qRT-PCR against proteomic analyses (S3 Fig). Among them, vimentin, PSME1, CES1, UCHL1, GSTP1 and CTSB were chosen for further study. Other hepatitis cell lines were used to better elucidate which proteins play a role in the HCV life cycle. However, the mRNA levels of GSTP1, UCHL1, and vimentin were extremely high in Huh7.5.1 wt cells compared to HepG2. While CES1, PSME1 and CTSB were identified with a high expression in HepG2 cells but not in R1b and Huh 7.5.1 wt cells (Fig 5A). All results consisted with the results both in label-free and iTRAQ.
Fig 4. The interaction networks of differential proteins in Huh7.5.1 wt and HepG2 cell lines by IPA analysis.The networks of differentially expressed proteins related to Cancer, Gastrointestinal and Hepatic System Disease, Cell Death and Survival, Cellular Development, Growth and Proliferation. Proteins high in Huh7.5.1 wt cells and HepG2 cells are denoted in red and green, respectively. Any known direct connections between these proteins are indicated by solid lines, indirect interactions are shown with dashed lines.
Fig 5. The key differentially expressed proteins in IPA networks analysis were validated by qRT-PCR and western blot.(A) The mRNA levels of six differential proteins in hepatic cell lines. (B) The protein levels of six key differential proteins in hepatic cell lines. NS3 was used as control for HCV-replicon expression for all the analyses, while GAPDH as control. Andβ-actin was used for protein loading control.*P<0.05,**P<0.01 and***P<0.001 versus negative control
To validate the protein level of above differential proteins, western blot was carried out to verify these results. Vimentin, GSTP1 and UCHL1 were highly expressed in R1b and Huh7.5.1 wt cells, while expression of PSME1, CES1 and CTSB were higher in HepG2 cells (Fig 5B). Expression of all 6 differentially expressed proteins in Huh7.5.1 wt and HepG2 is summarized inTable 3. Overall, the qRT-PCR and western blot analyses confirmed the results of the label-free and iTRAQ analysis.
Effects of GSTP1, UCHL1, vimentin, CES1, PMSE1 and CTSB on HCV
replication
Although differentially expressed proteins were identified by both LC/MS/MS and western blot. The function of these proteins related to HCV infection still need to uncover. Vimentin, GSTP1 and UCHL1 exhibited high expression levels in Huh7.5.1 wt cells not in other hepatic cell lines, indicating that they might facilitate the permissiveness of the HCV replicon in differ-ential cell lines.
Knockdown of GSTP1, vimentin and UCHL1 in R1b cells were used to explore the differen-tial proteins functions in HCV subgenome permission. Results illustrated that the RNA level of HCV highly decreased in vimentin knockdown cells, increased in GSTP1 knockdown cells and did not changed in UCHL1 knockdown cells (Fig 6A, left panel). The results indicate that vimentin might be associated with HCV replicon permissiveness.
And CES1, PSME1 and CTSB were over-expressed in R1b cells prior to detection HCV RNA. HCV replication did not change significantly in cells with over-expression of CES1 and PSME1. However, the HCV RNA level sharply decreased in cells with CTSB over-expression (Fig 6A, right panel), which indicated that CTSB might participate in HCV subgeonme permis-sion in R1b cells. Effects of HCV to these proteins exprespermis-sion were illustrated, Vimentin, UCHL1, GSTP1 and CTSB were demonstrated decreased in HCV infection (S3 Fig).
Huh7.5.1 cells were infected with Jc1-Luc HCVcc after vimentin was knocked down or CTSB was over-expressed to further investigate roles of proteins on HCV RNA levels. Knock-down of vimentin or over-expression of CTSB both reduced luciferase activities (Fig 6B). The effect of CTSB and vimentin to viral protein expression were confirmed by HCV JFH1 infec-tion. Results showed that CTSB inhibit viral protein expression, and vimentin didn’t show such effect (Fig 6C). And CTSB and vimentin didn’t affect R1b cell viability and growth in this study (data not show).
To verify the function of vimentin and CTSB to HCV RNA replication in HepG2 cell lines. Knockdown of CTSB or over-expression of vimentin was performed in HepG2 cells after the HCV subgenome RNA transfection. HCV RNA levels were analyzed at 24 h and 48 h after transfection. The results showed that levels of HCV RNA in treated cells were significant
Table 3. Identification of the 6 differential proteins in Huh7.5.1 wt and HepG2 cells detected by analysis of label-free, iTRAQ, qRT-PCR and western blot assays (Relative differential proteins: HepG2/Huh7.5.1 wt).
label-free iTRAQ qRT-PCR Western blot
GSTP1 0.0304 0.2000 0.0001 0.0604
UCHL1 0.0898 0.1053 0.0003 0.0205
vimentin 0.0700 0.1579 0.1588 0.2752
PSME1 5.3056 2.8000 9.3616 7.6806
CES1 21.5732 8.5000 28.4906 28.5858
CTSB 10.3232 2.8000 16.0261 2.2342
depleted slowly compared with the negative control (Fig 6D). Western blot analysis demon-strated knockdown or over-expression of indicated proteins level compared with the negative control (Fig 6A, 6B and 6C, down panel). These results may suggest that CTSB and vimentin participated in HCV RNA replication procession.
Fig 6. The effects of six key differential proteins on HCV RNA levels.(A) qRT-PCR analysis of HCV RNA levels by transfection of siRNA or over-expression of plasmids. (B) Luciferase assay of Jc1-Luc HCVcc in Huh7.5.1 cells transfected with siRNA or over-over-expression plasmids. (C) QRT-PCR analysis of HCV RNA levels in knockdown of CTSB or over-expression of vimentin in HepG2 cells after transfection with HCV replicon RNA. Western blot results showed the protein level of knockdown and over-expression differential proteins, andβ-actin as protein loading control. (D) Huh7.5.1 cells were transfected with siRNA or over-expression plasmids of CTSB, then 24 h later, cells were infected with HCVcc (multiplicity of infection 0.1). At 48 h post infection, immunoblotting was performed with an anti-HCV core antibody. Each bar represents the average of triplicate data points with the standard deviation represented as the error bar.*P<0.05,**P<0.01 and***P<0.001 versus negative control
Discussion
Recent advances in both proteomic methodologies [39–41] and cell culture models of HCV infection [3] make it possible to perform global characterization of the host cell protein response within the context of the complete set of HCV genesin vitro. Global characterization of the host cellular response to HCV has been developed using liquid chromatographic (LC) separations coupled with mass spectrometry (MS) for proteome analysis to identify potential gene markers of HCV-associated liver disease [42]. These reports were mainly based on the HCV replicon cell culture systems and have been particularly limited for several reasons. One limitation is that HCV replicon sequences contain many sequences absent from the HCV genome that are required to sustain the replication of the replicon. Additionally, the G418 selection required to select cells containing the HCV replicon influences the protein profile of host cells and results changes in the host cell proteome. These defects may result in identification of false positive pro-teins during proteome analysis that are independent of the HCV life cycle. We compared prote-omic differences between two naïve hepatoma cell lines that showed significant differences in permissiveness for the HCV replicon. The use of naïve cells allowed us to avoid the influence of extrinsic factors and was favorable for selecting real HCV-related proteins.
Proteomics is a powerful tool for biological and medical analysis and has been successfully utilized in various fields. In this paper, we employed two quantitative proteomic methods, label-free (peptide peak area) and labeled (iTRAQ). The label-free approach is based on peptide peak area and provides comprehensive proteomic profile and quantitative results. It required high reproducibility of sample processing and LC-MS/MS results [43]. With the increase in sample number and multiple-dimensional separation, the variance of fold change will increase. Therefore, in this study 1D LC-MS/MS was used for label-free quantitative analysis to obtain more accurate quantitative results. The iTRAQ-labeling approach used an isotope labeling method and provided reliable quantitative information. However, protein ratio accuracy was often underestimated due to contamination of peptides with similar m/z’s included in the isola-tion window during ion selecisola-tion and prior to MS/MS fragmentaisola-tion. A previous study reported that prefractionation of samples could increase the proteome coverage [44]. In this study RP-RP 2D LC-MS/MS was adopted for the iTRAQ-labeling approach to obtain more comprehensive quantitative results. The combination of these two approaches not only pro-vided more comprehensive quantitative information about the sample, but also mutually con-firmed the results. The label-free approach provides more accurate quantitative information that may be under-estimated by the iTRAQ-labeling approach, while the iTRAQ-labeling approach using 2D LC-MS/MS provided higher proteome coverage that might be absent in 1D LC-MS/MS label-free analysis. Finally a comprehensive differential protein map (674 proteins) was presented.
is one question that the HCV RNA level still low in HepG2 cells after ectopic expression of miR-122 when compared with Huh7 cell lines [20,53,54].
The aim of this study was to identify proteins involved cell permissive, some of proteins have been reported to be relevant to HCV or HCV associated hepatocellular carcinoma. Crea-tine kinase B (CKB) is a key ATP-generating enzyme, was reported to be important for efficient replication of the HCV genome and propagation of infectious virus [55]. And in our data, CKB is richly expressed in Huh7.5.1 wt cells which can partly explain why the permission of HCV subgeonme in HepG2 is low. UCHL1, GSTP1 and CTSB, were linked to the TP53 signaling cascades, which has been suggested to be involved in carcinogenic processes and transcription regulation. TP53 mutation has been demonstrated to frequently exist in hepatocellular carci-noma patients infected with HCV [56]. UCHL1 is selectively expressed in the testis/ovary and brain and plays an important role in targeting of abnormal proteins for degradation through the ubiquitin-proteasome system [57,58]. UCHL1 is particularly high expressed in Huh7.5.1 wt related cell lines, but loss of function in R1b cells indicated that it did not have an effect on HCV replication. And GSTP1 is an enzyme that catalyzes the conjugation of glutathione (GSH) to a variety of electrophilic substances. It has been reported that the GSTP1 gene is hypermethylated in genotype 1b HCV core protein-positive cells [59] and in hepatocellular carcinoma (HCC) tumors associated with HCV infection [60]. We discovered that knockdown of the GSTP1 led to an increase in HCV RNA levels in R1b cells. The association GSTP1 hepa-tocellular carcinoma indicates that it may function in the HCV life cycle [61]. We speculate that GSTP1 may be a cellular factor that acts as an antiviral element during HCV replication.
Vimentin is a type III intermediate filament (IF) protein expressed in mesenchymal cells, that is often used as a marker of mesenchymal derived cells or cells undergoing an epithelial-to-mesenchymal transition (EMT), and was reported participated in virus infection. During Dengue virus infection, vimentin interacts with the NS4A protein, and facilitates formation of the replication complex, suggesting that it participates in virus replication [62]. Vimentin expression is increased in HCV-infected human hepatoma cells compared with parental cells but not in patients without chronic hepatitis [63,64]. In this study, knockdown of vimentin in R1b cells significantly impaired the RNA level of HCV in these cells, suggesting an effect to HCV replication (Fig 6Aleft panel). Moreover, over-expression of vimentin in HepG2 cells facilitates the survival of transiently transfected HCV RNA in the cells, which indicated a potential role that contributes to permissiveness (Fig 6D). However, vimentin didn’t affect rep-lication of HCV while in HCV infection (Fig 6C), the exactly mechanisms vimentin affects HCV RNA replication remains to be elucidated. It had been reported that the HCV core pro-tein level was affected by cellular vimentin content, and vimentin might enable the control HCV of production [65]. As vimentin is an intermediate filament-protein, we hypothesis that the replication process of HCV might draw support from intermediate filaments to complete its physiological activity.
CTSB, a lysosomal cysteine protease, is a candidate for an apoptotic mediator originating from acidic vesicles, induces apoptosis by enhancing mitochondrial release of cytochrome c and subsequent caspase activation in TNF-αtreated hepatocytes [69]. We discovered that in R1b cells, the expression level of CTSB was greatly inhibited. Over-expression of CTSB led to a significant decrease of HCV RNA level and Jc1 luciferase activity in R1b cells, while knockdown of CTSB in HepG2 cells contributed to HCV RNA accumulation in the cells fol-lowing transient transfection (Fig 6). These results suggested a close relationship between CTSB and HCV replication. It was reported that HCV, including HCV non-structural pro-teins, takes advantage of many pathways to avoid cellular apoptosis for survival and persis-tent propagation [70,71]. And these results may partly explain how CTSB affects HCV replication. However, whether HCV has a direct or indirect effect on CTSB need more investigation.
In summary, we presented here a large-scale proteomic analysis of the HCV replicon in high-permissive and low-permissive cell lines forin vitroanalysis of HCV replication. The results represented a comprehensive protein database of human cell lines, providing a base-line for characterization of HCV-related proteins in the cellular environment and, identifica-tion of potential targets for HCV replicaidentifica-tion and antiviral treatment. These results further provide the understanding of the molecular mechanism of cellular events and pathogenesis associated with HCV progression, which is useful for the identification of HCV infection-associated proteins.
Supporting Information
S1 Fig. Comparison of protein abundance for replicate experiments of Huh7.5.1 wt (A-C) and HepG2 (D-F) cells using the label-free approach.
(TIF)
S2 Fig. The 31 mRNA levels in Huh7.5.1 wt cells and HepG2 cells.The upper graph shows proteins rich in Huh7.5.1 wt cells. The under graph shows proteins rich in HepG2 cells. (TIF)
S3 Fig. The HCV effect to 6 differential proteins expression in Huh7.5.1 cells.
(TIF)
S1 Table. The protein and peptide list from the label-free method and 4-plex iTRAQ method.
(XLSX)
S2 Table. The differentially expressed protein list from both the label-free and 4-plex iTRAQ quantitation methods.
(XLSX)
S3 Table. The results and primers of differential proteins expression by analysis of qRT-PCR.
(XLSX)
Author Contributions
References
1. Moradpour D, Penin F, Rice CM. Replication of hepatitis C virus. Nature reviews Microbiology2007. p. 453–63. PMID:17487147
2. Bartenschlager R, Sparacio S. Hepatitis C virus molecular clones and their replication capacity in vivo and in cell culture. Virus research. 2007; 127(2):195–207. doi:10.1016/j.virusres.2007.02.022PMID: 17428568.
3. Lohmann V, Korner F, Koch J, Herian U, Theilmann L, Bartenschlager R. Replication of subgenomic hepatitis C virus RNAs in a hepatoma cell line. Science. 1999; 285(5424):110–3. PMID:10390360.
4. Bartenschlager R, Lohmann V. Replication of hepatitis C virus. The Journal of general virology. 2000; 81(Pt 7):1631–48. PMID:10859368.
5. Blight KJ, McKeating JA, Marcotrigiano J, Rice CM. Efficient replication of hepatitis C virus genotype 1a RNAs in cell culture. Journal of virology. 2003; 77(5):3181–90. PMID:12584342; PubMed Central
PMCID: PMC149761.
6. Gu B, Gates AT, Isken O, Behrens SE, Sarisky RT. Replication studies using genotype 1a subgenomic hepatitis C virus replicons. Journal of virology. 2003; 77(9):5352–9. PMID:12692237; PubMed Central
PMCID: PMC153987.
7. Kato T, Date T, Miyamoto M, Furusaka A, Tokushige K, Mizokami M, et al. Efficient replication of the genotype 2a hepatitis C virus subgenomic replicon. Gastroenterology. 2003; 125(6):1808–17. PMID: 14724833.
8. Kato T, Furusaka A, Miyamoto M, Date T, Yasui K, Hiramoto J, et al. Sequence analysis of hepatitis C virus isolated from a fulminant hepatitis patient. Journal of medical virology. 2001; 64(3):334–9. PMID: 11424123.
9. Date T, Kato T, Miyamoto M, Zhao Z, Yasui K, Mizokami M, et al. Genotype 2a hepatitis C virus subge-nomic replicon can replicate in HepG2 and IMY-N9 cells. The Journal of biological chemistry. 2004; 279(21):22371–6. doi:10.1074/jbc.M311120200PMID:14990575.
10. Kato T, Date T, Miyamoto M, Zhao Z, Mizokami M, Wakita T. Nonhepatic cell lines HeLa and 293 sup-port efficient replication of the hepatitis C virus genotype 2a subgenomic replicon. Journal of virology. 2005; 79(1):592–6. doi:10.1128/JVI.79.1.592-596.2005PMID:15596851; PubMed Central PMCID:
PMC538706.
11. Ali S, Pellerin C, Lamarre D, Kukolj G. Hepatitis C virus subgenomic replicons in the human embryonic kidney 293 cell line. Journal of virology. 2004; 78(1):491–501. PMID:14671129; PubMed Central
PMCID: PMC303421.
12. Wakita T, Pietschmann T, Kato T, Date T, Miyamoto M, Zhao Z, et al. Production of infectious hepatitis C virus in tissue culture from a cloned viral genome. Nature medicine. 2005; 11(7):791–6. doi:10.1038/ nm1268PMID:15951748; PubMed Central PMCID: PMC2918402.
13. Zhong J, Gastaminza P, Cheng G, Kapadia S, Kato T, Burton DR, et al. Robust hepatitis C virus infec-tion in vitro. Proceedings of the Nainfec-tional Academy of Sciences of the United States of America. 2005; 102(26):9294–9. doi:10.1073/pnas.0503596102PMID:15939869; PubMed Central PMCID:
PMC1166622.
14. Gottwein JM, Bukh J. Cutting the gordian knot-development and biological relevance of hepatitis C virus cell culture systems. Advances in virus research. 2008; 71:51–133. doi:10.1016/S0065-3527(08) 00002-XPMID:18585527.
15. Kato N, Mori K, Abe K, Dansako H, Kuroki M, Ariumi Y, et al. Efficient replication systems for hepatitis C virus using a new human hepatoma cell line. Virus research. 2009; 146(1–2):41–50. doi:10.1016/j. virusres.2009.08.006PMID:19720094.
16. Kambara H, Fukuhara T, Shiokawa M, Ono C, Ohara Y, Kamitani W, et al. Establishment of a novel per-missive cell line for the propagation of hepatitis C virus by expression of microRNA miR122. Journal of virology. 2012; 86(3):1382–93. doi:10.1128/JVI.06242-11PMID:22114337; PubMed Central PMCID:
PMC3264374.
17. Blight KJ, McKeating JA, Rice CM. Highly permissive cell lines for subgenomic and genomic hepatitis C virus RNA replication. Journal of virology. 2002; 76(24):13001–14. PMID:12438626; PubMed Central
PMCID: PMC136668.
18. Lohmann V, Hoffmann S, Herian U, Penin F, Bartenschlager R. Viral and cellular determinants of hepa-titis C virus RNA replication in cell culture. Journal of virology. 2003; 77(5):3007–19. PMID:12584326;
PubMed Central PMCID: PMC149776.
19. Jopling CL, Yi M, Lancaster AM, Lemon SM, Sarnow P. Modulation of hepatitis C virus RNA abundance by a liver-specific MicroRNA. Science. 2005; 309(5740):1577–81. doi:10.1126/science.1113329
20. Narbus CM, Israelow B, Sourisseau M, Michta ML, Hopcraft SE, Zeiner GM, et al. HepG2 cells express-ing microRNA miR-122 support the entire hepatitis C virus life cycle. Journal of virology. 2011; 85 (22):12087–92. doi:10.1128/JVI.05843-11PMID:21917968; PubMed Central PMCID: PMC3209320.
21. Jacobs JM, Diamond DL, Chan EY, Gritsenko MA, Qian W, Stastna M, et al. Proteome analysis of liver cells expressing a full-length hepatitis C virus (HCV) replicon and biopsy specimens of posttransplanta-tion liver from HCV-infected patients. Journal of virology. 2005; 79(12):7558–69. doi:10.1128/JVI.79. 12.7558-7569.2005PMID:15919910; PubMed Central PMCID: PMC1143647.
22. XUN Meng Z S-h, CAO Chun-xia, SONG Juan, SHAO Ming-ming, CHU Yong-lie. Proteomic analysis of HuH-7 cells harboring in vitro-transcribed fulllength hepatitis C virus 1b RNA. Acta pharmacologica Sinica. 2008; 29(6):720–7. doi:10.1111/j.1745-7254.2008.00789.xPMID:18501119
23. Harris D, Zhang Z, Chaubey B, Pandey VN. Identification of cellular factors associated with the 3'-non-translated region of the hepatitis C virus genome. Molecular & cellular proteomics: MCP. 2006; 5 (6):1006–18. doi:10.1074/mcp.M500429-MCP200PMID:16500930.
24. Tingting P, Caiyun F, Zhigang Y, Pengyuan Y, Zhenghong Y. Subproteomic analysis of the cellular pro-teins associated with the 3' untranslated region of the hepatitis C virus genome in human liver cells. Bio-chemical and biophysical research communications. 2006; 347(3):683–91. doi:10.1016/j.bbrc.2006. 06.144PMID:16842740.
25. Miao R, Wei J, Zhang Q, Sajja V, Yang J, Wang Q. Redifferentiation of human hepatoma cells (SMMC-7721) induced by two new highly oxygenated bisabolane-type sesquiterpenes. Journal of biosciences. 2008; 33(5):723–30. PMID:19179760.
26. Wu JM L J, Zhang L, Liang KH. Establishment and identification of LO2 cell line transfected by HBV genome. Zhonghua Gan Zang Bing Za Zhi. 2005; 13(9):702–3. PMID:16174468
27. Xin Z, Han W, Zhao Z, Xia Q, Yin B, Yuan J, et al. PCBP2 enhances the antiviral activity of IFN-alpha against HCV by stabilizing the mRNA of STAT1 and STAT2. PloS one. 2011; 6(10):e25419. doi:10. 1371/journal.pone.0025419PMID:22022391; PubMed Central PMCID: PMC3191149.
28. Wisniewski JR, Zougman A, Nagaraj N, Mann M. Universal sample preparation method for proteome analysis. Nature methods. 2009; 6(5):359–62. doi:10.1038/nmeth.1322PMID:19377485.
29. Ishii T, Teramoto S, Matsuse T. GSTP1 affects chemoresistance against camptothecin in human lung adenocarcinoma cells. Cancer letters. 2004; 216(1):89–102. doi:10.1016/j.canlet.2004.05.018PMID: 15500952.
30. Bheda A, Shackelford J, Pagano JS. Expression and functional studies of ubiquitin C-terminal hydro-lase L1 regulated genes. PloS one. 2009; 4(8):e6764. doi:10.1371/journal.pone.0006764PMID: 19707515; PubMed Central PMCID: PMC2729380.
31. Mak TN, Fischer N, Laube B, Brinkmann V, Metruccio MM, Sfanos KS, et al. Propionibacterium acnes host cell tropism contributes to vimentin-mediated invasion and induction of inflammation. Cellular microbiology. 2012; 14(11):1720–33. doi:10.1111/j.1462-5822.2012.01833.xPMID:22759266.
32. Cheng M, Si Y, Niu Y, Liu X, Li X, Zhao J, et al. High-throughput profiling of alpha interferon- and inter-leukin-28B-regulated microRNAs and identification of let-7s with anti-hepatitis C virus activity by target-ing IGF2BP1. Journal of virology. 2013; 87(17):9707–18. doi:10.1128/JVI.00802-13PMID:23824794;
PubMed Central PMCID: PMC3754137.
33. Liu X, Huang Y, Cheng M, Pan L, Si Y, Li G, et al. Screening and rational design of hepatitis C virus entry inhibitory peptides derived from GB virus A NS5A. Journal of virology. 2013; 87(3):1649–57. doi: 10.1128/JVI.02201-12PMID:23175359; PubMed Central PMCID: PMC3554153.
34. Morchang A, Panaampon J, Suttitheptumrong A, Yasamut U, Noisakran S, Yenchitsomanus PT, et al. Role of cathepsin B in dengue virus-mediated apoptosis. Biochemical and biophysical research com-munications. 2013; 438(1):20–5. doi:10.1016/j.bbrc.2013.07.009PMID:23867824.
35. Waggoner SA, Johannes GJ, Liebhaber SA. Depletion of the poly(C)-binding proteins alphaCP1 and alphaCP2 from K562 cells leads to p53-independent induction of cyclin-dependent kinase inhibitor (CDKN1A) and G1 arrest. The Journal of biological chemistry. 2009; 284(14):9039–49. doi:10.1074/ jbc.M806986200PMID:19211566; PubMed Central PMCID: PMC2666552.
36. Gilar M, Olivova P, Daly AE, Gebler JC. Orthogonality of separation in two-dimensional liquid chroma-tography. Analytical chemistry. 2005; 77(19):6426–34. doi:10.1021/ac050923iPMID:16194109.
37. Wang Y, Yang F, Gritsenko MA, Wang Y, Clauss T, Liu T, et al. Reversed-phase chromatography with multiple fraction concatenation strategy for proteome profiling of human MCF10A cells. Proteomics. 2011; 11(10):2019–26. doi:10.1002/pmic.201000722PMID:21500348; PubMed Central PMCID:
PMC3120047.
39. Casado-Vela J, Martinez-Esteso MJ, Rodriguez E, Borras E, Elortza F, Bru-Martinez R. iTRAQ-based quantitative analysis of protein mixtures with large fold change and dynamic range. Proteomics. 2010; 10(2):343–7. doi:10.1002/pmic.200900509PMID:20029838.
40. Bouchal P, Roumeliotis T, Hrstka R, Nenutil R, Vojtesek B, Garbis SD. Biomarker discovery in low-grade breast cancer using isobaric stable isotope tags and two-dimensional liquid chromatography-tan-dem mass spectrometry (iTRAQ-2DLC-MS/MS) based quantitative proteomic analysis. Journal of pro-teome research. 2009; 8(1):362–73. doi:10.1021/pr800622bPMID:19053527.
41. Zhu M, Dai S, McClung S, Yan X, Chen S. Functional differentiation of Brassica napus guard cells and mesophyll cells revealed by comparative proteomics. Molecular & cellular proteomics: MCP. 2009; 8 (4):752–66. doi:10.1074/mcp.M800343-MCP200PMID:19106087; PubMed Central PMCID:
PMC2667361.
42. Kim W, Lim SO, Kim JS, Ryu YH, Byeon JY, Kim HJ, et al. Comparison of proteome between hepatitis B virus- and hepatitis C virus-associated hepatocellular carcinoma. Clinical Cancer Research. 2003; 9 (15):5493–500. WOS:000187014200009. PMID:14654528
43. Zhu W, Smith JW, Huang CM. Mass spectrometry-based label-free quantitative proteomics. Journal of biomedicine & biotechnology. 2010; 2010:840518. doi:10.1155/2010/840518PMID:19911078; PubMed Central PMCID: PMC2775274.
44. Wang HX, Alvarez S, Hicks LM. Comprehensive Comparison of iTRAQ and Label-free LC-Based Quantitative Proteomics Approaches Using Two Chlamydomonas reinhardtii Strains of Interest for Bio-fuels Engineering. Journal of proteome research. 2012; 11(1):487–501. doi:10.1021/Pr2008225
WOS:000298827700042. PMID:22059437
45. Pileri P U Y, Campagnoli S, Galli G, Falugi F, Petracca R, Weiner AJ, Houghton M, Rosa D, Grandi G, Abrignani S. Binding of hepatitis C virus to CD81. science. 1998; 282(5390):938–41. doi:10.1126/ science.282.5390.938PMID:9794763
46. Scarselli E, Ansuini H, Cerino R, Roccasecca RM, Acali S, Filocamo G, et al. The human scavenger receptor class B type I is a novel candidate receptor for the hepatitis C virus. Embo Journal. 2002; 21 (19):5017–25. doi:10.1093/Emboj/Cdf529WOS:000178502600002. PMID:12356718
47. Aly HH, Watashi K, Hijikata M, Kaneko H, Takada Y, Egawa H, et al. Serum-derived hepatitis C virus infectivity in interferon regulatory factor-7-suppressed human primary hepatocytes. Journal of hepatol-ogy. 2007; 46(1):26–36. doi:10.1016/j.jhep.2006.08.018PMID:17112629.
48. Evans MJ, von Hahn T, Tscherne DM, Syder AJ, Panis M, Wolk B, et al. Claudin-1 is a hepatitis C virus co-receptor required for a late step in entry. Nature. 2007; 446(7137):801–5. doi:10.1038/nature05654
PMID:17325668.
49. Ploss A, Evans MJ, Gaysinskaya VA, Panis M, You H, de Jong YP, et al. Human occludin is a hepatitis C virus entry factor required for infection of mouse cells. Nature. 2009; 457(7231):882–6. doi:10.1038/ nature07684PMID:19182773; PubMed Central PMCID: PMC2762424.
50. Liu S, McCormick KD, Zhao W, Zhao T, Fan D, Wang T. Human apolipoprotein E peptides inhibit hepa-titis C virus entry by blocking virus binding. Hepatology. 2012; 56(2):484–91. doi:10.1002/hep.25665
PMID:22334503; PubMed Central PMCID: PMC3362681.
51. Maqbool MA, Imache MR, Higgs MR, Carmouse S, Pawlotsky JM, Lerat H. Regulation of hepatitis C virus replication by nuclear translocation of nonstructural 5A protein and transcriptional activation of host genes. Journal of virology. 2013; 87(10):5523–39. doi:10.1128/JVI.00585-12PMID:23468497;
PubMed Central PMCID: PMC3648193.
52. Li Q, Zhang YY, Chiu S, Hu Z, Lan KH, Cha H, et al. Integrative functional genomics of hepatitis C virus infection identifies host dependencies in complete viral replication cycle. PLoS pathogens. 2014; 10(5): e1004163. doi:10.1371/journal.ppat.1004163PMID:24852294; PubMed Central PMCID:
PMC4095987.
53. Lin LT, Noyce RS, Pham TN, Wilson JA, Sisson GR, Michalak TI, et al. Replication of subgenomic hep-atitis C virus replicons in mouse fibroblasts is facilitated by deletion of interferon regulatory factor 3 and expression of liver-specific microRNA 122. Journal of virology. 2010; 84(18):9170–80. doi:10.1128/ JVI.00559-10PMID:20592082; PubMed Central PMCID: PMC2937658.
54. Chang J, Guo JT, Jiang D, Guo H, Taylor JM, Block TM. Liver-specific microRNA miR-122 enhances the replication of hepatitis C virus in nonhepatic cells. Journal of virology. 2008; 82(16):8215–23. doi: 10.1128/JVI.02575-07PMID:18550664; PubMed Central PMCID: PMC2519557.
55. Wyss M, Kaddurah-Daouk R. Creatine and creatinine metabolism. Physiological reviews. 2000; 80 (3):1107–213. PMID:10893433.
57. Yin L, Krantz B, Russell NS, Deshpande S, Wilkinson KD. Nonhydrolyzable diubiquitin analogues are inhibitors of ubiquitin conjugation and deconjugation. Biochemistry. 2000; 39(32):10001–10. PMID: 10933821.
58. Kwon J, Wang YL, Setsuie R, Sekiguchi S, Sato Y, Sakurai M, et al. Two closely related ubiquitin C-ter-minal hydrolase isozymes function as reciprocal modulators of germ cell apoptosis in cryptorchid testis. The American journal of pathology. 2004; 165(4):1367–74. doi:10.1016/S0002-9440(10)63394-9
PMID:15466400; PubMed Central PMCID: PMC1618639.
59. Ripoli M, Barbano R, Balsamo T, Piccoli C, Brunetti V, Coco M, et al. Hypermethylated levels of E-cad-herin promoter in Huh-7 cells expressing the HCV core protein. Virus research. 2011; 160(1–2):74–81.
doi:10.1016/j.virusres.2011.05.014PMID:21640770.
60. Lambert MP, Paliwal A, Vaissiere T, Chemin I, Zoulim F, Tommasino M, et al. Aberrant DNA methyla-tion distinguishes hepatocellular carcinoma associated with HBV and HCV infecmethyla-tion and alcohol intake. Journal of hepatology. 2011; 54(4):705–15. doi:10.1016/j.jhep.2010.07.027PMID:21146512.
61. Zhao Y, Wang Q, Deng X, Shi P, Wang Z. Quantitative assessment of the association between GSTP1 gene Ile105Val polymorphism and susceptibility to hepatocellular carcinoma. Tumour biology: the jour-nal of the Internatiojour-nal Society for Oncodevelopmental Biology and Medicine. 2013; 34(4):2121–6. doi: 10.1007/s13277-013-0695-1PMID:23765758.
62. Teo CS, Chu JJ. Cellular Vimentin Regulates Construction of Dengue Virus Replication Complexes through Interaction with NS4A Protein. Journal of virology. 2014; 88(4):1897–913. doi:10.1128/JVI. 01249-13PMID:24284321; PubMed Central PMCID: PMC3911532.
63. Ghosh S, Ahrens WA, Phatak SU, Hwang S, Schrum LW, Bonkovsky HL. Association of filamin A and vimentin with hepatitis C virus proteins in infected human hepatocytes. Journal of viral hepatitis. 2011; 18(10):e568–77. doi:10.1111/j.1365-2893.2011.01487.xPMID:21914078.
64. Lee CF, Ling ZQ, Zhao T, Lee KR. Distinct expression patterns in hepatitis B virus- and hepatitis C virus-infected hepatocellular carcinoma. World journal of gastroenterology: WJG. 2008; 14(39):6072–
7. PMID:18932288; PubMed Central PMCID: PMC2760187.
65. Nitahara-Kasahara Y, Fukasawa M, Shinkai-Ouchi F, Sato S, Suzuki T, Murakami K, et al. Cellular vimentin content regulates the protein level of hepatitis C virus core protein and the hepatitis C virus production in cultured cells. Virology. 2009; 383(2):319–27. doi:10.1016/j.virol.2008.10.009PMID: 19013628.
66. Liu S, Hao Q, Peng N, Yue X, Wang Y, Chen Y, et al. Major vault protein: a virus-induced host factor against viral replication through the induction of type-I interferon. Hepatology. 2012; 56(1):57–66. doi: 10.1002/hep.25642PMID:22318991.
67. Blais DR, Lyn RK, Joyce MA, Rouleau Y, Steenbergen R, Barsby N, et al. Activity-based Protein Profil-ing Identifies a Host Enzyme, Carboxylesterase 1, Which Is Differentially Active durProfil-ing Hepatitis C Virus Replication. Journal of Biological Chemistry. 2010; 285(33):25602–12. doi:10.1074/jbc.M110. 135483WOS:000280682400054. PMID:20530478
68. Diao S, Zhang JF, Wang H, He ML, Lin MC, Chen Y, et al. Proteomic identification of microRNA-122a target proteins in hepatocellular carcinoma. Proteomics. 2010; 10(20):3723–31. doi:10.1002/pmic. 201000050PMID:20859956.
69. Guicciardi ME, Deussing J, Miyoshi H, Bronk SF, Svingen PA, Peters C, et al. Cathepsin B contributes to TNF-alpha-mediated hepatocyte apoptosis by promoting mitochondrial release of cytochrome c. The Journal of clinical investigation. 2000; 106(9):1127–37. doi:10.1172/JCI9914PMID:11067865;
PubMed Central PMCID: PMC301415.
70. Lan KH, Sheu ML, Hwang SJ, Yen SH, Chen SY, Wu JC, et al. HCV NS5A interacts with p53 and inhib-its p53-mediated apoptosis. Oncogene. 2002; 21(31):4801–11. doi:10.1038/sj.onc.1205589PMID: 12101418.