Journal of Engineered Fibers and Fabrics
11
http:/ / w w w .jeffjournal.orgVolum e 4, Issue 4 – 20 0 9
In fluen ce of H ydration State on Perm eation Testin g an d
Vapor Tran sport Properties of Protective Clothing Layers
Phillip W. Gibson, Ph.D, and Heidi L. Schreuder-Gibson, Ph.D.
U.S. Army Natick Soldier Research, Development, and Engineering Center, Natick, MA, USA
Correspondence:
Phillip W. Gibson, email: [email protected]
NamePPhillip i Schreuder-Gibson U.S. Army Natick Soldier Research, Development, & Engineering Center, Natick, Massachusetts, to: Phillip Gibson, email: [email protected]
ABSTRACT
Protective clothing systems composed of permselective polymer film laminates are an alternative to standard air-permeable garments based on activated carbon. These polymer layers are designed with high water vapor permeation rates and low permeation of chemical warfare agents. Polymer films that have a significant water vapor flux usually also have an affinity for water, and will hydrate and swell significantly at high humidity levels. The polymer film’s increase in water content has the potential to affect the transport rate of chemical warfare agents in vapor and liquid form, and usually also has a large effect on the intrinsic water vapor permeability of the membrane.
INTRODUCTION
Protective clothing systems that include polymer films as part of a multilayer laminate are now available as alternatives to standard air-permeable garments based on activated carbon. Many varieties of polymer membranes that include permselective or reactive polymer components continue to be developed. Most of these polymer films are designed to have high water vapor permeation rates and low permeation of chemical warfare agents. A high water vapor transport rate is important for reducing the heat stress potential of chemical and biological protective clothing. Polymer films that have a significant water vapor flux usually also have an affinity for water, and will hydrate and swell significantly at high humidity levels. High humidity may be due to the environment, or due to high sweating rates of the person wearing the protective clothing system.
Water uptake in the polymer film has the potential to affect the transport rate of chemical warfare agents in vapor and liquid form, and usually also has a large effect on the intrinsic water vapor permeability of the membrane. Test methods that have been developed
for air-permeable sorptive layers are not designed to probe the effect of different hydration levels of a polymer film. Polymer films which have a mass transfer resistance that is very sensitive to water content are greatly affected by the relative humidity of the testing conditions. In particular, testing with a dry gas sweep on one side of the membrane (0% relative humidity), can dry out the film so much on one side that the membrane becomes a significant barrier to water transport. Testing with a dry gas sweep on one side of the sample is a common practice in permeation testing of films and membranes. For films intended for clothing applications, this test condition of 0% relative humidity is not reasonable or realistic. Although testing with a dry gas sweep on one side of a polymer membrane is convenient for experimental and theoretical reasons, it should be supplemented by testing that produces a realistic state of hydration in the film. A polymer membrane swollen with water is usually much more permeable to chemical vapors than a dry polymer membrane. These realistic conditions apply to both water vapor permeability and to chemical vapor permeability.
EXPERIMENTAL
Materials
Journal of Engineered Fibers and Fabrics
12
http:/ / w w w .jeffjournal.orgVolum e 4, Issue 4 – 20 0 9
hydration levels). Several materials added for comparison purposes showed no chemical agent simulant permeation at any hydration level. These materials include pure PVA-Am coated onto an ePTFE substrate, Nafion, W.L. Gore’s Chempak membrane laminate, and the standard military chemical protective garment fabric with activated carbon spheres. Other materials with low barrier properties were also included, such as an untreated ePTFE membrane, and two developmental materials that had been intended as permselective films: a sulfonated pentablock copolymer and a laminated elastomeric polymer film (both compositions proprietary).
Permeation Test Method
The permeant was chloroethyl ethyl sulfide (CEES), commonly called half-mustard, which is a simulant for mustard agent. The test method used a stagnant head space, with a specified amount of liquid applied in the small stagnant volume above the sample, and a gas sweep flow underneath the sample to carry any permeant which diffused through the sample to a detector. Drops of CEES were placed on a glass fiber filter suspended above the test sample. This glass filter layer was used to wick and spread the droplets of the liquid evenly for the vapor diffusion test. A stainless steel screen supported the filter paper, and prevented liquid from wicking into the test sample by separating the upper surface of the test sample from the filter paper. This test method sometimes also includes a very thin microporous expanded polytetrafluorethylene (ePTFE) layer placed on the surface of the test sample to ensure that no liquid comes in contact with the sample surface, and to help ensure uniform diffusion and vapor exposure down to the sample. This particular series of tests did not use the ePTFE layer. The top opening of the diffusion cell was closed with a stopper, and the test began with an air sweep of the underside of the sample to a flame ionization detector (FID) or a photo-ionization detector (PID). The closed test cell volume above the test sample has no ventilating air flow, and is a small-volume stagnant air space that becomes saturated with the test liquid and serves as a vapor source for the top surface of the test sample. The air sweep was controlled to a specified relative humidity -- most commonly 80%. Specific experiments to measure the effect of polymer water content on permeation behavior used relative humidity levels of 0, 20, 50, 80, and 95%. Prior to the application of the CEES liquid to the test cell, the sample was allowed to equilibrate in the humidified sweep flow for a period of 1 to 10 hours, depending on its anticipated water content as determined previously from the measured water vapor sorption
isotherm. Figure 1 shows a schematic of the test system and detail of the test cell. More details on the test method are available in Reference 1.
(a)
(b)
FIGURE 1. Stagnant head space vapor diffusion cell for finite-source liquid/vapor challenge with sweep flow. (a) system schematic; (b) cell detail.
Test Conditions: Temperature = 30°C, dry air flow sweep flow rate = 100 cm³/min as set from mass flow controller (reference conditions of 0°C), mass flow rate of 0.002156 g/s, sample exposed area = 2.85 cm². 3 L of CEES (3.2 mg) was applied to the porous glass fiber filter pad above the test sample. The liquid loading produces a challenge level of 11 g/m², which is close to the challenge level of 10 g/m² used in several standard test methods.
The mass flux of vapor across the sample in these types of tests is calculated by:
m
/A = QC / A (1)m
= mass flux per unit area across the sample (g/s) A = sample area (cm²)Q = gas flow rate (cm³/s)
C = concentration change (g/cm³) in sweep gas as it flows across the sample (same as measured concentration exiting cell if the gas entering the cell contains no vapor).
Journal of Engineered Fibers and Fabrics
13
http:/ / w w w .jeffjournal.orgVolum e 4, Issue 4 – 20 0 9
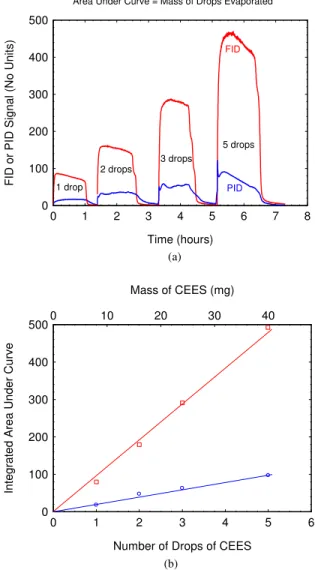
evaporated and was carried to the detector. Since the amount of liquid was known, the area under the curve was equivalent to the mass of the liquid. The plot of volume or mass of the test liquid versus the area under the curve should be linear if the system is performing properly. Each FID detector differs slightly in their signal response, so each detector must be calibrated separately.
0 100 200 300 400 500
0 1 2 3 4 5 6 7 8
5 drops 3 drops
2 drops
1 drop
Area Under Curve = Mass of Drops Evaporated
PID
FID
Time (hours)
F
ID or
PI
D Signal (
N
o Units)
(a)
0 100 200 300 400 500
0 1 2 3 4 5 6
0 10 20 30 40
Number of Drops of CEES
In
te
gr
at
ed Ar
ea
Unde
r
Cur
v
e
Mass of CEES (mg)
(b)
FIGURE 2. (a) Detector output for various amounts of liquid CEES (8 mg drop size) injected into test cell (no sample); (b) Integrated area under detector signal curve. The response for both a typical FID (red) and a PID (blue) are shown, but only FIDs were used for the work reported here.
The known amounts of liquid may be used to convert the detector output to concentration units such as g/cm³ or ppm. This calibration is repeated for each individual FID detector at every relative humidity test condition. The intent of the liquid application is to produce a vapor challenge, but the concentration and duration of the challenge is dependent on whether the
liquid remains in drop form (as on the ePTFE substrate), or wicked out into the glass fiber filter pad, which maximized surface area, and causes evaporation to take place much faster.
Water Vapor Sorption
A Cahn 1000 microbalance was used to measure vapor content in polymers and adsorbents as a function of concentration. A computer controls the vapor concentration flowing past the sample by combining a saturated flow with a dry gas flow to produce the desired concentration. The data acquisition system records the sample weight and temperature as a function of time. The data may be used for kinetic studies (time for the sample to equilibrate) and the equilibrium weight content at various vapor concentrations (sorption isotherm). Any desired number of setpoints may be specified in terms of vapor concentration, time, and gas flow rate. For this set of measurements, the sorption balance was used to measure the water vapor sorption isotherm at a temperature of 30°C, using a gas flow rate of 1000 cm³/minute, for 15 setpoints over the range of 0% to 98% r.h., with the time at each humidity condition ranging from 3 to 4 hours.
(a)
0 0.05 0.10 0.15 0.20
0 0.2 0.4 0.6 0.8 1.0 Wool Fabric
Nafion Film Cotton Fabric
Relative Humidity
Wat
e
r Upt
a
ke (g of
wat
e
r /
g
of
dry sample)
(b)
Journal of Engineered Fibers and Fabrics
14
http:/ / w w w .jeffjournal.orgVolum e 4, Issue 4 – 20 0 9
Water Vapor Transport: Diffusion Test Conditions for Membranes and Films
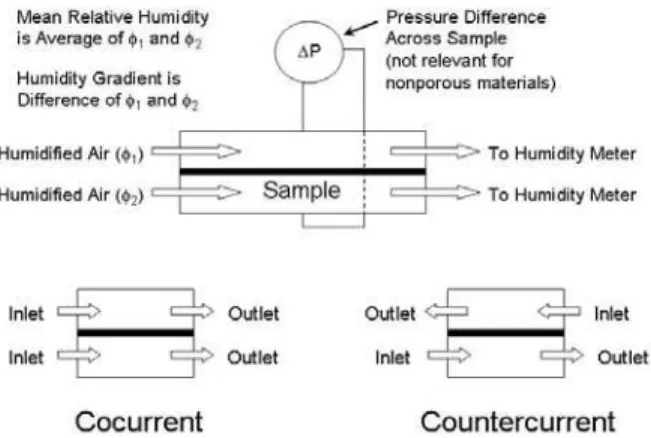
Figure 4 shows the test configuration used for determining the “breathability” of polymer membranes and laminates [2-3].
FIGURE 4. Schematic of test cell used for water vapor diffusion testing.
Air at two different relative humidities flows over the two sides of the test sample, and humidity detectors measure how much water vapor is transported through the sample. Results may be shown in terms of flux (grams/square meter/day) or water vapor diffusion resistance, which has the units of s/m. The resistance units are preferred because results obtained at different environmental conditions can be easily compared. The lower the diffusion resistance, the more water vapor permeates through the material. Testing is done at a constant relative humidity (R.H.) gradient, but the mean relative humidity is increased at each setpoint. Mean relative humidity is the average of the incoming relative humidity on the two sides of the sample. Higher mean relative humidity means that a hydrophilic membrane contains more water than at a lower mean relative humidity. Most hydrophilic membranes have a lower resistance to water vapor diffusion when they contain more water in their structure. Porous materials such as most textiles, or microporous membranes, have a nearly constant water vapor diffusion resistance under the same conditions because water vapor is diffusing through the air in the pore spaces, rather than diffusing through the polymer film.
TABLE I
Standard Test Conditions – Water Vapor Diffusion
Temperature = 30°C; Gas Flow Rate 2000 cm³/minute (cocurrent); Sample Area = 10 cm²
Setpoint R.H. R.H. Mean Humidity
# on on R.H. Gradient
Top Bottom
1 0.55 0.05 0.30 0.50
2 0.65 0.15 0.40 0.50
3 0.75 0.25 0.50 0.50
4 0.85 0.35 0.60 0.50
5 0.95 0.45 0.70 0.50
Typical Water Vapor Diffusion Results
Figure 5 (a, b) shows typical “breathability” results for a wide variety of commercially available membrane-based clothing materials. These materials can serve as benchmarks for acceptable levels of water diffusion properties required for membranes incorporated into chemical and biological protective clothing. 0 100 200 300 400 500 600 700 800 900 1000 1100 1200 1300 1400 1500 1600 1700 1800
0 0.1 0.2 0.3 0.4 0.5 0.6 0.7 0.8 0.9 1.0
Schoeller Dryskin Extreme (Schoeller Textiles) Schoeller WB-Formula (Schoeller Textiles) Membrain from Marmot Conduit from Mountain Hardwear
Sympatex Laminate
Gore-Tex (Standard)
Entrant Dermizax (Toray Industries) The North Face "Hydroseal" (Burlington "XALT") Gore-Tex XCR Nextec from Patagonia "Velocity" Lowe Alpine Triplepoint Ceramic Omni-Tech "Titanium" Columbia Sportwear
Entrant GII XT Laminate (Toray Industries) EVENT Laminate (BHA Technologies) Expanded PTFE Membrane
Mean Relative Humidity (Average of Humidity on Both Sides of Sample) (1.0 = 100% r.h.)
W a te r V a po r Di ffu sio n Re sist an ce ( s /m ) ( L o w e r R e si sta n c e is M o re " B re at ha bl e" ) (a) 0 500 1000 1500 2000 2500 3000 3500 4000 4500 5000 5500 6000 6500 7000 7500
0 0.1 0.2 0.3 0.4 0.5 0.6 0.7 0.8 0.9 1.0
Schoeller Dryskin Extreme (Schoeller Textiles) Schoeller WB-Formula (Schoeller Textiles) Membrain from Marmot Dermizax (Toray Industries)
The North Face "Hydroseal" (Same as Burlington "XALT")
Sympatex (Akzo-Nobel) Gore-Tex (Standard) Conduit from Mountain Hardware Lowe Alpine
Triple Point Ceramic
Gore-Tex XCR EVENT Laminate
(BHA Technologies) Expanded PTFE Membrane
Entrant GII XT Laminate (Toray Industries)
Nextec from Patagonia "Velocity"
Omni-Tech "Titanium" Columbia Sportwear
Mean Relative Humidity (Average of Humidity on Both Sides of Sample) ( 1.0 = 100% r.h.)
Wa ter Va po r F lu x ( g /m 2-d a y ) (b)
Journal of Engineered Fibers and Fabrics
15
http:/ / w w w .jeffjournal.orgVolum e 4, Issue 4 – 20 0 9
The commercial waterproof/breathable fabric laminates in Figure 5 illustrate two types of permeation behavior. Materials that depend on water vapor to diffuse through the pore spaces of the membrane and fabric show little dependence on hydration level (essentially flat lines in Figure 5). Materials that have a solid water-permeable polymer layer somewhere in the laminate have water vapor transport properties that are dependent on hydration level (lines with significant slope in Figure 5).
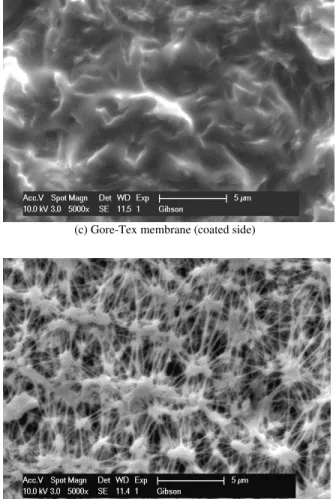
Figure 6 shows typical examples of the membrane element responsible for these differences in transport behavior. Figure 6 (a,b) shows examples of porous expanded polytetrafluoroethylene membranes. These membranes are bonded between protective fabric layers to provide a barrier to liquid water penetration, while the extensive pore spaces in the membrane allow high water vapor flux. Figure 6 (c, d) shows an example of a continuous water vapor permeable polymer layer coated onto an ePTFE supporting layer. The polymer coating layer allows more water vapor transport when it is at higher hydration levels.
(a) eVent ePTFE film
(b) Tetratex ePTFE film
(c) Gore-Tex membrane (coated side)
(d) Gore-Tex membrane (uncoated side)
FIGURE 6. Scanning electron microscope images of typical membranes used in waterproof breathable fabric laminates. Images are of the membrane layer only (bonded supporting and protective textile layers not shown).
“Mean Relative Humidity”
Journal of Engineered Fibers and Fabrics
16
http:/ / w w w .jeffjournal.orgVolum e 4, Issue 4 – 20 0 9
temperature at the human skin surface, and the vapor pressure and temperature of the outside environment. It is possible to measure the water content of polymer films by using the same humidity on both sides of the film, or alternatively with a humidity gradient across the film. It is difficult to measure the “gradient isotherm” in the normal Cahn balance setup, but such measurements may be performed by conditioning a polymer sample in the water vapor test cell (Figure 4) in the following manner: after the sample has equilibrated at each condition of a particular humidity gradient, it can be quickly removed, weighed on a laboratory balance, and replaced in the permeation cell for the next set of humidity conditions.
Figure 7 shows a comparison of the normal water sorption isotherm and the “gradient isotherm” as measured for a Nafion polymer film. There is good agreement between the two measurements. This suggests that the use of the “mean relative humidity” as an approximation of the polymer water content defined by the normally-measured water vapor sorption isotherm is valid.
0 0.05 0.10 0.15 0.20
0 0.2 0.4 0.6 0.8 1.0
Same Humidity on Both Sides of Sample Humidity Gradient Across Sample (Gradient Isotherm)
Water Activity = Relative Humidity = Mean Relative Humidity
W
a
ter Content (g of wa
ter
/g of d
ry po
ly
m
e
r)
FIGURE 7. Water vapor sorption isotherms for Nafion determined by using the same humidity on both sides of the sample, and also with a humidity gradient across the sample.
RESULTS
Water Vapor Transport
Figure 8 shows the water vapor transport properties of a variety of materials, as tested under a constant humidity gradient of 0.50 (50%), but with varying mean relative humidity. The materials include porous air-permeable layers, as well as several polymer films and laminates. The porous layers (ePTFE film, chemical protective suit shell fabric, and the combination of the chemical suit shell fabric and the activated carbon bead liner) all show a
constant water vapor diffusion resistance. This is due to the fact that water vapor is diffusing through the interconnected air-filled pore spaces in their structure.
In contrast, the polymer membranes and laminates all show much higher water vapor transport rates when they are well hydrated (higher mean relative humidity) than when dry. At high mean relative humidity, several of the polymer layers have better water vapor transport rates than the standard chemical protective suit material. It is important to have knowledge of this behavior, since standard test methods which only use a single humidity condition to evaluate or rank materials may completely reverse material rankings depending on whether the test method produces low or high mean relative humidity test conditions [4].
100 200 500 1000 2000 3000
0 0.2 0.4 0.6 0.8 1.0
Elastomeric polymer membrane laminate
PEI / PVA-Am coated on ePTFE laminated to nylon fabric W.L. Gore Chempack Laminate
PVA-Am coated on ePTFE with mesh reinforcement Gore-Tex XCR Laminate
(Example of a Commercial "Breathable" Membrane Laminate) Standard Chemical Protective Suit
(Woven Shell Fabric with Separate Carbon Bead Liner) Sulfonated pentablock copolymer
Chemical Protective Suit Shell Fabric Nafion
ePTFE
Mean Relative Humidity
Wa
ter V
a
po
r D
if
fus
ion R
e
s
is
tanc
e (s
/m
)
(L
og
Sca
le)
FIGURE 8. Water vapor diffusion resistance of various polymer films, textiles, and laminates.
CEES Permeation
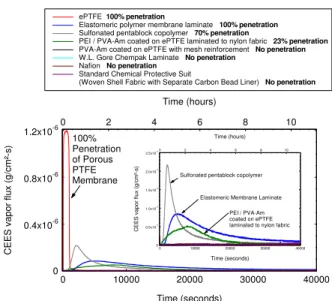
Permeation of half-mustard simulant (CEES) through a variety of materials is shown in Figure 9. These results are at the single humidity condition of 80% r.h., 30°C, and liquid CEES loading of 11 g/m².
Journal of Engineered Fibers and Fabrics
17
http:/ / w w w .jeffjournal.orgVolum e 4, Issue 4 – 20 0 9
0 0.4x10⁻⁶ 0.8x10⁻⁶ 1.2x10⁻⁶
0 10000 20000 30000 40000
0 2 4 6 8 10
ePTFE 100% penetration
Elastomeric polymer membrane laminate 100% penetration
Sulfonated pentablock copolymer 70% penetration
PEI / PVA-Am coated on ePTFE laminated to nylon fabric 23% penetration
PVA-Am coated on ePTFE with mesh reinforcement No penetration
W.L. Gore Chempak Laminate No penetration
Nafion No penetration
Standard Chemical Protective Suit
(Woven Shell Fabric with Separate Carbon Bead Liner) No penetration
100% Penetration of Porous PTFE Membrane
Time (seconds)
C
EES vap
o
r fl
ux (g
/cm²-s
)
Time (hours)
0 0.5x10⁻⁷
1.0x10⁻⁷
1.5x10⁻⁷
2.0x10⁻⁷
2.5x10⁻⁷
0 10000 20000 30000 40000
0 2 4 6 8 10
PEI / PVA-Am coated on ePTFE laminated to nylon fabric Sulfonated pentablock copolymer
Elastomeric Membrane Laminate
Time (seconds)
C
E
E
S
v
apor f
lux
(g
/c
m
²-s
)
Time (hours)
FIGURE 9. CEES permeation through materials at 80% relative humidity. Inset graph reduces y-axis range to better show permeation behavior of three materials of interest.
These permeation results are generated with the stagnant head-space finite-source screening test described previously in the experimental section. This test is not ideal for determining the true transport properties of polymer membranes or laminates. The permeation curves shown in Figure 9 do not allow discrimination between different transport mechanisms. For example, since the liquid challenge is confined in the head space above the sample, it would be expected that eventually all the permeant would diffuse through a non-chemisorptive / non-reactive polymer layer. This is the case for the elastomeric permselective polymer laminate, but is not observed for the sulfonated pentablock copolymer film, or for the PEI / PVA-Am coated fabric. The results suggest that these two materials are adsorbing or reacting with the CEES in some way, thus immobilizing the penetrant in the polymer film. Other possibilities, such as leakage of the CEES vapor from the stagnant air volume, or adsorption/reaction of the CEES with the materials in the head space, are less probable, since the elastomeric permselective membrane laminate (as well as a wide variety of other polymer films tested but not shown) allow all the CEES to permeate over time spans of several hours.
For the PEI / PVA-Am coated fabric, there is the additional possibility that the polymer layer is reacting with the CEES, and the detector is not measuring CEES vapor, but reaction products due to CEES decomposition. Although these polymers have been shown to be reactive with nerve agent surrogates such diisopropyl fluorophosphate (DFP), similar chemical depletion of CEES within these
polymers has not been reported to date [5]. However, it has been reported that CEES will break down in the presence of water on glass filters to a small amount of volatile product and a large amount may convert to a non volatile sulfonium product [1]. Materials that did not allow any permeation presumably are providing protection by different mechanisms: e.g., the standard chemical protective material adsorbed the CEES onto the activated carbon, while the Nafion, W.L. Gore Chempak, and PVA-Am acted more as barrier films.
As a screening test, the stagnant head-space finite-source permeation setup produces trends that suggest a significant effect of hydration level on chemical agent simulant through protective clothing materials. The PEI / PVA-Am coated fabric was the best material for illustrating this effect, in that it had measurable permeation levels at all hydration states. The other materials shown in Figure 9 were either very poor barriers, or complete barriers, and did not change their permeation properties significantly at different humidity levels.
Figure 10 shows that the CEES permeation behavior for the PVA-Am coated fabric was significantly affected by different humidity levels. Testing at high humidities resulted in much higher CEES penetration than at lower humidity conditions.
The permeation curves for the PVA-Am coated fabric are all very similar in duration. CEES breakthrough occurs very quickly, and there is little difference in the time during which penetration takes place. The level of hydration seems to have little effect on the rate at which CEES penetrates, but does affect the total amount which permeates the sample.
0 0.4x10⁻⁷ 0.8x10⁻⁷ 1.2x10⁻⁷
0 5000 10000 15000 20000
0 1 2 3 4 5
Scale expanded to show full CEES calibration curve 3 L (0.00321 g) of CEES on glass filter --calibration curve (complete penetration)
0% r.h. 20% r.h. 50% r.h. 80% r.h. 95% r.h.
Time (seconds)
C
EES v
apor
flux
(g
/c
m²-s
)
Time (hours)
0 0.5x10⁻⁶
1.0x10⁻⁶
1.5x10⁻⁶
0 5000 10000 15000 20000 Time (seconds)
C
E
E
S
v
a
p
o
r fl
u
x
(g
/c
m
²-s
)
Journal of Engineered Fibers and Fabrics
18
http:/ / w w w .jeffjournal.orgVolum e 4, Issue 4 – 20 0 9
Figure 11 shows a general correlation between increasing water vapor permeability (flux), CEES penetration, and water content (uptake) as humidity increases. Test and evaluation methods to characterize the chemical resistance of protective clothing materials based on permselective and reactive polymer layers need to consider test methods that produce a realistic state of hydration in the test samples.
0 20 40 60 80
0 20 40 60 80 100
0 1000 2000 3000 4000
Water Vapor Flux
Water Uptake CEES Penetration
Relative Humidity or Mean Relative Humidity (%)
Percent CEES
Penet
rat
ion
or
P
e
rc
en
t W
a
te
r
Up
take
W
a
te
r V
apo
r F
lux
(g
/m
²-d
a
y
)
FIGURE 11. CEES penetration, water uptake, and water vapor flux are generally correlated with relative humidity test conditions.
The stagnant head-space finite-source method is a convenient screening test but is not ideal for directly measuring in a controlled way the effect of hydration level upon permeation behavior. Parallel testing using simulant vapor in a continuous stream (Figure 12) can provide steady-state permeation behavior of polymer films. This can correct some of the deficiencies (particularly lack of mechanistic knowledge) present in the stagnant head space test method described in the previous section. This test method is still being refined, but some preliminary measurements that confirm hydration-level-dependent permeation behavior seen in the previous section are summarized below.
FIGURE 12. Dual flow permeation test with CEES vapor source for simultaneous CEES and water vapor permeation testing of polymer membranes.
The dual flow apparatus produces a constant vapor concentration on one side of the sample, and allows time-dependent concentration measurements on the sweep side. This allows us to get both a steady-state permeation coefficient, and also some measure of the diffusion coefficient, which we can extract from time-lag analysis of permeation following a concentration change in the vapor challenge.
The material used for the dual-flow permeation was the same material from the stagnant-head permeation cell study: ripstop nylon, laminated with a porous expanded polytetrafluoroethylene (ePTFE) film, and then coated with a blend of poly(vinyl alcohol – vinylamine) (PVA-Am) and poly(ethyleneimine) (PEI). As mentioned previously, the PEI/ PVA-Am coated fabric allowed measurable permeation of the chemical agent simulant, even at low hydration levels (many of the other materials are good barriers at low hydration levels).
The CEES vapor concentration was assumed constant due to a nominal flow of 30 cc/min through the CEES bubbler. Relative humidity of the air flows through the top and bottom of the cell was adjusted by the relative flow rates of the dry and saturated air streams. The top CEES flow of 30 cc/min was assumed to be part of the dry component of the air flow, so the highest humidity that could be achieved on the top flow was 70% r.h. (70 cc/min of water-saturated flow mixed with 30 cc/min of CEES-saturated dry air). Lower humidities were achieved by adding in an extra dry flow from another flow controller to the 30 cc/min of CEES flow, and decreasing the water-saturated flow to maintain a total gas flow rate of 100 cc/min. The lower flow humidity was controlled by simple mixing of the dry and saturated flows; thus higher humidities could be achieved in the bottom sweep flow (the total flow for the bottom sweep was also 100 cc/min). This is reflected in the final dual flow humidity test condition where the humidity of the bottom sweep flow was 95% r.h., but the humidity of the flow over the top of the sample was 70% r.h. Otherwise, the relative humidity on the top and bottom of the sample were identical.
Journal of Engineered Fibers and Fabrics
19
http:/ / w w w .jeffjournal.orgVolum e 4, Issue 4 – 20 0 9
0 50 100 150 200
0 20 40 60 80 100
95/70
70/70
50/50 20/20
0/0
Sweep Flow Humidity
FID Sens or f o r Sweep Flo w 2000 2200 2400 2600 2800 3000
0 20 40 60 80 100
Relative Humidity F ID Sens or f o r C E ES F low
FIGURE 13. Permeation of CEES vapor through PEI/ PVA-Am coated fabric in dual flow apparatus. Inset graph is FID sensor response for the CEES vapor carried in various humidity air flows over the top surface of the sample, to show sensor response to air humidity levels (referenced to bottom humidity). Annotations refer to humidity on bottom flow / humidity in top flow.
Dry Gas Sweep Influence on Testing Permeation Properties of Polymer Films
Polymer films with a mass transfer resistance that changes substantially with water content are very sensitive to testing conditions. In particular, testing with a dry gas sweep on one side of the membrane (0% r.h.), can dry out the film to such a degree on one side that the membrane becomes a significant barrier to water transport. For films intended for clothing applications, this test condition of 0% r.h. is not reasonable. Although testing with a dry gas sweep on one side of a polymer membrane is convenient for experimental and theoretical reasons, it should be supplemented by testing that produces a realistic state of hydration in the film. These realistic conditions apply to both water vapor permeability and to chemical vapor permeability. A polymer membrane swollen with water is usually much more permeable to chemical vapor than a dry polymer membrane.
A convenient method for looking at the effect of a dry gas sweep is the “dual-flow” permeation cell shown in Figure 14 (described previously in the Experimental section).
FIGURE 14. Dual-flow permeation cell (vertical scale expanded). The schematic is shown in the form of a computational fluid dynamic simulation of gas flow and concentration contours during the permeation experiment [6].
Figure 15 shows a PVA-Am film, 30 m thick, tested with three different types of setpoints (A, B, and C listed below). The conditions with a dry gas sweep (setpoints that produce low water content in the membrane), result in very little water transport through the film.
A. The constant gradient method (blue curve) uses a constant humidity gradient of 0.50 (50%) difference across the film. This set of conditions is useful because the flux will also be constant if the film does not change its properties according to hydration state. In this case, the M12 film does not become very permeable until the mean relative humidity reaches about 0.40.
B. The most severe condition produced by holding one side at 0.0 and increasing the humidity on the other side (green curve), shows that the film does not become permeable until a mean humidity of 0.45 is reached.
C. The method of maximizing the gradient by holding one side at a high humidity, and gradually increasing the sweep humidity (black curve), would also be a reasonable way to test. However, the gradient and the mean humidity are both increasing in this set of conditions, unlike the constant gradient approach. 0 500 1000 1500 2000
0 0.1 0.2 0.3 0.4 0.5 0.6 0.7 0.8 0.9 1.0
# Top Bottom 1 .50 .00 2 .60 .00 3 .70 .00 4 .80 .00 5 .90 .00 6 1.00 .00 7 .95 .00 8 .90 .00 9 .80 .00 10 .75 .00 11 .70 .00 12 .65 .00 13 .60 .00
B. Bottom Humidity Held at Zero and Top Humidity Increased and then Decreased C. High Top Humidity and Increasing Bottom Humidity A. Constant Humidity Gradient (50%)
Setpoints 1-4, and 9-13, no flux (50/0, 60/0, 70/0, 80/0) (80/0, 75/0, 70/0, 65/0, 60/0) Water flux below detection limit at mean r.h. < 0.40 # Top Bottom
1 0.95 0.05 2 0.95 0.15 3 0.95 0.25 4 0.95 0.35 5 0.95 0.45 # Top Bottom 1 0.50 0.00 2 0.55 0.05 3 0.60 0.10 4 0.65 0.15 5 0.70 0.20 6 0.75 0.25 7 0.80 0.30 8 0.85 0.35 9 0.90 0.40 10 0.95 0.45 11 1.00 0.50 Setpoints 1-3, no flux (50/0, 55/5, 60/10) Water flux starts at Setpoint 4 (65/15)
Mean Relative Humidity (Average of Top and Bottom Humidity)
W a te r V apo r M a ss Tra n sfe r Re si s tanc e (s /m )
Journal of Engineered Fibers and Fabrics
20
http:/ / w w w .jeffjournal.orgVolum e 4, Issue 4 – 20 0 9
CONCLUSIONS
• Test and evaluation methods to characterize the chemical resistance of permselective and reactive polymer layers in protective clothing materials need to include conditions that produce a realistic state of hydration in the test samples.
• Polymer membranes and laminates usually show much higher water vapor transport rates when they are well hydrated (higher mean relative humidity). Standard test methods that only use a single humidity condition to evaluate or rank materials may completely reverse material rankings depending on whether the test method produces low or high mean relative humidity test conditions.
• Test methods that have been developed for air-permeable sorptive layers are not designed to probe the effect of different hydration levels of a polymer film. In particular, testing with a dry gas sweep on one side of the membrane (0% relative humidity), can dry out the film so much on one side that the membrane becomes a significant barrier to water transport. Although testing with a dry gas sweep on one side of a polymer membrane is convenient for experimental and theoretical reasons, it should be supplemented by testing that produces a realistic state of hydration in the film.
• A polymer membrane swollen with water is usually much more permeable to vapor than a dry polymer membrane. This applies to both water vapor permeability and to organic chemical vapor permeability.
REFERENCES
[1] Schreuder-Gibson, H., Gibson, P., Owens, J., Gill, H., Orlicki, J., Prugh, A., Thornberg, C., Engel, R., Walker, J., Yeomans, W., Stote, R., Carney, D., Zukas, W., " Self-Detoxifying Materials for Chemically and Biologically Protective Clothing,” U.S. Army Natick Soldier Research, Development, and Engineering Center Technical Report, Natick/TR-08/008L, 2008.
[2] Gibson, P.W., "Water Vapor Transport and Gas Flow Properties of Textiles, Polymer Membranes, and Fabric Laminates," Journal of Coated Fabrics28, 1999, 300-327.
[3] Gibson, P., "Effect of Temperature on Water Vapor Transport Through Polymer Membrane Laminates,"
Journal of Polymer Testing19 (6), 2000, 673-691.
[4] Lomax, G., “Breathable Polyurethane Membranes for Textile and Related Industries,” Journal of Materials Chemistry17, 2007, 2775-2784.
[5] Schreuder-Gibson, H., Gibson, P., Yeomans, W., Walker, J., “Development and Performance Assessment of Reactive Membranes for New Self-Detoxifying Materials Systems for CB Protective Clothing,” Proceedings of the 2006 Scientific Conference on Chemical and Biological Defense, Hunt Valley, MD, 13-15 November, 2006.
[6] Gibson, P., "Multiphase Heat and Mass Transfer Through Hygroscopic Porous Media With Applications to Clothing Materials," U.S. Army Natick Research, Development, and Engineering Center Technical Report, Natick/TR-97/005, 1996.
AUTHORS ADDRESSES
Phillip W. Gibson, Ph.D.
Heidi L. Schreuder-Gibson,Ph.D.
Materials and Defense Sciences Division
U.S. Army Natick Soldier Research, Development, and Engineering Center
Natick, MA 01760-5020 UNITED STATES
’S ADDRESS
Phillip Gibson
Molecular Sciences and Engineering Team
Materials and Defense Sciences Division (MaDSci) U.S. Army Natick Soldier Research,
Development, and Engineering Center Natick, MA 01760-5020
USA