INVESTIGATIONS TO IMPROVE THE TRANSFERABILITY OF
SPECIMEN RESULTS BY REAL COMPONENT
Wen Tan
1*, Michael Stoschka
1,Hermann Maderbacher
1, Martin Riedler
2,
Wilfried Eichlseder
1, Fernando Romagnoli
3Received 12th December 2010; accepted in revised form 15th December 2010
Abstract
For the improvement of the lifetime calculation of components made of the titanium alloy Ti-6-4, a closed loop methodology from specimen to the component is presented. Based on forged pre-material specimens fatigue tests are done as a basic research, which are presented as S/N-curves. With the determined material data a lifetime calculation with the program FEMFAT is done on a typically fitting element. Finally the results of the lifetime calculation are compared to real component tests, which are done to evaluate the results of the lifetime calculation. The component tests are performed with constant and variable load. Therewith the transferability of specimen results to real components is shown. Additional fracture analysis by light microscope and scanning electron microscope is carried out to give further information of the influence factor of the lifetime and a further description between fracture behaviour of specimen and components.
Keywords: Fracture mechanics / Life prediction / Titanium alloys / Fatigue analysis / Variable amplitude test
1. Introduction
The quest of lightweight design and cost efficiency in the component development process calls for improved computational lifetime calculation methods. Nowadays, it is not enough just to consider the different loading cases of the final component but rather it is also necessary to study the full manufacturing process to determine the critical lifetime of the component. This is especially true for the aerospace industry, where lightweight materials like Ti-alloys are used for high performance structural components. Ti-6-4 is a typical material used in aircraft components, which meets the necessary requirements such as fatigue strength, lightweight and reliability.[1-2] In this paper the transferability of the test results from specimen to component were investigated.
The commercial way to generate highly stressed air craft components is to manufacture the parts out of forged blocs. A recent aspect for forging components is to cut as less fibre material as possible. Therefore, the basic form is obtained by different forging processes as well as different heat treatments. The subsequent heat treatment of the semi-finished product influences the behaviour of the final component as well. The component considered for this investigation is a purpose-designed fitting which is very typical for every airplane. With the component the transferability of pure specimen test to highly sophisticated real components is verified not only by computational approach, but also by cyclic tests on a servo-hydraulic test rig. Once the mechanisms are clarified, the knowledge can be used for a more improved design of similar fittings for airplanes in service.
1
W. Tan, DI; M. Stoschka, Dr.; H. Maderbacher, DI; W. Eichlseder, Univ. Prof. Dr. – Montanuniversität Leoben, Franz-Josef Str. 18, 8700 Leoben, Austria
2
M. Riedler, Dr. - Böhler Schmiedetechnik GmbH & Co KG, Mariazellerstraβe 25, 8605 Kapfenberg, Austria
3
F. Romagnoli - Embraer - São José dos Campos, Av.Brigadeiro Faria Lima, 12227-901-S.J. Dos Campos - SP Brasil
For a computational approach of the lifetime of a component, the relevant material data are necessary. Therefore a wide range of specimen tests were carried out. A basic method to describe the component behaviour is by using material tests out of the component. The results of constant and variable amplitude tests of the real component were compared to show similarities between material- and components tests. In addition to the fatigue tests, metallographic analyses were done to find out the relevant influence factor of the lifetime.
2. Material and testing geometries
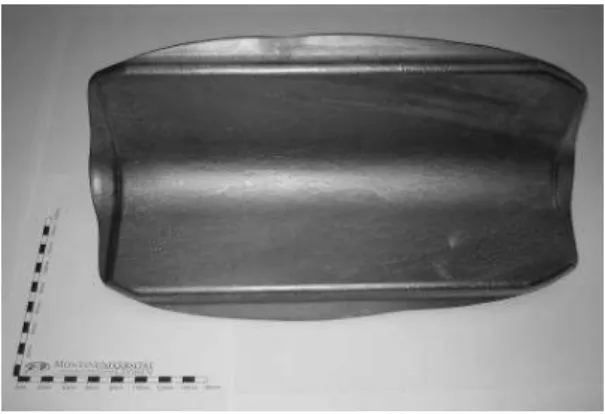
The investigated material is an (α+β )-Ti-6-4 alloy. The pre-material, a forged and mill annealed V-shaped part, see Fig. 1, is produced to investigate lifetime correlation between specimen and component.
Fig. 1. V-Shape
High cycle fatigue (HCF) test specimens and rotating bending test specimens were produced as per standards from the V-Shape. Fig. 2 shows the location from which the specimens are obtained.
1 3
2 4
Fig. 2. HCF-specimen
The investigated component, called lower link fitting (short: LLF), was manufactured out of similar pre - part as the V-Shape and was shot-peened to improve the fatigue strength.
Fig. 3. Lower Link Fitting (LLF)
3. Fatigue tests
Cyclic tests were conducted on both specimens and components. Specimens were tested with different stress ratios and S/N-curves were plotted to illustrate the influence of mean stress on the lifetime of the specimen. Component tests with the lower link fitting were carried out with a stress ratio R of 0.1 (ratio between min. stress level and max. stress level).
3.1. Specimen tests
High cycle fatigue (HCF) tests on specimen were carried out on a servo-hydraulic test rig from Instron with an Instron FastTrack control, see Fig. 4; with a nominal force of 100 kN.
The specimen was clamped with the help of mechanical clamping grips. These tests were stress controlled, and the test frequency of 20 Hz was used. The tests were run up to ten million cycles provided that the specimen did not fail earlier.
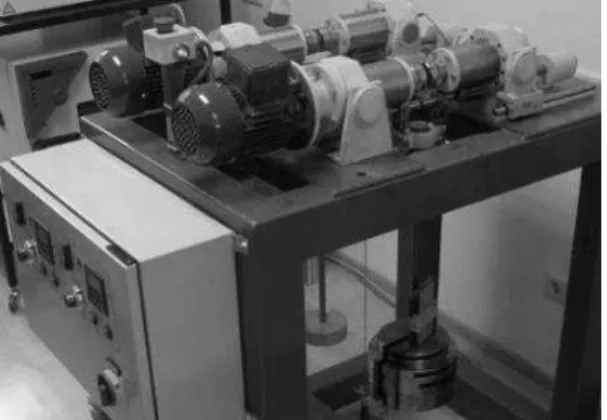
The rotating bending tests were performed using the rotating bending machine, which was designed at the chair of mechanical engineering, see Fig. 5. The test frequency was 60 Hz and if there was no ultimate fracture till ten million cycles, the specimen was characterized as run-through.
Fig. 5. Test rig for rotating bending tests
3.2. Component tests
The component tests were carried out on a servo-hydraulic test rig from Instron Schenk
with a nominal force of 250 kN, using an Instron FastTrack control system. The component tests were load controlled with a test frequency of 5 Hz.
The lower part of the LLF in Fig. 3is fixed at the upper end of the test rig. The upper part is bolted to lower end of the machine as seen in Fig. 6. The force on the component is applied through this bolt.
The clamping was done through specially manufactured fixtures to emulate boundary conditions in a real system. This setup was constructed by the Chair of Mechanical Engineering.
4. Test results
The test results are plotted as S/N-curves to illustrate the investigated influences and also for comparing specimen and component tests.
4.1. Specimen tests
The normalized HCF test results with stress ratio R = 0 are shown in Fig. 7. The scatter band is narrow at higher load level. The slope k of S/N curve in this case is 5.8.
A second series was tested with R = 0.1 to investigate influence of the mean stress. With the test result in Fig. 8 the mean stress influence factor M = 0.35 was obtained.
Fig. 7.Specimen S/N-curve of HCF test with R = 0
Fig. 8. S/N-curve of HCF test with R = 0.1
Fig. 9. shows the normalized result of the rotating bending test. The result is within the scatter band. The evaluated S-N curve shows a cyclic scatter band TN ~ 4.2 at the low cycle fatigue region and a stress scatter band TS of about 1.12. The scatter band is quite high, as specimen number seventeen showed a decreased lifetime at stress amplitude of 1.33.
Fig. 9. S/N-curve of rotating bending test
4.2. Component tests
Component tests were carried out with constant and variable amplitudes.
4.2.1. Constant amplitude test
The constant amplitude tests were investigated with two constant amplitude levels. An external force of 118 kN and 80 kN were applied to the lower link fitting.
The fatigue tests were carried out with a stress ratio of R = 0 until break down of the specimen occurred, see in Fig. 10.
Fig. 10. Fracture of a LLF
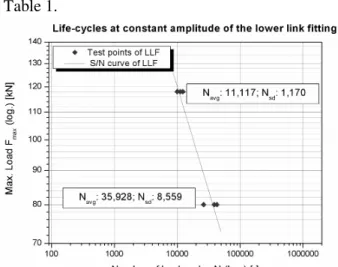
The S/N curve in Fig. 11 represents the test result for the component test and the corresponding numerical values are tabulated in Table 1.
Fig. 11. S/N-curve of constant LLF-tests
Tab.1 Test results of constant LLF-tests
Component Lifetime cycles F_max [kN]
1 11.152 118
2 10.008 118
3 12.332 118
4 42.779 80
5 26.670 80
4.2.2. Variable amplitude test
The variable amplitude tests were carried out with defined load sequence. A single series of 2 lower link fittings were investigated.
The components were loaded till
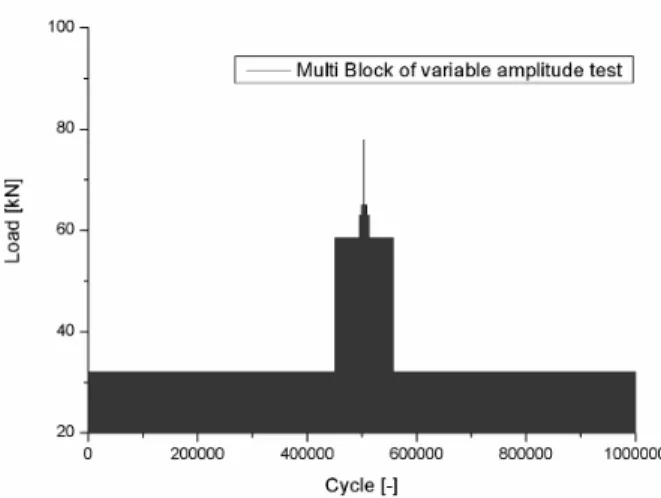
breakdown with the following loading sequence. The load began at 32 kN for the first 450,000 cycles, increased to 58.5 kN for 45,000 cycles, increased again to 63 kN and 65kN for the next 4,500 cycles each and held at the highest load level of 78 kN for 10 load cycles. The load was decreased in the reversed sequence by the same number of load cycles. This load sequence was repeated till break down of the component occurred, as depicted in Fig. 12.
Fig. 12. Test block of variable amplitude test
The number of repeated load sequences till components failured ranged from 4 to 5, with the corresponding load cycles varying from 4 and 5 Million.
A graphical overview over both results of constant and variable amplitude tests is given in Fig. 13. In the figure, the load levels and corresponding load cycles for one sequence is illustrated in a decreasing order of maximum load level. For the component tests the load level was applied as mentioned before. [3]
For the comparison, the total load cycle of variable amplitude tests is plotted at the highest load level of the test.
Fig. 13. S/N-curve of component tests
4.2.3 Comparison of the specimen and component tests
Due to complex geometry of the component, a finite element simulation was run to determine the local maximum principal stress, so that a comparison with the specimen test can be realised, see Fig. 14. The result from the FEM simulation is one of the input parameter for the lifetime calculation.
Fig. 14. FE-analysis of LLF
Fig. 15 shows the comparison of the both specimen and component test results. The slope of both S/N curve is similar, but the difference in lifetime is distinct. In order to regard the diverse
influence of the component lifetime,
Fig. 15. Comparison of specimen and component test
5. Metallographic investigation
The fracture surfaces of the specimen were investigated by light optical microscopy (LM) as shown in Fig. 16. A good agreement was found between the fracture surfaces. The cracks were found to have initiated at the surface almost for every specimen.
Fig. 16. Fracture surface of HCF-specimens
In order to observe a fracture surface of the lower link fittings which is not completely cracked through, the upper part was cut-off. A representative fracture surface observed using LM can be seen in Fig. 17. The crack initiations were under the surface which can also be
observed from the Finite Element simulation. The components give rather a trace of fretting, which also clarifies the shorter lifetime of the forged specimens, see Fig. 18 and Fig. 19.
Fig. 17. Fracture surface of LLF
Fig. 18. Fretting trace by light microscope
Fig. 19. Fretting trace by scanning electron microscope
6. Calculation of the lifetime
The lifetime calculation is implemented with the software program FEMFAT.
The stress analysis of the lower link fitting obtained from FEM simulation and the global load data which agreed with the force applied in the experimental tests, are required as input of the lifetime simulation. In this case, the global load and structure data of component were obtained with the Finite Element Solver MSC Nastran. The material data used as input was determined by the specimen tests mentioned above. The load sequence is represented in one cycle, so the result is obtained in the form of damage of the component, the inverse of which provides the number of cycles to failure.
equivalent stress in this simulation is the Max. principal stress. The influences which were also considered for the lifetime calculation are stress gradient, load type, mean stress and mean stress shifting, influence of the surface topography such as roughness and residual stress cause by shot peened. [6]
Fig. 20 shows the result for the lifetime calculation with a load of 118 kN, the critical area of the components and the distribution of damage can be seen. The calculated lifetime is 11915 cycles match well to mean lifetime cycles from the components test, see table 1 and Fig. 11. The lifetime calculation for the lower load level of 80 kN was performed under same conditions. The result of 69541 cycles demonstrates a significant difference in the calculation results. In fact, the lifetime is twice as long. This result could be due to the absence of the fretting effect which has a strong influence on the lifetime of titanium alloy. [4] Therefore, in future, the effect of fretting and other influence such as microstructure, should be more investigated. [5-8].
7. Summary and outlook
This work demonstrates, on the basis of component tests how to transfer specimen results to component, but also the means to apply these results in lifetime calculation software. On the high load level simulated results were in good agreement, while for the lower stress level other influences must be considered. Regarding the crack initiation of the lower link fittings in the component tests, the influence of fretting affects the lifetime behaviour substantially. The interaction between different elements from different material, such as bolt and bushing for
lug, involves extensive investigation for
obtaining lifetime, taking into account the phenomenon of fretting and fatigue. Furthermore these both can be combined and studied as fretting fatigue phenomenon.
Acknowledgements
The research work is funded by the Christian Doppler Research Association, Austria. .
References
[1] G. Lütjering, J.C. Williams: Titanium: Engineering Materials and Processes, Berlin, Springer, 2003.
[2] M. Peters, C. Leyens: Titan und Titanlegierungen, Weinheim, Wiley, 2002.
[3]
G.Schott,Werkstoffermüdung-Ermündungsfestigkeit, Stuttgart, German, 1985. [4] S. Fouvry, K. Kubiak, Introduction of a
fretting-fatigue mapping concept: Development of a dual crack nucleation – crack propagation approach to formalize fretting-fatigue damage, International Journal of Fatigue (2209), pp250-262.
[5] M. Stoschka, W. Tan, W. Eichlseder, M. Stockinger: Introduction to an approach based on
the (α+β) microstructure of elements of Ti-6Al-4V Procedia Engineering 01, (2009), p. 109. [6] M. Riedler; M. Stockinger, M. Stoschka, W.
Eichlseder: Fatigue Analysis of Forged Aerospace Components based on Microstructural Parameters Key Engineering Materials, Vol. 348-349, (2007), pp 185-188.
[7] M. Riedler, M. Stockinger, M. Stoschka, B. Oberwinkler, W. Tan: Linking microstructure and fatigue of forged Ti-6Al-4V aerospace parts LCF6, Berlin, (2008), pp 129-134.