Submitted6 January 2015
Accepted 11 March 2015
Published26 March 2015
Corresponding author Peter A. Combs,
Academic editor Claus Wilke
Additional Information and Declarations can be found on page 12
DOI10.7717/peerj.869 Copyright 2015 Combs and Eisen
Distributed under
Creative Commons CC-BY 4.0 OPEN ACCESS
Low-cost, low-input RNA-seq protocols
perform nearly as well as high-input
protocols
Peter A. Combs1and Michael B. Eisen2,3
1Graduate Program in Biophysics, University of California, Berkeley, CA, USA
2Department of Molecular and Cell Biology, University of California, Berkeley, CA, USA 3Howard Hughes Medical Institute, University of California, Berkeley, CA, USA
ABSTRACT
Recently, a number of protocols extending RNA-sequencing to the single-cell regime have been published. However, we were concerned that the additional steps to deal with such minute quantities of input sample would introduce serious biases that would make analysis of the data using existing approaches invalid. In this study, we performed a critical evaluation of several of these low-volume RNA-seq protocols, and found that they performed slightly less well in per-gene linearity of response, but with at least two orders of magnitude less sample required. We also explored a simple modification to one of these protocols that, for many samples, reduced the cost of library preparation to approximately$20/sample.
Subjects Bioinformatics, Biotechnology, Computational Biology, Genomics
Keywords RNAseq, Single cell, Protocols, Linear output
INTRODUCTION
Second-generation sequencing of RNA (RNA-seq) has proven to be a sensitive and increasingly inexpensive approach for a number of different experiments, including annotating genes in genomes, quantifying gene expression levels in a broad range of sample types, and determining differential expression between samples. As technology improves, transcriptome profiling has been able to be applied to smaller and smaller samples, allowing for more powerful assays to determine transcriptional output. For instance, our lab has used RNA-seq on singleDrosophilaembryos to measure zygotic gene activation (Lott et al., 2011) and medium-resolution spatial patterning (Combs & Eisen, 2013). Further improvements will allow an even broader array of potential experiments on samples that were previously too small.
in bulk tissues, revealing different states and cellular identities (Buganim et al., 2012;
Treutlein et al., 2014).
However, we felt that published descriptions of single-cell and other low-volume protocols did not adequately address whether a change in concentration of a given transcript between two samples would result in a proportional change in the FPKM (or any other measure of transcriptional activity) between those samples. While there are biases inherent to any protocol, we were concerned that direct amplification of the mRNA would select for PCR compatible genes in difficult to predict, and potentially non-linear ways. For many of the published applications of single cell RNA-seq, this is not likely a critical flaw, since the clustering approaches used are moderately robust to quantitative changes. However, to measure spatial and temporal activation of genes across an embryo, it is important that the output is monotonic with respect to concentration, and ideally linear. A linear response allows for more easily interpretable experimental results, without necessarily relying on complicated transformations of the data.
While it is possible to estimate absolute numbers of cellular RNAs from an RNA-seq experiment, doing so requires spike-ins of known concentration and estimates of total cel-lular RNA content (Mortazavi et al., 2008;Lin et al., 2012). However, many RNA-seq exper-iments do not do these controls, nor are such controls strictly necessary under reasonable, though often untested, assumptions of approximately constant RNA content. While ulti-mately absolute concentrations will be necessary to fully predict properties such as noise tolerance of the regulatory circuits (Gregor et al., 2007;Gregor et al., 2005), many current modeling efforts rely only on scaled concentration measurements, often derived from
in situ-hybridization experiments (Garcia et al., 2013;Ilsley et al., 2013;He et al., 2010). Given that, we felt it was not important that different protocols should necessarily agree on any particular expression value for a given gene, nor are we fully convinced that absolute expression of any particular gene can truly reliably be predicted in a particular experiment.
In order to convince ourselves that data generated from limiting samples would be suitable for evaluating the spatial distribution of gene expression or other experiments where a linear response is necessary for proper interpretation of the data, we evaluated several protocols for performing RNA-seq on extremely small samples. We also investi-gated a simple modification to one of the protocols that reduced sample preparation cost per library by more than 2-fold. This study provides a single, consistent comparison of these diverse approaches, and shows that in fact all data from the low-volume protocols we examined are usable in similar contexts to the earlier bulk approach.
METHODS
RNA extraction, library preparation, and sequencing
concentrations using a fluorometric Qubit RNA HS assay (Life Technologies, Grand Island, New York, USA).
TruSeq libraries were prepared with the “TruSeq RNA Sample Preparation Kit v2” (Illumina Cat.#RS-122-2001) according to manufacturer instructions, except for the following modifications. All reactions were performed in half the volume of reagents. We find that this increases the effective concentration of RNA and cDNA. We performed all reactions and cleanups in 8-tube PCR strip tubes, which allowed us to reduce the volume of Resuspension Buffer to minimize volume left behind after each cleanup.
Clontech libraries were prepared with the “Low Input Library Prep Kit” (Clontech Cat.#634947). We generated cDNA by using TruSeq reagents until the cDNA synthesis step. Then, we used the Low Input Library Prep Kit to modify the cDNA into sequencing-competent libraries. We assume that a similar cDNA synthesis could be performed using oligo dT Dynabeads, RNA fragmentation reagents, and Superscript II (Life Technologies, Grand Island, New York, USA), for an approximate cost per sample of$15, but have not directly tested this with the Clontech reagents.
TotalScript libraries were prepared with the “TotalScript RNA-Seq Kit” and “TotalScript Index Kit” (Epicentre Cat.#TSRNA1296 and TSIDX12910). We followed the manufac-turer’s instructions, and used the oligo dT priming option. We performed the mixed priming option in parallel, which yielded approximately 4-fold more library, but did not sequence them due to concerns of ribosomal contamination.
SMARTseq2 libraries were prepared according to the protocol inPicelli et al. (2014). Because we had already extracted and mixed the RNA, we began at step 5 with 3.7µL of
dNTPs and 1µL of 37µM oligo dT primer, yielding the same concentration of primer and
oligo as originally reported. We used 18 cycles for the preamplification PCR in step 14, added 1 ng of cDNA to the Nextera XT reactions in step 28, and used 6 and 8 cycles for the final enrichment in step 33 (experiments 2 and 3, respectively).
Libraries were quantified using a combination of Qubit High Sensitivity DNA (Life Technologies, Grand Island, New York, USA) and Bioanalyzer (Agilent Technologies, Sunnyvale, California, USA) readings. Total yieldY infemtomoleswas estimated using Qubit concentrationCmeasured in (ng/µL), total volumeVinµL, average sizeSin bp,
Y[fmole] =C[ng/µL] ·10−9[g/ng]·V[µL] ·1015[fmole/mole] ÷608.9[g/mole] ÷S[bp]. (1)
We then pooled libraries to equalize index concentration before sequencing.
Mapping and quantification
Reads were mapped using STAR (Dobin et al., 2012) to a combination of the FlyBase reference genome version 5.54 forD. melanogasterandD. virilis(McQuilton, St. Pierre & Thurmond, 2012). We randomly sampled the mapped reads to use an equal number in each sample compared. We used HTSeq (command line optionshtseq-count --idattr=✬gene name✬ --stranded=no --sorted=pos) to count absolute read abundance per gene (Anders, Pyl & Huber, 2014). All custom analysis software is available athttps://github.com/eisenlab/SliceSeq, and is primarily written in Python (Cock et al., 2009;Hunter, 2007;Jones et al., 2001;Perez & Granger, 2007). Commitc6b3d3ewas used to perform all analyses in this paper.
Simulation of Experiment 2
We wrote a Python script that simulated Experiment 2 assuming only uncorrelated counting noise in the number of reads per gene. The read counts from the sample with 20%D. virilisand the TruSeq protocol was used to generate the base probabilities.
D. virilisgene probabilities were adjusted downwards, and the remaining probability was assigned evenly to theD. melanogastergenes. TheSciPyfunctionstats.multinomial was used to simulate read counts, assuming an equal number of reads as in the original experiment. Gene expression levels were normalized usingEq. (2), as in the actual experiment.
RESULTS
Experiment 1: evaluation of Illumina TruSeq
In our hands, the Illumina TruSeq protocol has performed extremely reliably with samples on the scale of 100 ng of total RNA, the manufacturer recommended lower limit of the protocol. However, attempts to create libraries from much smaller samples yielded low complexity libraries, corresponding to as much as 30-fold PCR duplication of fragments (Text S1). Anecdotally, less than 5% of libraries made with at least 90 ng of total RNA yielded abnormally low concentrations, which we observed correlated with low complexity (Data not shown). To determine the lower limit of input needed to reliably produce libraries, we attempted to make libraries from 40, 50, 60, 70, and 80 ng ofDrosophilatotal RNA, each in triplicate. Yields are shown inTable 1.
We considered the two libraries with lower than usual concentration to be failures. Al-though there is detectable material post-amplification, the size distributions as measured by Bioanalyzer of these libraries is significantly different than known good libraries and manufacturer provided documentation (Fig. S1). In our experience, sequencing libraries with much lower than usual yield and abnormal size distributions has yielded libraries with low complexity and poor correlation to replicates.
Table 1 Total TruSeq cDNA library yields made with a given amount of input total RNA.Yields measured by Nanodrop of cDNA libraries resuspended in 25µL of EB. The italicized samples were near the lower limit of detection, and when analyzed with a Bioanalyzer, showed abnormal size distribution of cDNA fragments.
Amount input RNA Replicate A Replicate B Replicate C
40 ng 57 ng 425 ng 672 ng
50 ng 435 ng 768 ng 755 ng
60 ng 115 ng 663 ng 668 ng
70 ng 300 ng 593 ng 653 ng
80 ng 468 ng 550 ng 840 ng
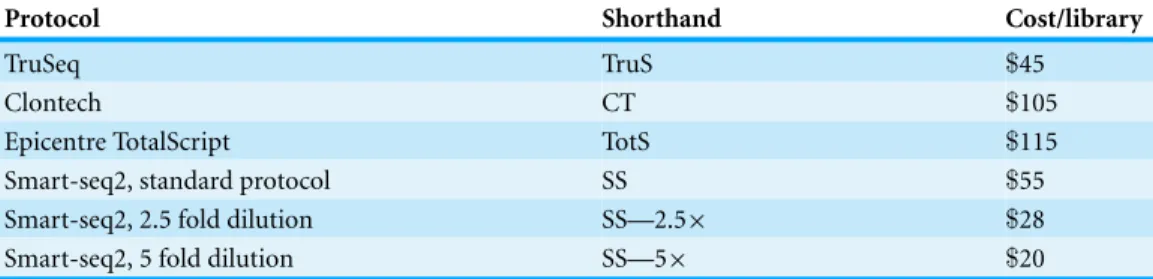
Table 2 Summary of protocols used in experiments 2 and 3.Cost is estimated per library assuming a enough libraries to consume all reagents at US catalog prices as of May 2014, and includes$2 for TRIzol RNA extraction, but not experimenter labor, sample QC, labware, or sequencing. Difference in prices in the Smart-seq2 protocols entirely due to scaling in cost of Nextera reagents.
Protocol Shorthand Cost/library
TruSeq TruS $45
Clontech CT $105
Epicentre TotalScript TotS $115
Smart-seq2, standard protocol SS $55
Smart-seq2, 2.5 fold dilution SS—2.5× $28
Smart-seq2, 5 fold dilution SS—5× $20
of poly-adenylated mRNA), common laboratory equipment is not able to determine the particular point in the protocol where the failures occurred.
It is clearly possible to use less than the manufacturer suggested amount of input RNA. Thus, we consider 70 ng of total RNA to be the conservative lower limit to the protocol. While this is about 30% smaller than the manufacturer suggests, it is still several orders of magnitude larger than we needed it to be. We therefore considered using other small-volume and “single-cell” RNA-seq kits, which often use a pre-amplification step that is known to influence estimation of absolute levels (Picelli et al., 2013).
Experiment 2: competitive comparison of low-volume RNAseq protocols
We first sought to determine whether the low-volume RNAseq protocols available faith-fully recapitulate linear changes in abundance of known inputs, even if absolute levels are not directly comparable to other protocols. We generated synthetic spike-ins by combiningD. melanogasterandD. virilistotal RNA in known, predefined proportions of 0, 5, 10, and 20%D. virilisRNA. For each of the low-volume protocols, we used 1 ng of total RNA as input, whereas for the TruSeq protocol we used 100 ng.
protocol would function reproducibly with natural RNA, which almost certainly has a different distribution of 6-mers, which could conceivably affect random cDNA priming and other amplification effects. Furthermore, our spike-in sample more densely covers the approximately 105fold coverage typical of RNA abundances. It should be noted, however, that our sample is not directly comparable to any other standards, nor is the material of known strandedness. We assumed that the majority of each sample is from the standard annotated transcripts, but did not verify this prior to library construction and sequencing.
We then estimated yield by measuring concentration in ng/µL with a Qubit High
Sensitivity DNA assay and average fragment size with a Bioanalyzer High Sensitivity chip. The different protocols had a variation in yield of libraries from between 6 fmole (approximately 3.6 trillion molecules) and 2,400 femtomoles, with the TruSeq a clear outlier at the high end of the range, and the other protocols all below 200 fmole (Table 3). While the number of PCR cycles in the final enrichment steps can be adjusted, all of these quantities are sufficient to generate hundreds of millions of reads—far more than is typi-cally required for an RNA-seq experiment. We pooled the samples, attempting equimolar fractions in the final pool; however, due to a pooling error, we generated significantly more reads than intended for the TruSeq protocol, and correspondingly fewer in the other protocols. Unless otherwise noted, we therefore sub-sampled the mapped reads to the lowest number of mapped reads in any library in order to provide a fair comparison between protocols.
We were interested in the fold-change of eachD. virilisgene across the four libraries, rather than the absolute abundance of any particular gene. Therefore, after mapping and gene quantification, we normalized the abundanceAijof every geneiacross the
j=4 libraries by a weighted average of the quantityQjofD. virilisin libraryj, as show in
Eq. (2). Thus, within a given gene, a linear fit ofAijˆ vs.Qjshould have a slope of one and an intercept of zero. As expected, this normalized abundance increased with increasingD. virilisconcentration (Fig. S2).
ˆ
Aij=Aij÷
jQjAij
j(Qj)2
. (2)
We then filtered theD. virilisgenes for those with at least 20 mapped fragments in the library with 20%D. virilis, then calculated an independent linear regression and the Pearson correlation coefficient between the expected and measured concentration of
Table 3 Sequencing summary statistics for libraries.Protocols are the shorthands used in Table 2. Reads indicates the total number of reads, and Mapped the total number of reads that mapped at least once to either genome. Experiments 2 and 3 were run in a single HiSeq lane each. Yield estimates were generated by adjusting Qubit High Sensitivity DNA readings by the average fragment size as measured by Bioanalyzer.
Expt Protocol %D. virilis Yield Total reads Mapped reads
2 CT 0% 6.5 fmole 3,803,843 3,374,520 (89%)
2 ” 5% 15.7 fmole 4,372,738 4,164,781 (95%)
2 ” 10% 47.4 fmole 10,013,087 9,527,023 (95%)
2 ” 20% 17.8 fmole 4,781,463 4,317,101 (90%)
2 TotS 0% 176.8 fmole 3,281,134 2,930,058 (89%)
2 ” 5% 170.2 fmole 2,498,134 2,237,330 (90%)
2 ” 10% 102.5 fmole 5,777,523 5,424,366 (94%)
2 ” 20% 119.9 fmole 6,068,996 5,740,496 (95%)
2 TruS 0% 2,401.0 fmole 67,560,511 64,024,881 (95%)
2 ” 5% 2,001.1 fmole 23,370,854 22,589,083 (97%)
2 ” 10% 2,174.2 fmole 39,454,390 38,093,763 (97%)
2 ” 20% 2,379.2 fmole 35,265,536 34,304,792 (97%)
2 SS 0% 34.3 fmole 2,439,518 2,297,087 (94%)
2 ” 5% 59.6 fmole 2,550,023 2,419,889 (95%)
2 ” 10% 67.9 fmole 2,534,628 2,444,568 (96%)
2 ” 20% 39.8 fmole 2,504,340 2,389,850 (95%)
3 SS—2.5× 0% 104.4 fmole 15,769,915 14,393,959 (91%)
3 ” 1% 124.7 fmole 21,349,748 20,084,131 (94%)
3 ” 5% 113.0 fmole 17,047,120 16,329,641 (96%)
3 ” 10% 103.5 fmole 23,762,232 22,372,562 (94%)
3 ” 20% 123.8 fmole 20,809,781 20,041,548 (96%)
3 SS—5× 0% 59.4 fmole 19,214,155 17,324,598 (90%)
3 ” 1% 58.6 fmole 23,832,274 22,364,220 (94%)
3 ” 5% 65.4 fmole 18,149,452 17,157,450 (95%)
3 ” 10% 28.8 fmole 15,821,419 14,869,864 (94%)
3 ” 20% 57.2 fmole 22,466,345 21,620,603 (96%)
the SMART-seq2 libraries (t-testp=.11,Fig. 1). Taken together, all of these measures indicate that the TruSeq protocol is better able to capture the linear trend in increasing transcript number.
had a higher IQR. We thus conclude that the major limiting factor for the TruSeq pro-tocol to generate a linear response in the data is likely the sequencing depth, whereas the other protocols all contain additional biases.
Although there is some variation in the precise shape of the distributions of fit pa-rameters, these were relatively small compared to the difference between any of these and the conventional TruSeq protocol. Indeed, the major differentiator we found among the low-volume protocols we compared was cost. For only a handful of libraries, the kit-based all inclusive model of the Clontech and TotalScript kits could be a significant benefit, allowing the purchase of only as much of the reagents as required. By contrast, the Smart-seq2 protocol requires the a la carte purchase of a number of reagents, some of which are not available or more expensive per unit for smaller quantities. Furthermore, there could potentially be a “hot dogs and buns” problem, where reagents are sold in non-integer multiples of each other, leading to leftovers. Many of these reagents are not single-purpose, however, so leftovers could in principle be repurposed in other experiments.
Experiment 3: further modifications to the SMART-seq2 protocol
Although the SMART-seq2 was the cheapest of the protocols when amortized over a large number of libraries, we wondered whether it could be performed even more cheaply without compromising data quality. This would enable us to include more biological replicates in the future experiments for which we are evaluating these protocols. In the original protocol, we noticed that roughly 60% of the cost came from the Nextera XT reagents. Thus, reducing the cost of tagmentation was the obvious goal to target.
We made additional libraries, again starting with 1ng of total RNA. We amplified a single set of spike-in libraries with 0, 5, 10, and 20%D. virilistotal RNA as in experiment 2, and made a single an additional sample with 1%D. virilisRNA. Starting at the point in the SMART-seq2 protocol where tagmentation was started, we performed reactions in volumes 2.5×and 5×smaller, using proportionally less cDNA as well. Due to the low total yield, we increased the number of enrichment cycles from 6 to 8 (see ‘Methods’).
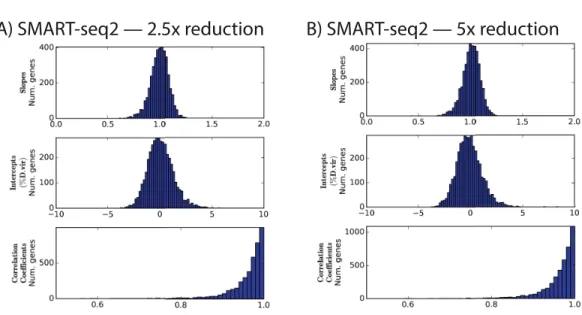
When normalized to the same number of reads as in experiment 2, the protocols with diluted Nextera reagents performed effectively identically: for instance, the mean correlation coefficients were in both cases 0.96±0.05 (Fig. 2andTable 4). This is despite the additional cycles of enrichment, which improved yield.
Because we used a common set of pre-amplified cDNA samples that was performed in a distinct pre-amplification from experiment 2, we can estimate the contribution of that pre-amplification to the overall variation. If, in fact, the pre-amplification is a major con-tributor to the variation, then we would expect to find that the correlation between, for instance, the slopes of two runs of the same experiment with different pre-amplifications would be significantly lower than the correlation between the slopes of two runs using the same pre-amplified cDNA pools.
Table 4 Distribution of fit parameters.A simple linear fit,Aˆij=mi·Qj+bi, was computed for each geneiand a correlation coefficientrwas calculated. For brevity,x¯is the mean of some variablex, andσx is its standard deviation.
Protocol m¯ ±σm b¯±σb ¯r±σr
TruSeq 1.01±0.0698 −0.108±1.05 0.98±0.019
Clontech 1.01±0.12 −0.217±1.79 0.95±0.061
Epicentre TotalScript 0.952±0.129 0.715±1.93 0.93±0.094
Smart-seq2 1.03±0.121 −0.506±1.82 0.95±0.057
Smart-seq2, 2.5 fold dilution 0.996±0.111 0.0623±1.67 0.96±0.053 Smart-seq2, 5 fold dilution 1.01±0.111 −0.173±1.66 0.96±0.049
Figure 2 Distributions of slopes, intercepts, and correlation coefficients for experiment 3.Nextera XT reactions were reduced in volume by the indicated amount.
(Fig. 3). By analogy to dual-reporter expression studies such asElowitz et al. (2002), we term variation along the diagonal “extrinsic noise” (ηext=std(m1+m2)), and variation
perpendicular to the diagonal “intrinsic noise” (ηint=std(m1−m2)), being intrinsic to
the pre-amplification step. Using that metric, the intrinsic noise is lower for the samples with the same pre-amplification (ηint=0.09) than for the samples with different
pre-amplifications (ηint=0.16). Somewhat surprisingly, the extrinsic noise is higher for the
samples with the same pre-amplification (ηext=0.20 vs.ηext=0.16), perhaps due to the
2 additional cycles of PCR enrichment.
DISCUSSION
Figure 3 Estimating the source of preamplification noise.Plotted are the estimated slopes for each gene between experiments. The blue, “Different pre-amplification” compares the 2.5×diluted and full sized reactions, whereas the green “same pre-amplification” points compare the 2.5×and 5×dilution samples, which used the same pre-amplified cDNA but different tagmentation reactions.
protocols we have tested should perform similarly to each other, and can be used as a drop-in replacement. While preamplification steps do introduce some detectable variance, it is not vastly detrimental to the data quality, and does not introduce obvious sequence-specific biases.
the quantities are lower than the detection threshold of many standard quality control approaches, we cannot directly verify this.
Compared to the regimes these protocols were designed for, we used a relatively large amount of input RNA—1 ng of total RNA—corresponding to approximately 50 nuclei of a mid-blastula transitionDrosophilaembryo. Previous studies have shown that this amount of RNA is well above the level where stochastic variation in the number of mRNAs per cell will strongly affect the measured expression of a vast majority of genes (Marinov et al., 2013). It is nevertheless a small enough quantity to be experimentally relevant. For instance, we have previously dissected single embryos into approximately 12 sections, yielding approximately 10 ng per section (Combs & Eisen, 2013), and one could conceivably perform similar experiments on imaginal discs or antennal structures, which contain a similar amount of cells (Klebes et al., 2002;Hansson & Anton, 2000).
One of the more striking results is that costs can be significantly reduced by simply performing smaller reactions, without noticeably degrading data quality. We do not suspect this will be true for arbitrarily small samples, such as from single cells. Instead, it is likely only true for samples near the high end of the effective range of the protocol. We have not explored where this result breaks down, and strongly caution others to verify this independently using small pilot experiments before scaling up.
CONCLUSIONS
The selection of protocols for performing RNAseq depends on the amount of material available to be profiled. We found that high quality libraries can be generated with slightly less than the manufacturer’s recommended minimum using the standard Illu-mina TruSeq protocol. When sufficient material is available to use the TruSeq protocol, we find that this produces data with a better linear response to the increasing concen-tration of any given gene than a number of different “single cell” protocols, which have roughly comparable performance in this metric. Finally, we found that at least one of these protocols, SMARTseq2 could be easily modified to significantly reduce the cost of library preparation, without compromising data quality.
ACKNOWLEDGEMENTS
We would like to thank Lior Pachter for suggesting the simulation experiment, and re-viewers Angela Wu and Scott Hunicke-Smith for their detailed comments and criticisms.
ADDITIONAL INFORMATION AND DECLARATIONS
Funding
Grant Disclosures
The following grant information was disclosed by the authors: Howard Hughes Medical Institute investigator award.
National Institutes of Health training: #T32 HG 00047. NIH S10 Instrumentation: S10RR029668, S10RR027303.
Competing Interests
The authors declare there are no competing interests.
Author Contributions
• Peter A. Combs conceived and designed the experiments, performed the experiments, analyzed the data, contributed reagents/materials/analysis tools, wrote the paper, prepared figures and/or tables, reviewed drafts of the paper.
• Michael B. Eisen conceived and designed the experiments, contributed reagents/materials/analysis tools, reviewed drafts of the paper.
Data Deposition
The following information was supplied regarding the deposition of related data: Gene Expression Omnibus GSE64673
Supplemental Information
Supplemental information for this article can be found online athttp://dx.doi.org/ 10.7717/peerj.869#supplemental-information.
REFERENCES
Anders S, Pyl PT, Huber W. 2014.HTSeq A Python framework to work with high-throughput sequencing data.Bioinformatics31(2):166–169DOI 10.1093/bioinformatics/btu638.
Bhargava V, Head SR, Ordoukhanian P, Mercola M, Subramaniam S. 2014.Technical variations in low-input RNA-seq methodologies.Scientific Reports4:3678DOI 10.1038/srep03678.
Buganim Y, Faddah DA, Cheng AW, Itskovich E, Markoulaki S, Ganz K, Klemm SL, van Oudenaarden A, Jaenisch R. 2012. Single-cell expression analyses during cellular
reprogramming reveal an early stochastic and a late hierarchic phase.Cell150(6):1209–1222 DOI 10.1016/j.cell.2012.08.023.
Cock PJA, Antao T, Chang JT, Chapman BA, Cox CJ, Dalke A, Friedberg I, Hamelryck T, KauffF, Wilczynski B, de Hoon MJL. 2009.Biopython: freely available Python tools for computational molecular biology and bioinformatics.Bioinformatics25(11):1422–1423 DOI 10.1093/bioinformatics/btp163.
Combs PA, Eisen MB. 2013.Sequencing mRNA from cryo-sliced Drosophilaembryos to determine genome-wide spatial patterns of gene expression. PLoS ONE8(8):e71820 DOI 10.1371/journal.pone.0071820.
Elowitz MB, Levine AJ, Siggia ED, Swain PS. 2002.Stochastic Gene Expression in a Single Cell.
Science297(5584):1183–1186DOI 10.1126/science.1070919.
Garcia M, Nahmad M, Reeves GT, Stathopoulos A. 2013.Size-dependent regulation of dorsal-ventral patterning in the early Drosophila embryo. Developmental Biology 381(1):286–299DOI 10.1016/j.ydbio.2013.06.020.
Gregor T, Bialek W, Van Steveninck RRdR, Tank DW, Wieschaus EF. 2005.Diffusion and scaling during early embryonic pattern formation.Proceedings of the National Academy of Sciences of the United States of America102(51):18403–18407DOI 10.1073/pnas.0509483102.
Gregor T, Tank DW, Wieschaus EF, Bialek W. 2007.Probing the limits to positional information.
Cell130(1):153–164DOI 10.1016/j.cell.2007.05.025.
Hansson BS, Anton S. 2000.Function and morphology of the antennal lobe: new developments.
Annual Review of Entomology45:203–231DOI 10.1146/annurev.ento.45.1.203.
Hashimshony T, Wagner F, Sher N, Yanai I. 2012.CEL-Seq: single-cell RNA-Seq by multiplexed linear amplification.Cell Reports2(3):666–673DOI 10.1016/j.celrep.2012.08.003.
He X, Samee MAH, Blatti C, Sinha S. 2010.Thermodynamics-based models of transcriptional regulation by enhancers: the roles of synergistic activation, cooperative binding and short-range repression.PLoS Computational Biology6(9):1–15DOI 10.1371/journal.pcbi.1000935.
Hunter JD. 2007.Matplotlib: a 2D graphics environment.Computing in Science & Engineering 9(3):90–95DOI 10.1109/MCSE.2007.55.
Ilsley GR, Fisher J, Apweiler R, DePace AH, Luscombe NM. 2013.Cellular resolution models for even skipped regulation in the entireDrosophilaembryo. eLife2:e00522 DOI 10.7554/eLife.00522.
Islam S, Kjallquist U, Moliner A, Zajac P, Fan J-B, Lonnerberg P, Linnarsson S. 2011.
Characterization of the single-cell transcriptional landscape by highly multiplex RNA-seq.
Genome Research21(7):1160–1167DOI 10.1101/gr.110882.110.
Jiang L, Schlesinger F, Davis CA, Zhang Y, Li R, Salit M, Gingeras TR, Oliver B. 2011.
Synthetic spike-in standards for RNA-seq experiments.Genome Research21(9):1543–1551 DOI 10.1101/gr.121095.111.
Jones E, Oliphant E, Peterson P et al.2001.SciPy: open source scientific tools for Python.http:// www.scipy.org/.
Klebes A, Biehs B, Cifuentes F, Kornberg TB. 2002.Expression profiling ofDrosophilaimaginal discs.Genome Biology3(8):1–16DOI 10.1186/gb-2002-3-8-research0038.
Levin JZ, Levin M, Yassour X, Adiconis C, Nusbaum DA, Thompson N, Friedman A, Gnirke A, Regev. 2010.Comprehensive comparative analysis of strand-specific RNA sequencing methods.
Nature Methods7(9):709–715DOI 10.1038/nmeth.1491.
Lin CY, Lov´en J, Rahl PB, Paranal RM, Burge CB, Bradner JE, Lee TI, Young RA. 2012.
Transcriptional amplification in tumor cells with elevated c-Myc.Cell151(1):56–67 DOI 10.1016/j.cell.2012.08.026.
Lott SE, Villalta JE, Schroth GP, Luo S, Tonkin LA, Eisen MB. 2011.Noncanonical compensation of zygotic X transcription in earlyDrosophila melanogasterdevelopment revealed through single-embryo RNA-seq.PLoS Biology9(2):e1000590DOI 10.1371/journal.pbio.1000590.
Marinov GK, Williams BA, McCue K, Schroth GP, Gertz J, Myers RM, Wold BJ. 2013.From single-cell to cell-pool transcriptomes: stochasticity in gene expression and RNA splicing.
McQuilton P, St. Pierre SE, Thurmond J. 2012.FlyBase 101–the basics of navigating FlyBase.
Nucleic Acids Research40(Database issue):D706–D714DOI 10.1093/nar/gkr1030.
Mortazavi A, Williams BA, McCue K, Schaeffer L, Wold B. 2008.Mapping and quantifying mam-malian transcriptomes by RNA-Seq.Nature Methods5(7):621–628DOI 10.1038/nmeth.1226.
Perez F, Granger BE. 2007.IPython: a system for interactive scientific computing.Computing in Science & Engineering9:21–29DOI 10.1109/MCSE.2007.53.
Picelli S, Bj¨orklund ˚AK, Faridani OR, Sagasser S, Winberg G, Sandberg R. 2013.Smart-seq2 for sensitive full-length transcriptome profiling in single cells.Nature Methods10(11):1096–1098 DOI 10.1038/nmeth.2639.
Picelli S, Faridani OR, Bj¨orklund ˚AK, Winberg G, Sagasser S, Sandberg R. 2014.
Full-length RNA-seq from single cells using Smart-seq2.Nature Protocols9(1):171–181 DOI 10.1038/nprot.2014.006.
Ramsk¨old D, Luo S, Wang Y-C, Li R, Deng Q, Faridani OR, Daniels GA, Khrebtukova I,
Loring JF, Laurent LC, Schroth GP, Sandberg R. 2012.Full-length mRNA-Seq from single-cell levels of RNA and individual circulating tumor cells.Nature Biotechnology30(8):777–782 DOI 10.1038/nbt.2282.
Sasagawa Y, Nikaido I, Hayashi T, Danno H, Uno KD, Imai T, Ueda HR. 2013.Quartz-Seq: a highly reproducible and sensitive single-cell RNA sequencing method, reveals non-genetic gene-expression heterogeneity.Genome Biology14(4):R31DOI 10.1186/gb-2013-14-4-r31.
Tang F, Barbacioru C, Wang Y, Nordman E, Lee C, Xu N, Wang X, Bodeau J, Tuch BB, Siddiqui A, Lao K, Surani MA. 2009.mRNA-Seq whole-transcriptome analysis of a single cell.Nature Methods6(5):377–382DOI 10.1038/nmeth.1315.
Treutlein B, Brownfield DG, Wu AR, NeffNF, Mantalas GL, Espinoza FH, Desai TJ,
Krasnow MA, Quake SR. 2014.Reconstructing lineage hierarchies of the distal lung epithelium using single-cell RNA-seq.Nature509(7500):371–375DOI 10.1038/nature13173.