Ocean Sci., 9, 249–259, 2013 www.ocean-sci.net/9/249/2013/ doi:10.5194/os-9-249-2013
© Author(s) 2013. CC Attribution 3.0 License.
Geoscientiic
Geoscientiic
Geoscientiic
Ocean Science
Open Access
Manifestation of two meddies in altimetry and sea-surface
temperature
I. Bashmachnikov1,2, D. Boutov1, and J. Dias1,2
1Centro de Oceanografia, Faculdade de Ciˆencias, Universidade de Lisboa, Campo Grande, 1749-016 Lissabon, Portugal 2Departamento de Engenharia Geogr´afica, Geof´ısica e Energia (DEGGE), Faculdade de Ciˆencias, Universidade de Lisboa, Campo Grande, 1749-016 Lissabon, Portugal
Correspondence to:I. Bashmachnikov ([email protected].)
Received: 31 August 2012 – Published in Ocean Sci. Discuss.: 27 September 2012 Revised: 22 December 2012 – Accepted: 8 February 2013 – Published: 5 March 2013
Abstract.Two meddies were identified in the Iberian Basin using shipboard ADCP (Meddy 1) and Argo float (Meddy 2) in contrasting background conditions. Meddy 1 was ob-served while interacting with the Azores Current (AzC), while Meddy 2 was observed in a much calmer dynamical background, north from the AzC jet. In both cases the med-dies formed a clear anticyclonic surface signal, detectable in altimetry as well as in sea-surface temperature (SST).
Analysis of the in situ observations of the dynamic signal over Meddy 1 showed that the signal, generated by the mov-ing meddy, dominated the AzC dynamics at least up to the base of the seasonal thermocline even at the late stages of its interaction with the jet. The centre of rotation of the sur-face signal was shifted south-westward from the axis of the meddy by about 18 km, and its dynamic radius was 2 times bigger than that of the meddy.
In the centre of the anticyclonic surface signals of both meddies, SST was colder than that of the surrounding water, in contrast to warm SST anomalies in the cores of surface anticyclones generated by meandering surface currents. The latter difference gives ground for identification of meddies (as well as other sub-surface anticyclones) in comparatively dynamically calm regions using coupled altimetry–SST re-mote sensing data. An identification of Meddy 1 prior to the shipboard ADCP measurements was the first successful ex-perience. At the same time, SST anomalies over the meddies were rather weak, often unstable and statistically significant only over periods of months.
1 Introduction
In the pioneering work of K¨ase and Zenk (1987) the exis-tence of surface anticyclonic signals over meddies was first identified using surface drifter trajectories. Since then a num-ber of in situ observations of meddy dynamic signals at the sea surface have been obtained (Pingree and Le Cann, 1993a, b; Schultz Tokos et al., 1994; Tychensky and Carton, 1998; Paillet et al., 2002, see also a review in Bashmachnikov et al., 2009a). On average, the peak relative vorticity of the sur-face signals was around−0.1f (wheref is the Coriolis pa-rameter), close to 30 % of the peak relative vorticity of the parent meddies. The peak azimuthal velocities of the sur-face signals ranged from 5 to 15 cm s−1, comparable with the peak azimuthal velocities of surface eddies in the sub-tropical North-East Atlantic (Shoosmith et al., 2005). Com-bining along-track altimetry data with in situ observation of several meddies, Oliveira et al. (2000) demonstrated positive anomalies of sea-level height of order of 10 cm coupled with the meddies. The observed radiuses of the anomalies were 30–75 km and the azimuthal velocities were inside the above-mentioned range, obtained from in situ observations.
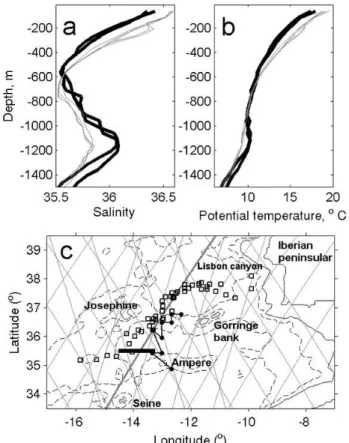
Fig. 1.Vertical profiles of(a)salinity and(b)potential temperature obtained near Seine seamount in July 2004. Thick black lines are the casts through a meddy, and thin grey lines are the casts around the meddy.(c)Area of study with topographic contours of 0 and 1000 m (solid black lines), 2000 and 4000 m (dashed black lines); some bathymetry features are identified. Straight grey lines present altimetry tracks crossing the study region during a 10-day period centred on 20 August 2010. The Jason pass 137 is marked with a thicker line. The trajectory of Meddy 1 (black line with filled-in circles) and surfacing positions of an Argo float when trapped in Meddy 2 (squares) are presented.
anomaly exceeding the AVISO (2011) altimetry noise level (Bashmachnikov and Carton, 2012).
For several meddies tracked by deep floats in the subtrop-ical Atlantic, evidence of high stability of their surface sig-nals was obtained. Statistical analysis of the surface signa-tures of those deep tracked meddies showed that the meddies were accompanied with an anticyclonic signal 90 to 100 % of the time of observations (6 to 18 months), and the rela-tive vorticity of their surface signals was, on average, from
−0.05 to−0.10f (Bashmachnikov and Carton, 2012). Also, 20 to 40 % of the time of observations the meddy surface signals represented the most intensive surface eddies in the surrounding area (the radius of the area was taken as 3–4 times the radius of the meddy surface signal). Stability and relatively high intensity of meddy surface signals allowed un-interrupted surface tracking by means of satellite altimetry of the meddies with known trajectories for periods from several
months up to one year (Stammer et al., 1991; Pingree and Le Cann, 1993a; Pingree, 1995; Bashmachnikov et al., 2009a).
In spite of comparatively high intensity and stability of meddy surface signals, two situations were identified when meddies temporary lose their surface signatures: soon after a meddy had crossed the axis of the Azores Current (AzC) and after a meddy entered into a close interaction with a surface cyclone (Bashmachnikov et al., 2009a; Carton et al., 2010).
The theoretical and model-experimental basis of a meddy interaction with a jet flow is described in a number of studies. In particular, it has been found that a large-scale background current of zonal direction, either barotropic (Van Leeuwen, 2007) or baroclinic (Vandermeirsch et al., 2001), does not have a significant advective effect on the drift characteris-tics of a meddy. Meanwhile, a meridional background current may be efficient in translation of a meddy (Dewar and Meng, 1995; Morel, 1995). The mechanism of cross-jet transla-tion of a meddy approaching a zonal jet from the north lies in the generation of an anticyclonic–cyclonic meander pair in the jet (Vandermeirsch et al., 2003). The generated anti-cyclonic meander moves north-eastwards and overlays the meddy, whereas a cyclonic meander simultaneously inten-sifies to the south-east of the meddy and transforms into a vortex. It is this cyclonic vortex which forces the meddy to move rapidly south, crossing the jet. The crossing takes place only if the meddy is sufficiently strong, i.e. its peak relative vorticity exceeds the maximum horizontal shear in the jet.
In this paper we describe observational evidence of med-dies forming a specific signature in the sea-surface temper-ature (SST), which may further be exploited into methods of remote identification of meddies (as well as other inten-sive deep anticyclonic eddies) in comparatively dynamically calm regions, such as the subtropical NE Atlantic.
2 Material and methods
An oceanographic survey onboard R/V Almirante Gago Coutinhoin the Iberian Basin took place during the period of 24–28 August 2010. During the campaign, 75-kHz ship-board ADCP data (down to 800-m depth with a bin size of 32 m) were collected. The data were initially processed using VmDAS Teledyne RD Instruments software (http:// www.rdinstruments.com/). To reduce the small-scale noise, the components of the ADCP-derived current velocity were smoothed in horizontal and vertical directions by applying the 2nd-order Savitzky–Golay filter with the smoothing win-dow sizes of 5 km and 100 m, respectively. The barotropic tidal current in the region is less than 3 cm s−1(Egbert and Erofeeva, 2002), an order of magnitude smaller than the ob-served meddy signal, and its effect was neglected.
Using AVISO (2011) altimetry data, the meddy observed during the cruise (Meddy 1, Fig. 1c) was tracked forward and backward in time by following the associated surface anomaly of relative vorticity. Efficiency of surface eddy tracking with their relative vorticity, as compared with those of the sea-level elevations, was introduced by Isern-Fontanet et al. (2003) and successfully tested for meddies in Bash-machnikov et al. (2009a). In fact, the anomalies in relative vorticity are less often masked by merging with other surface dynamic structures than those of the sea level.
Another meddy (Meddy 2, Fig. 1c) was detected with an Argo float. The data were obtained from the Coriolis opera-tional data centre (ftp://ftp.ifremer.fr). The float was consid-ered to be within a meddy when in its vertical profiles the mean salinity anomaly in the 800–1500-m layer exceeded 0.25. The vertical profiles of the World Ocean Atlas climatol-ogy (WOA09) were taken as reference. The analysis showed that the float was trapped within the meddy near Lisbon canyon and left the meddy after it passed by the Josephine seamounts. In total, 39 successive vertical profiles within the meddy were detected.
The surface signatures of the selected meddies were stud-ied using the gridded “updated” AVISO altimetry data with the grid-cell size of about 30×30 km and weekly
tempo-ral resolution (AVISO, 2011). The AVISO sea-level mea-surements error is claimed to be less than 3–4 cm (Fu and Cazenav, 2001). Chelton et al. (2011) developed a global em-pirical criterion for the spatial resolution capability of the altimetry data of the AVISO “reference” series (i.e. where data from only 2 satellites are used). These authors, consid-ering the Rayleigh vortex model, claimed that an eddy can be detected with altimetry data when the mean e-folding scale of the related sea-level anomaly exceeds a certain limit. In our study region (35◦
N) this critical scale is around 36 km. Meanwhile, when an eddy is situated close to an altimetry track, the spatial resolution of the detected signals increases several times. Also, the usage of the “updated” AVISO series (for our study periods we get data from 3 satellites) decreases the time interval between the sampling along the same tracks
and increases the signal-to-noise ratio of the resulting AVISO products. Therefore, Chelton’s scale presents rather the lower limit of the “true” eddy-resolving scale of AVISO altimetry data. Complementary to the AVISO data set, we used satel-lite along-track sea-level anomalies (SLA) provided by the Radar Altimeter Database System (RADS, 2011). The latter has 5–7-km linear resolution and the claimed altimetric mea-surement error of less than 2 cm.
The fields of sea-level height were transformed to those of the sea-surface current velocity and relative vorticity using the geostrophic relations. To reduce the SLA measurement noise the 7-point stencil width was used, as recommended in Arbic et al. (2012).
SST data are obtained from the Multiscale Ultra-high Res-olution sea-surface temperature data base (MUR, 2011). The results were based upon the merged nighttime measurements of infrared and microwave sensors (AVHRR, MODIS and AMSR), combined with surface observations from ships and buoys to obtain so-called foundation temperature, i.e. the up-per ocean temup-perature below the surface skin layer. The SST data has 1.1×1.1 km spatial resolution and daily temporal resolution. The MUR algorithm of merging SST images from various sensors incorporates the Parameter Matrix Objective Analysis (Mariano and Brown, 1992). The latter compen-sates for motion of mesoscale structures during the period of merging, keeping the SST gradients of frontal interfaces in the merged images as sharp as in the original images.
3 In situ observations of Meddy 1 and its surface signals
The in situ ADCP observations in August 2010 show that during the cruise a deep anticyclonic eddy was crossed (Fig. 2a). The eddy centre is located approximately 80 km to the east from the western edge of transect 2. The profiles of the current velocities suggest that it was crossed slightly north of its centre (Fig. 2b).
The dynamic core of the eddy is situated in the Mediter-ranean water (MW) layer, its dynamic radius was 10–15 km and the maximum rotation velocities were 30–40 cm s−1. These characteristics are similar to the ones of meddies in the Iberian Basin (Pingree and Le Cann, 1993b; Schultz Tokos et al., 1994). Since in the study region no other deep anticy-clonic vortexes in the MW layer with comparable size and intensity were registered, we claim that the observed vor-tex is a meddy, even though no direct temperature-salinity measurements are available during the time of the cruise. Weak positive salinity and temperature anomalies in the 800–1100 m layer (0.2 and 0.5◦
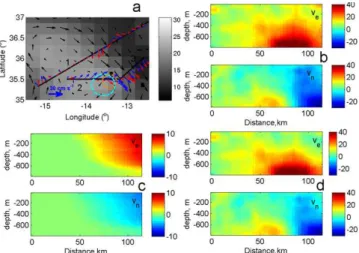
Fig. 2. (a)The sea-level height (cm, colour scale) and AVISO al-timetry currents for 24 August 2010 (black arrows). ADCP currents for 27 Agust 2010 at 100 m (red arrows) and at 700 m (blue arrows) are also presented. The positions of Meddy 1 and its surface signal, derived from the ADCP data, are presented as orange and cyan cir-cles, respectively. The two black squares mark 2 positions of the vertical profiles of an Argo float where the meddy-like anomaly was registered.(b)East (Ve)and north (Vn)velocity components
(cm s−1)obtained by shipboard ADCP on 27 August 2010 along
transect 2.(c)Contribution of the AzC.(d) The same as(b), but after subtraction of the contribution of the AzC.
Figure 2a gives evidence that the surface currents derived from the AVISO data set well correspond to the in situ ADCP measurements. The altimetry-derived currents showed that during the cruise the ship crossed the AzC 3 times. In the easternmost part of transect 2 the AzC axis is directed 120◦,
clockwise from north, and is affecting the current structure in the vicinity of the meddy. For further estimates of char-acteristics of the dynamic signal of the meddy, we filter out the current component related to the AzC. This can be done since current velocity along the transect 2 is clearly domi-nated by the meddy dynamics (Fig. 2b). Using the ADCP information at the transect 1, where the AzC is not affected by the meddy, we come up with a model of the AzC: the AzC velocity linearly decreases from its maximum at the jet axis to zero at distances of 700 m vertically and 60 km horizon-tally (Fig. 2c). The ADCP current in transect 2 with the AzC contribution removed is presented in Fig. 2d. As expected, the filtering did not change the overall structure of the cur-rents in and over the meddy. Even in the easternmost upper part of the section the filtering only led to accentuation of the anticyclonic structure over the meddy, now becoming more symmetric relative to the centre of the deep anticyclonic sig-nal. The westernmost part of transect 2 also presents some in-fluence of the northward-directed AzC (the western side the meander, Fig. 2a), but its influence on the current structure around the meddy is insignificant and was not filtered out.
The module of velocity for each ADCP bin along the tran-sect 2, with the AzC filtered out, is presented in Fig. 3a. The
Fig. 3. (a)Velocity magnitude (cm s−1)along transect 2 for each of the ADCP bins, after the AzC is removed. Black: 40–100 m levels; red: 130–200 m; cyan: 230–300 m; magenta: 320–500 m; green: 510–610 m; and blue: 650–800 m. The vertically aligned black dashes identify the centres of the meddy (upper line) and of its surface signal (lower line).(b)Maximum azimuthal velocity of the eddy (Vaz, cm s−1, green line), zonal distances of the eddy centre
relative to the western tip of transect 2 (xc, km, black line),
merid-ional distances of the eddy centre relative to mean meridmerid-ional posi-tion of transect 2 (yc, km, red lines), and the dynamic radius of the
eddy (R, km, blue lines). The dashed and dotted lines are the esti-mates of the corresponding parameters using only western or only eastern maximum of current velocity; solid lines are the means of the previous two. Straight, vertical dotted lines of the corresponding colour are given as a reference frame.
upwards decrease of the eddy intensity is similar to that pre-viously observed over meddies (Pingree and Le Cann, 1993b; Paillet et al., 2002) and can be identified as the meddy sur-face signal. The anticyclonic signature is also observed in the AVISO altimetry, with its centre situated a bit west as com-pared to in situ ADCP observations (Fig. 2a). The discrep-ancy most probably is due to spatial-temporal smoothing of gridded AVISO altimetry products (Fu and Cazenav, 2001).
AzC was previously minimized by the filtering procedure described above (Fig. 2d).
At a given depth level, the coordinates of the velocity maxima are identified by (xw, yw)and(xe, ye)(“w” iden-tifies the western and “e” the eastern maxima) and the cur-rent directions relative to geographic north areαw andαe, respectively. The zonal position of the eddy axis is then ob-tained from the location of points of minimum velocity be-tween the two velocity maxima (dashed lines in Fig. 3a), ex-pressed in terms of the distance of the eddy centre to the be-ginning of the transect (xc)(Fig. 3b). To define the merid-ional position of the eddy centre relative to the transect line (yc), two independent estimates are made:ycw=yw−(xc−
xw)tan(βw); andyce=ye−(xc−xe)tan(βe), whereβw, e=
90−αw, e. Further, the two estimates of the dynamic radius of the vortex are made:Rw=p(xc−xw)2+(ycw−yw)2 and Re=p(xc−xe)2+(yce−ye)2. The final distance,yc, and the dynamic radius of the vortex, R, are the mean of the two estimates (Fig. 3b).
The calculated parameters permit identifying two dynamic layers: the meddy itself, from 650 to 800 m, and its surface signal, above 550 m (Fig. 3b). The axis of the meddy is situ-ated atxc=83 km andyc= −5 km, i.e. south of the transect line. The meddy dynamic radius is 12 km and is compara-ble with the radiuses of meddies observed by Pingree and Le Cann (1993b) or Pailet et al. (2002). It is also about the sec-ond baroclinic Rossby radius of deformation. The centre of the meddy surface signal is shifted on average 18 km south-westward from the centre of the meddy. The dynamic radius of the former gradually increases upwards and on average is around 25 km, close to the first baroclinic Rossby radius of deformation. The transition between the meddy and its sur-face signal at 500–600 m depth is characterized by the max-imum vertical gradient of the horizontal velocity, an abrupt shift of the centre of the vortex and a rapid increase in the dynamic radius by about 7 km. This suggests that we are dealing with two different interacting eddies. This goes well with the proposed mechanism of generation of meddy sur-face signal as a stand-alone vortex forced by a meddy (see Introduction). Further dynamics of such connected vortices, separated by the distance of less than two eddy diameters, should be co-rotation around a common centre (Polvani, 1991). In our case, as the radius of the surface signal is twice that of the meddy, it should overlay the meddy at all stages of the interaction.
In the upper 200-m layer the computed central positions (ycw and yce) diverge, and in the 100-m layer the mean of the two estimates (yc)changes significantly with depth. This may result from the unfiltered effect of other structures, since in this layer the meddy surface signal is comparatively weak (5–10 cm s−1).
During the ADCP observations along transect 2, the wind speed increased from 1 to 8 m s−1. Thus, the Ekman layer at the eastern end of the transect should reach at maximum
40 m, and the drift current at the base of the Ekman layer should be at maximum 5 cm s−1. Therefore, the wind driven current may affect only the uppermost ADCP bin. It is more plausible that the characteristics of current velocity of the meddy surface signal in the uppermost layer are distorted by sub-mesoscale surface eddies. In fact, the modulus of cur-rent velocity in the upper 100-m layer (Fig. 3a, black lines) showed strong spatial variation at the scales of 10–15 km, which is not observed at deeper levels. Therefore, when esti-mating the mean characteristics of the meddy surface signal we disregard the uppermost 100-m layer.
3.1 Tracking surface signal of Meddy 1 with altimetry
Relative to the period of the in situ measurements, the meddy was tracked forward and backward with the gridded AVISO altimetry data (Fig. 4a). With the radius of the maximum azimuthal velocity of 25 km at the sea surface, the e-folding scale is 36 km, at the limit of detection of Rayleigh-type vor-tices (Chelton et al., 2011). The theoretical results (Bash-machnikov and Carton, 2012) as well as results of numeri-cal modelling (Filyushkin et al., 2011) showed that the ex-pected shape of the meddy surface signal should be closer to that of the Burgers vortex, which has a significantly larger e-folding scale than the Rayleigh vortex. WithR=25 km, the
e-folding scale of the sea-level anomaly in the Burgers vor-tex should be over 80 km, and the relative vorticity should change the sign at the distance of 50 km from its centre. In fact, a vortex forced by vertical velocity at its lower bound-ary (as it happened for the meddy surface signal) has a solu-tion in the form of the Burgers vortex (Wu et al., 2006). This justifies the ability to detect and securely track with AVISO altimetry a surface signal of even comparatively modest med-dies, such as Meddy 1.
The possibility of obtaining uninterrupted surface tracks of meddies during the initial period of their crossing of the AzC was successfully tested by tracking surface signals of meddies followed in situ by deep RAFOS floats (Bashmach-nikov et al., 2009a). The surface structure observed in Au-gust over Meddy 1 was followed through sequential posi-tions of the sea-surface-relative vorticity minima back to the end of April 2010. During these 4 months the surface sig-nal was travelling south-south-west, approximately along the 137 pass of Jason-1 (Fig. 4a). This made it easy to obtain a complementary study of the meddy surface signal with high-resolution, unsmoothed along-track SLA from the RADS data set (Fig. 4b). In this data set the surface anticyclonic structure can also be continuously followed back for the same period of time.
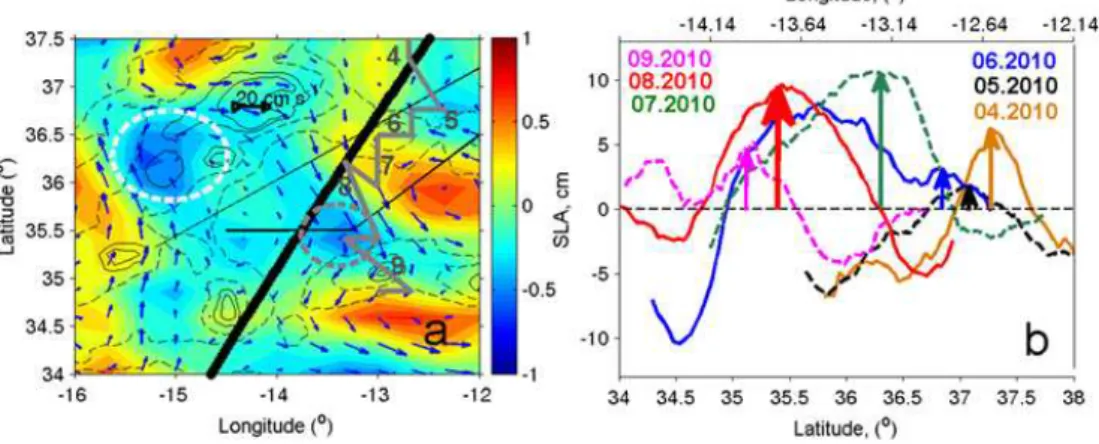
Fig. 4. (a)Relative vorticity (10−5s−1)and geostrophic currents (cm s−1)on 24 August 2010 computed from AVISO altimetry. Position
of the meddy surface signal during this date is marked with a grey circle; position of the anticyclonic meander of the AzC is marked with a white circle. Pass 137 of Jason-1 (thick black line), the ADCP sections (thin black lines) and the meddy track (thick grey line) are overlaid. The numbers near the meddy track mark the beginnings of the respective months. Depth contours of 1000 and 1500 m (solid lines), 3000 and 4000 m (dashed lines) are shown.(b)Local sea-level anomalies (SLA, cm) of Jason-1 (pass 137) from April to September 2010, from the RADS data set (to increase clarity only every 3rd profile is presented in the figure). SLA for different months is presented with different colours. Arrows mark the centres of the tracked meddy signal, the thick arrow marks the centre of the meddy at the time of the cruise.
5–10 cm in SLA (see also Oliveira et al., 2000) and 0.4– 0.9×10⁻⁵s−1in peak relative vorticity, clearly
distinguish-able from the background noise.
Comparing AVISO and RADS data, we can conclude that in the beginning of the registered journey, from April to May 2010, the SLA decrease (Fig. 4b) was at least partly due to the meddy moving away from the closest altimetry track, pass 137 of Jason-1. In June 2010, as the tracked sur-face signal approached the AzC, formation of an AzC mean-der was initiated. Then the tracked signal began merging with the meander (Fig. 4b), while a cyclone is generated and in-tensified to the south-east. During the merge the intensity of the signal increased drastically. Through a rather short period of perfect alignment with the AzC meander in July 2010, the signal reached, in SLA, 10 cm relative to the reference level and 15–20 cm relative to the closest minimum. The absolute value of the peak relative vorticity of the signal increased over 0.6×10⁻⁵s−1. In August, forced by the intensified
cy-clone to the east, the meddy travelled south (Fig. 4a) and the intensity of its surface signal gradually decreased. The crossing of the AzC by the tracked vorticity surface structure closely corresponds to what is described in Vandermeirsch et al. (2003) for a deep eddy crossing a jet. The same be-haviour of a meddy and its surface signal was observed as the RAFOS-tracked meddy Hyperion (Richardson and Ty-chensky, 1998) was crossing the AzC (Bashmachnikov et al., 2009a).
In September 2010, as the meddy ran on the Ampere seamount, its surface signal split into 2 parts. This may result from the meddy splitting by the seamount into 2 vortices as it interacted with topography (Cenedese, 2002; Richardson et al., 2000), but it may also be a result of the AzC detaching
the surface signal from the meddy and transporting it south-westward, while the meddy passed west of the seamount and formed a new surface signature. The decrease and loss of the meddy surface signal in the AVISO altimetry maps dur-ing one of the weeks in September 2010 (not shown) most probably is a result of interruption of pass 137 over the ex-pected meddy position. Those two instances – of variation of the meddy position relative to the closest available satellite track and passing across the temporal gap in the along-track altimetry data (in April–May and September 2010, respec-tively) – have implications for apparent variation of intensity of meddy surface signals derived from altimetry.
3.2 Surface signal of two meddies in SST
In this section we investigate meddy signal in SST fields. The radial structure of the surface signal of Meddy 1 in vortic-ity and SST was studied by averaging the relative vorticvortic-ity (ω)and the SST values over the concentric rings extending 0–25 km (ω25, SST25), 25–50 km (ω50, SST50), 50–75 km (ω75, SST75)and 75–100 km (ω100, SST100)from the centre of the dynamic surface signal of a meddy, identified as the peak negative ωof the signal. The results are presented in Fig. 5a. We estimated the mean SST anomalies in the central rings relative to the mean SST in the 75–100 km ring rep-resenting the surrounding water (SST25–SST100and SST50– SST100). The results showed that, during the 5 months of ob-servations, negative SST anomaly overlaid the meddy 80 % of time and on average was−0.11◦
C, with the 95 % confi-dence interval of the mean of 0.06◦
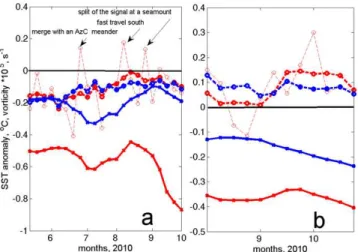
Fig. 5.Monthly running means of SST anomaly (◦C, thick dashed lines) and relative vorticity (10−5s−1, solid lines) of the surface
signal of Meddy 1(a)and of the AzC meander(b). The red lines are SST25–SST100 and mean relative vorticity in the 25-km
cir-cle around the vortex centre; the blue lines are SST50–SST100and
mean relative vorticity in the 25–50-km ring around the vortex cen-tre. The SST25–SST100with original (weekly) temporal resolution
is also shown as thin red dash lines.
corresponds to the time of the fast southward translation of the meddy and of its surface signal.
The negative SST anomaly over Meddy 1 contrasts with the positive SST anomalies characteristic for the anticyclones formed as a result of instability of the upper ocean flows. As an example, an AzC meander was tracked for nearly 3 months after Meddy 1 had separated from it. In September 2010 the position of the meander is marked with the white dashed circle in Fig. 4a, 100 km north-west of the meddy. The analysis showed that 85 % of the time the centre of the meander was associated with a positive SST anomaly, on av-erage of 0.08◦
C, with the 95 % confidence interval of 0.06◦
C (Fig. 5b).
An example of formation of a negative SST anomaly in the centre of the surface signal of Meddy 1 is presented in Fig. 6. Soon after the meddy surface signal began merging with the meander of the AzC (during the first–second weeks of July 2010) the colder water from the north and north-east was advected south. At the same time, a ring of warmer wa-ter from the south and south-west began wrapping around the meddy. By the third week of July the centre of the merged anticyclonic signal was associated with a pronounced cold-core SST anomaly (Fig. 6a). The next week the signal was fully surrounded by a warm water ring (Fig. 6b). The sign of the anomaly, as well as the observed SST pattern, reaffirms the dynamic dominance of Meddy 1 during the interaction with the AzC meander. A similar situation, when a meddy interacted with the AzC and then drifted northwest of it, re-sulted in a warm ring remaining attached to the meddy after it separated from the jet (Bashmachnikov et al., 2009a).
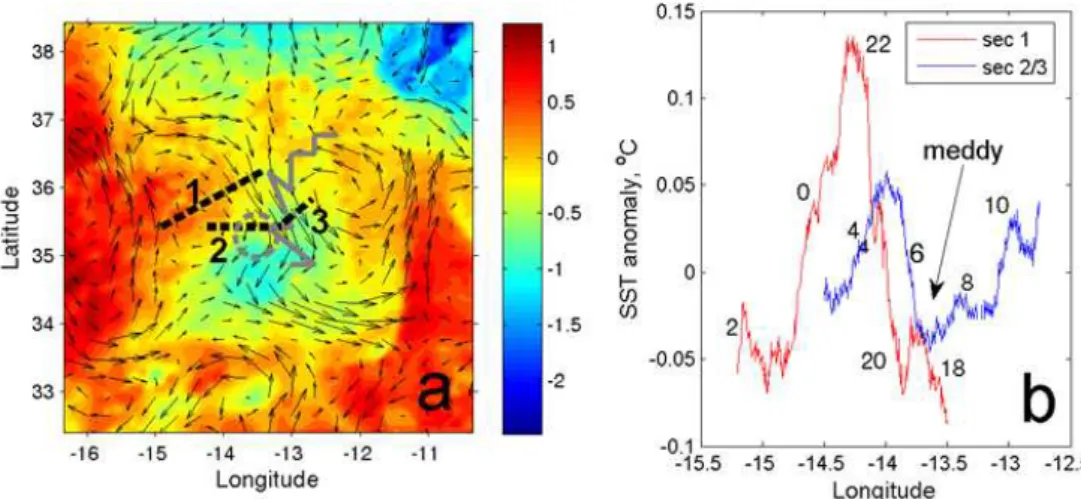
The SST field at the time of the cruise gives evidence that a cold anomaly may not always overlay the meddy. At the end of August 2010 the centre of the cold SST anomaly was shifted south of the Meddy 1 position (Fig. 7a). Mean-while, the sign of the SST anomaly over Meddy 1 is sup-ported by in situ sea-surface temperature anomalies obtained with the thermometer incorporated in the shipboard ADCP (Fig. 7b). On the figure, to highlight the mesoscale variation of temperature and suppress its diurnal variations, as well as the large-scale horizontal temperature gradients, linear trends over short segments of the ship trajectory (5–8 h or 150 km along the ship track) were removed.
The separation of the cold SST anomaly from the meddy centre is close to 100 km, far exceeding the south-ward shift of the dynamic surface signal relative to the meddy (about 18 km). The separation of the SST cold plume may result from advection of the SST anomaly by the AzC with a speed exceeding that of the meddy translation. The latter may happen when the meddy dynamic signal at the surface is weak as compared to the background advection. This con-dition is verified by the end of July 2010, after the meddy had separated from the AzC meander. During 25 days (up to the time of the cruise), the surface dynamic structure asso-ciated with Meddy 1 travelled 100 km south-south-east with an average speed of 4.5 cm s−1. If travelling with the locally observed speed of the AzC of 12 cm s−1, during the same pe-riod of time the SST anomaly should become separated from the meddy by about 130 km, only 30 km further south than observed.
The obvious drawback of the previous analysis lies in the indirect observations of the path of Meddy 1. To obtain fur-ther proof, SST anomalies over anofur-ther meddy (Meddy 2) tracked in situ with an Argo float, were studied (Fig. 8a). The meddy was identified in Argo vertical profiles as a salinity anomaly exceeding 0.3 in the 750–1500-m layer (relative to WOA09 climatic data at the same depth levels). The analysis showed that the Argo float followed Meddy 2 for 7 months, from the very time of its generation near the Lisbon canyon, in October 2005, to May 2006. During the time of obser-vation the meddy propagated south-west in a dynamically calm area to the north of the AzC jet. At the sea surface the meddy could be continuously followed as a pronounced neg-ative anomaly in relneg-ative vorticity changing in the range of 0.05–0.08f (Fig. 8b). The positions of surfacing of the Argo float most of the time corresponded to the central part of the anticyclonic surface signal of Meddy 2. The dynamic radius of the meddy surface signature, as it can be derived from al-timetry, was of order of 50 km. During 75 % of the time of observations the surface signal of Meddy 2 was associated with a negative SST anomaly (relative to the surrounding wa-ter). The SST25–SST100and SST50–SST100differences were on average−0.15◦
C, at times reaching−0.20◦
C, with the 95 % confidence interval of the mean at 0.05◦
Fig. 6.Anomalies of SST (◦C) around Meddy 1 (marked as the dashed circles) backtracked with surface vorticity on the 22nd(a)and 29th(b) of June 2010. Anomalies are computed by subtracting the mean value of SST over the presented area. AVISO altimetry currents are overlaid. Thick grey lines mark the meddy track and black circles show the extension of the associated negative anomalies of relative vorticity for the dates presented.
Fig. 7. (a)Anomalies of SST (◦C) on 24 August 2010. The segments of the cruise tracks 1 and 2–3 are shown. The thick grey line marks the meddy track; the position of the surface signal of the meddy on 24 August 2010 is marked with a dashed circle. AVISO altimetry currents are overlaid.(b)Temperature anomalies from the ADCP-incorporated thermometer at 4-m depth along the transects 1 and 2–3, as shown in (a). Linear trends along the segments of the sections are removed. The numbers represent the time (hours of day) of temperature acquisition.
of the entrainment mechanism in formation of the cold-core anomaly over the meddy. If so, intensification of the anticy-clonic circulation should lead to intensification of the surface water convergence and, therefore, to the intensification of the negative SST anomaly over a meddy.
To verify the later hypothesis, correlations of the peak vor-ticity of the meddy surface signal with the time-delayed SST anomaly in the 0–25-km, 25–50-km and 50–75-km rings rel-ative to SST in the 75–100 km ring, centred in the centre of the dynamic signal, were obtained. With the monthly time lag the correlations with the surface vorticity were the high-est (0.7–0.8) at distances of 25–75 km, while in the central 25-km ring they were 0.5, although also significant. With the lag of 1.5 months the correlations were the highest (0.7) in the central 50-km ring, while at 50–75 km they decreased to
0.5. With the lag of 2 months the correlations were significant (0.5) only in the central 25-km ring. Therefore, the negative SST anomaly in the centre of the meddy surface signal was enhanced following the increase in the anticyclonic circula-tion at the sea surface with an approximately 1.5-month time lag.
Fig. 8. (a)Mean salinity anomalies relative to WOA09 climatic data in the 700–1500-m layer for the consequent Argo vertical profiles (anomalies over 0.3 were identified as Meddy 2). Thin grey contours show bottom topography with a 1000-m interval.(b)Monthly running means of SST25–SST100(◦C, red lines with errorbars) and relative vorticity in the 25-km central ring (10−5s−1, thin red lines with circles).
The respective blue lines are SST50–SST100and mean relative vorticity in the 25–50-km ring around the centre of the meddy surface signal. The errorbars represent the mean error in the calculation of the SST anomalies.
4 Discussion and conclusions
In previous works it has been shown that sufficiently large meddies generate a dynamic signal at the sea surface de-tectable by satellite altimetry and rather persistent in time (Stammer et al., 1991; Pingree and Le Cann, 1993a; Pin-gree, 1995; Bashmachnikov et al., 2009a; Bashmachnikov and Carton, 2012, etc.). The observations of Meddy 1 con-firms that the dynamic surface signal represents a stand-alone vortex, whose axis can be shifted from the axis of the meddy and whose radius is approximately twice that of the meddy (see also Paillet et al., 2002). The combination of altimetry and in the situ ADCP section across Meddy 1 gives evidence that, even inside the AzC, the surface dynamic signal of the meddy was sufficiently strong to be detected with AVISO al-timetry. The meddy surface signal is also thought to dominate the upper-ocean dynamics at different stages of the meddy– current interaction.
In this paper we show that meddies may produce a statisti-cally significant anomaly also in SST. Furthermore, while the dynamic (anticyclonic) surface signal of meddies detected in satellite altimetry is not principally different from the one generated by instability of surface currents, the sign of SST anomalies over meddies is negative, contrasting to positive SST anomalies usually associated with surface anticyclones. This gives ground for identification of meddies (or other deep eddies) with remote sensing data in dynamically calm ocean regions. As an example, Meddy 1, described in this paper, was remotely identified prior to the cruise as an anticyclonic vortex with a negative SST anomaly in the core.
Negative SST anomalies over the two studied meddies were not as stable as their surface dynamic anomalies (in either sea-level or relative vorticity). Nevertheless the SST anomalies were negative for 70–80 % of the time of tracking of the meddies. Lower stability of the SST anomalies may partly lie in their rather small absolute values, at the limit of
the precision of the actual SST products. The patchy remnant cloud effects add additional noise to the results. At the same time, the average SST anomalies over the period of several months proved to be statistically significant.
Lower SST over a meddy may result from several pro-cesses. The first one, mentioned in Introduction, consists in the uplifting of isopycnals by a moving meddy. In subtropi-cal upper ocean, the SST signal produced by this mechanism may be masked by the seasonal thermocline and appear only sporadically during the periods of enhanced vertical mixing. Another mechanism consists in the formation of a nega-tive SST anomaly as a result of differential fluid entrainment: the colder fluid (entrained from the north) is advected to-wards the centre of a meddy surface signal, while the warmer fluid (entrained from the south) is wrapped around the cold core. Theoretical considerations suggest that the meddy sur-face signal should be generated over the frontside slope of a moving meddy (Bashmachnikov and Carton, 2012). After the surface signal has been formed, the two vortices become cou-pled. At the seasurface water convergence in the generated surface anticyclonic signale should dominate the secondary circulation over the meddy. Due to doming of isopycnals over the meddy, the colder and denser water more readily con-verges towards the central part of its surface signal, while the less-dense and warmer water stays at its periphery. This process is clearly visible during the interaction of Meddy 1 with the frontal interface of the AzC (Fig. 6). It also seems to be the most plausible mechanism of the cold SST anomaly formation over Meddy 2. The importance of this mechanism is supported by the observed gradual progress of the nega-tive SST anomaly towards the centre after intensification of the surface dynamic signal, while no radial propagation is expected when the first mechanism is dominating.
should depend both on changes in the intensity of the dy-namic surface signal of a meddy as well as on the background SST gradients. In the subtropical North-East Atlantic the meridional SST gradient increases during winter and spring, and it is during these seasons that stronger negative SST anomalies should be associated with moving meddies.
Supplementary material related to this article is
available online at: http://www.ocean-sci.net/9/249/2013/ os-9-249-2013-supplement.zip.
Acknowledgements. The authors acknowledge the project “CROSTAS” (PDCT/MAR/56823/2004), the cruise team of R/V Almirante Gago Coutinho, and especially to head of the project/cruise H. Monteiro for the performed observations. We ac-knowledge the Centre of Oceanography of the University of Lisbon and the scientific project MEDTRANS (PTDC/MAR/117265/2010) sponsored by FCT. We also acknowledge the contract C2008-UL-CO-3 of Ciencia 2008 between the Portuguese Foundation for Science and Technology (FCT) and the University of Lisbon (UL) for support of I. B.
Edited by: M. Hecht
References
Arbic, B. K., Scott, R. B., Chelton, D. B., Richman, J. G., and Shriver, J. F.: Effects of stencil width on surface ocean geostrophic velocity and vorticity estimation from grid-ded satellite altimeter data, J. Geophys. Res., 117, C03029, doi:10.1029/2003JC001952, 2012.
AVISO: Altimeter products, produced by Ssalto/Duacs and dis-tributed by Aviso, with support from CNES, available at: http: //www.aviso.oceanobs.com, last access: 1 November 2011. Bashmachnikov, I. and Carton, X.: Surface signature of
Mediter-ranean water eddies in the North-East Atlantic: effect of the upper ocean stratification, Ocean Sci. Discuss., 9, 2457–2491, doi:10.5194/osd-9-2457-2012, 2012.
Bashmachnikov, I., Machin, F., Mendonca, A., and Martins, A.: In-situ and remote sensing signature of meddies east of the Mid-Atlantic ridge, J. Geophys. Res., 114, C05018, doi:10.1029/2008JC005032, 2009a.
Bashmachnikov, I., Mohn, C., Pelegr´ı, J. L., Martins, A., Mach´ın, F., Jose, F., and White, M.: Interaction of Mediterranean water eddies with Sedlo and Seine seamounts, Subtropical Northeast Atlantic, Deep-Sea Res. II, 56, 2593–2605, 2009b.
Carton, X., Daniault, N., Alves, J., Cherubin, L., and Ambar, I.: Meddy dynamics and interaction with neighboring eddies south-west of Portugal: Observations and modelling, J. Geophys. Res., 115, C06017, doi:10.1029/2009JC005646, 2010.
Cenedese, C.: Laboratory experiments on mesoscale vortices colliding with a seamount, J. Geophys. Res., 107, 3053, doi:10.1029/2000JC000599, 2002.
Chelton, D. B., Schlax, M. G., and Samelson, R. M.: Global ob-servations of nonlinear mesoscale eddies, Progr. Oceanogr., 91, 167–216, 2011.
Dewar, W. K. and Meng, H.: The propagation of submesoscale vor-tices, J. Phys. Oceanogr., 25, 1745–1770, 1995.
Egbert, G. D. and Erofeeva, S. Y.: Efficient inverse modeling of barotropic ocean tides, J. Atmos. Oceanic Technol., 19, 183–204, 2002.
Filyushkin, B. N., Sokolovskiy, M. A., Kozhelupova, N. G., and Vaginac, I. M.: Reflection of Intrathermocline Eddies on the Ocean Surface, Dokl. Earth Sci., 439, 986–989, 2011.
Fu, L.-L. and Cazenav, A.: Satellite Altimetry and Earth Sciences – A Handbook of Techniques and Applications, International Geo-physics Series 69, Academic Press, London, 463 pp., 2001. Isern-Fontanet, J., Garcia-Ladona, E., and Font, J.: Identification of
marine eddies from altimetric maps, J. Atmos. Oceanic Technol., 20, 772–778, 2003.
K¨ase R. H. and Zenk, W.: Reconstructed Mediterranean salt lens trajectories, J. Phys. Oceanogr., 17, 158–163, 1987.
Mariano, A. J. and Brown, O. B.: Efficient objective analysis of dynamically heterogeneous and nonstationary fields via the pa-rameter matrix, Deep-Sea Res., 39, 1255–1271, 1992.
Morel, Y.: The influence of the upper thermocline currents on in-trathermocline eddies, J. Phys. Oceanogr., 25, 3247–3252, 1995. MUR: Multi-scale Ultra-high Resolution Sea Surface Temperature, provided by Jet Propulsion Laboratory at California Institute of Technology, http://mur.jpl.nasa.gov/InformationText.php, last access: 1 November 2011.
Oliveira, P. B., Serra, N., Fi´uza, A. F. G., and Ambar, I.: A study of meddies using simultaneous in-situ and satellite observations, in: Satellites, Oceanography and Society, Elsevier Oceanography Series 63, Elsevier, Amsterdam, 125–148, 2000.
Paillet, J., Le Cann, B., Carton, X., Morel, Y., and Serpette, A.: Dy-namics and evolution of a northern meddy, J. Phys. Oceanogr., 32, 55–79, 2002.
Pingree, R. D.: The droguing of Meddy Pinball and seeding with ALACE floats, J. Mar. Biol. Assoc. UK, 75, 235–252, 1995. Pingree, R. D. and Le Cann, B.: A shallow meddy (a Smeddy)
from the secondary mediterranean salinity maximum, J. Geo-phys. Res., 98, 20169–20185, 1993a.
Pingree, R. D. and Le Cann, B.: Structure of a meddy (Bobby 92) southeast of the Azores, Deep-Sea Res. I, 40, 2077–2103, 1993b. Polvani, L. M.: Two-layer geostrophic vortex dynamics. Part 2. Alignment and two-layer V-states, J. Fluid Mech., 225, 241–270, 1991.
RADS: Radar Altimeter Database System, provided by Delft Institute for Earth-Oriented Space research (DEOS), The Netherlands, http://rads.tudelft.nl/rads/rads.shtml, last access: 1 November 2011.
Richardson, P. L. and Tychensky, A.: Meddy trajectories in the Ca-nary Basin measured during the Semaphore Experiment, 1993– 1995, J. Geophys. Res., 103, 25029–25045, 1998.
Richardson, P. L., Bower, A. S., and Zenk, W.: A census of Meddies tracked by floats, Progr. Oceanogr., 45, 209–250, 2000. Schultz Tokos, K., Hinrichsen, H. H., and Zenk, W.: Merging and
migration of two meddies, J. Phys. Oceanogr., 24, 2129–2141, 1994.
looping RAFOS floats, Deep-Sea Res. II, 52, 627–650, 2005. Siedler, G., Armi, L., and Muller, T. J.: Meddies and decadal
changes at the Azores front from 1980 to 2000, Deep-Sea Rese. II, 52, 585–604, 2005.
Stammer, D., Hinrichsen, H. H., and K¨ase, R. H.: Can meddies be detected by satellite altimetry?, J. Geophys. Res., 96, 7005–7014, 1991.
Tychensky, A. and Carton, X.: Hydrological and dynamical charac-teristics of Meddies in the Azores region: a paradigm for baro-clinic vortex dynamics, J. Geophys. Res., 103, 25061–25079, 1998.
Van Leeuwen, P. J.: The propagation mechanism of a vortex on the
βplane, J. Phys. Oceanogr., 37, 2316–2330, 2007.
Vandermeirsch, F., Morel, Y,. and Sutyrin, G.: Net advective ef-fect of a vertically sheared current on a coherent vortex, J. Phys. Oceanogr., 31, 2210–2225, 2001.
Vandermeirsch, F. O., Carton, X. J., and Morel, Y. G.: Interaction between an eddy and a zonal jet – Part I, Dyn. Atmos. Oceans, 36, 247–270, 2003.
WOA09: World Ocean Atlas 2009, available at: http://www.nodc. noaa.gov/OC5/WOA09/pubwoa09.html (last access: 1 Novem-ber 2011), 2010.