RODOLFO GONZALEZ CAMARGO
Insulin resistance in Cancer cachexia and
Metabolic Syndrome: Role of insulin activated
macrophages and miRNA-21-5p
Thesis presented to the Post-Graduate Program in Cell and Tissue Biology, Instituto de Ciências Biomédicas, Universidade de São Paulo and to the Post-Graduate Program in Nutritional Biochemistry, Institüt für Ernährungswissenschaft, Universität Potsdam, to obtain the Ph.D. title.
Area: Cell and Tissue Biology and Nutritional Biochemistry
Advisors: Dr. Marília Cerqueira Leite Seelaender and Dr. Gerhard Paul Püschel
Original Version
Resistência à Insulina na Caquexia Associada ao
Câncer e na Síndrome Metabólica: Papel dos
Macrófagos ativados pela Insulina e do
miRNA-21-5p
Tese apresentada ao Departamento de Biologia Celular e do Desenvolvimento do Instituto de Ciências Biomédicas da Universidade de São Paulo e ao programa de Pós-Graduação em Bioquímica dos Alimentos do Instituto de Ciências dos Alimentos da Universidade de Potsdam para obtenção do título de doutor em Ciências.
Área: Biologia Celular e do Desenvolvimento e Bioquímica dos Alimentos
Orientadores: Dra. Marília Cerqueira Leite Seelaender e Dr. Gerhard Paul Püschel
Versão original
To my family, the reason for my existence and to the hope that we can change the reality
activated macrophages and miRNA-21-5p. [Ph.D. Thesis (Celular and Tissue biology)]. São Paulo: Instituto de Ciências Biomédicas, Universidade de São Paulo; 2016. Potsdam: Institüt für Ernährungswissenschaft, Universität Potsdam; 2016.
The ever-increasing fat content in Western diet, combined with decreased levels of physical activity, greatly enhance the incidence of metabolic-related diseases. Cancer cachexia (CC) and Metabolic syndrome (MetS) are both multifactorial highly complex metabolism related syndromes, whose etiology is not fully understood, as the mechanisms underlying their de elop e t a e ot o pletel u eiled. Ne e theless, despite ei g o side ed opposite sides , Met“ a d CC share several common issues such as insulin resistance and low-grade inflammation. In these scenarios, tissue macrophages act as key players, due to their capacity to produce and release inflammatory mediators. One of the main features of MetS is hyperinsuli e ia, hi h is ge e all asso iated ith a atte pt of the β-cell to compensate for diminished insulin sensitivity (insulin resistance). There is growing evidence that hyperinsulinemia per se may contribute to the development of insulin resistance,
through the establishment of low grade inflammation in insulin responsive tissues, especially in the liver (as insulin is secreted by the pancreas into the portal circulation). The hypothesis of the present study was that insulin may itself provoke an inflammatory response culminating in diminished hepatic insulin sensitivity. To address this premise, firstly, human cell line U937 differentiated macrophages were exposed to insulin, LPS and PGE2. In these
cells, insulin significantly augmented the gene expression of the pro-inflammatory mediators IL- β, IL-8, CCL2, Oncostatin M (OSM) and microsomal prostaglandin E2 synthase (mPGES1),
and of the anti-inflammatory mediator IL-10. Moreover, the synergism between insulin and LPS enhanced the induction provoked by LPS in IL- β, IL-8, IL-6, CCL2 and TNF-α ge e. Whe combined with PGE2, insulin enhanced the induction provoked by PGE2 in IL- β, PGE“ a d
COX2, and attenuated the inhibition induced by PGE2 in CCL2 and TNF-α ge e expression
Camargo, RG. Resistência à Insulina na Caquexia Associada ao Câncer e na Síndrome Metabólica: Papel dos Macrófagos ativados pela Insulina e do miRNA-21-5p. [Tese (Doutorado em biologia celular e tecidual)]. São Paulo: Instituto de Ciências Biomédicas, Universidade de São Paulo; 2016. Potsdam: Institüt für Ernährungswissenschaft, Universität Potsdam; 2016.
O teor de gordura cada vez maior na dieta ocidental, combinada com a diminuição dos níveis de atividade física têm marcadamente aumentado à incidência de doenças relacionas ao metabolismo. A caquexia associada ao câncer (CC) e a síndrome metabólica (SM) são síndromes de etiologia complexa e multifatorial, não totalmente compreendida, e com mecanismos subjacentes ao seu desenvolvimento não completamente revelados. No entanto, apesar de serem consideradas "lados opostos", a CC e a MetS apresentam várias características em comum, tais como resistência à insulina e inflamação de baixo grau, com macrófagos teciduais como importantes coadjuvantes, devido à sua capacidade de produzir e liberar mediadores inflamatórios, e microRNAs, descritos como RNAs não-codificantes ligados à regulação da expressão de proteínas e reconhecidos como participantes ativos na geração de várias doenças inflamatórias, tais como o câncer e diabetes tipo II. Uma das principais características da MetS é a hiperinsulinemia, que está geralmente associada com uma tentativa da célula β do pâncreas de compensar a diminuição da sensibilidade à insulina (resistência à insulina). Um número crescente de evidências sugere que a hiperinsulinemia po si só , pode contribuir com o desenvolvimento de resistência à insulina através do estabelecimento de um quadro inflamatório de baixo grau, em tecidos sensíveis a insulina, e em particular no fígado, devido ao fato da insulina ser secretada pelo pâncreas na circulação portal. A hipótese do presente estudo foi que a insulina pode induzir uma resposta inflamatória em macrófagos e culminar em diminuição da sensibilidade hepática à insulina. Para confirmar esta hipótese, primeiramente, macrófagos diferenciados da linhagem de células humanas U937 foram expostos à insulina, LPS e PGE2. Nestas células, a insulina
aumentou significativamente a expressão gênica dos mediadores pró-inflamatórios IL- β, IL -8, CCL2, oncostatina M (OSM) e prostaglandina E2 sintase microssomal (mPGES1), e do mediador anti-inflamatório IL-10. Além disso, o sinergismo entre insulina e LPS aumentou a indução provocada por LPS nos genes da IL- β, IL-8, IL-6, CCL2 e TNF-α. Qua do o i ado com PGE2, a insulina aumentou a indução provocada pela PGE2 nos genes da IL- β, PGE“
e COX2, e restaurou a inibição induzida pela PGE2 no gene CCL2 e TNF-α.
correlaciona-se negativamente com níveis de IL-6 no plasma. Estes resultados indicam que a hiperinsulinemia pode, por si só contribuir para o desenvolvimento da inflamação de baixo grau prevalente em pacientes com excesso de peso e obesos e, assim, promover o desenvolvimento de resistência à insulina especialmente no fígado e o nível reduzido de miRNA-21-5p pode modular a inflamação e expressão de STAT3 em pacientes caquéticos, contribuindo para o desenvolvimento da resistência à insulina.
Camargo, RG. Insulinresistenz in Tumorkachexie und Metabolischem Syndrom: Die Rolle von insulin-aktivierten Makrophagen und miRNA-21-5p. [Thesis (Doctoral degree in Celular and Tissue biology)]. São Paulo: Instituto de Ciências Biomédicas, Universidade de São Paulo; 2016. Potsdam: Institüt für Ernährungswissenschaft, Universität Potsdam; 2016.
Der stetig steigende Fettgehalt in westlicher Ernährung in Kombination mit reduzierter körperlicher Aktivität hat zu einem dramatischen Anstieg der Inzidenz metabolischer Erkrankungen geführt. Tumorkachexie (Cancer cachexia, CC) und Metabolisches Syndrom (MetS) sind sehr komplexe, multifaktorielle metabolische Erkrankungen, deren Ätiologie nicht vollständig verstanden ist. Die molekularen Ursachen, die zu diesen Symptomkomplexen führen, sind noch unzureichend aufgeklärt. Obwohl ihr äußeres Erscheinungsbild stark gegensätzlich ist, haben MetS und CC etliche Gemeinsamkeiten wie zum Beispiel Insulinresistenz und eine chronische unterschwellige Entzündung. Sowohl bei der Entstehung der Insulinresistenz als auch bei der chronischen Entzündung spielen Makrophagen eine Schlüsselrolle, weil sie in der Lage sind pro-inflammatorische Mediatoren zu produzieren und freizusetzen.
Eine der hervorstechendsten Auffälligkeiten des MetS ist die Hyperinsulinämie, die durch den Versuch der β-Zelle, die verminderte Insulinsensitivität (Insulinresistenz) zu kompensieren, zustande kommt. Es gibt zunehmend Hinweise darauf, dass die Hyperinsulinämie selber an der Entzündungsentstehung in Insulin-abhängigen Geweben beteiligt ist und dadurch zur Entwicklung und Verstärkung der Insulinresistenz beitragen kann. Dies trifft besonders auf die Leber zu, weil hier die Insulinspiegel besonders hoch sind, da Insulin vom Pankreas direkt in den Pfortaderkeislauf gelangt. Daher wurde in dieser Arbeit die Hypothese geprüft, ob Insulin selber eine Entzündungsantwort auslösen und dadurch die hepatische Insulinsensitivität senken kann. Zu diesem Zweck wurde die humane Zelllinie U937 durch PMA-Behandlung zu Makrophagen differenziert und diese Makrophagen mit Insulin, LPS und PGE2 inkubiert. In diesen Zellen steigerte Insulin die
Expression der pro-inflammatorischen Mediatoren IL-1β, IL-8, CCL2, Oncostatin M (OSM) signifikant und induzierte die mikrosomale PGE-Synthase 1 (mPGES1) ebenso wie das anti-inflammatorische Cytokin IL-10. Ferner verstärkte Insulin die LPS-abhängige Induktion des IL-1β-, IL-8-, IL-6-, CCL2- und TNFα-Gens. Ebenso verstärkte Insulin die PGE2-abhängige
Induktion von IL-1β, mPGES1 und COX2. Im Gegensatz dazu schwächte es die Hemmende Wirkung von PGE2 auf Expression von TNFα und CCL2 ab und trug so auf beide Weisen zu
einer Verstärkung der Entzündungsantwort bei. Überstände von Insulin-behandelten U937 Makrophagen reduzierten die Insulin-abhängige Induktion der Glukokinase in Hepatocyten um 50%. Die Cytokine, die im Überstand Insulin-behandelter Makrophagen enthalten waren, aktivierten in Hepatocyten ERK1/2, was zu einer inhibitorischen Serin-Phosphorylierung der Insulin Rezeptor Substrats (IRS) führte. Zusätzlich führten die Cytokine zu einer Phosphorylierung und Aktivierung von STAT3 und einer dadurch bedingten Induktion von SOCS3, das seinerseits die Insulinrezeptor-Signalkette unterbrechen kann.
posttranskriptioneller Regulator der STAT3 Expression ist. Die Spiegel der pro-inflammatorischen Mediatoren und der miRNA-21-5p wurden korreliert. In kachektischen Patienten waren die Spiegel der Cytokine IL-6 und IL-8 signifikant höher, die der miRNA-21-5p signifikant niedriger als in nicht-kachektischen Patienten. Die Plasma IL-6-Spiegel korrelierten negativ mit den miRNA21-5p Spiegeln.
Insgesamt zeigen die Ergebnisse, dass eine Hyperinsulinämie selber zu der Entwicklung einer unterschwellingen Entzündung, wie sie in Patienten mit einem MetS vorherrscht, beitragen, und dadurch besonders in der Leber eine Insulinresistenz auslösen oder verstärken kann. Eine verringerte Expression der MicroRNA-21-5p kann in kachektischen Patienten die Entzündungsantwort, im Speziellen die STAT3 Expression, verstärken und dadurch zur Entwicklung einer Insulinresistenz beitragen
Figure 1 - Cancer cachexia and Metabolic Syndrome main diagnosis criteria.. 26
Figure 2 - Molecular mechanisms underlying the setting of inflammation and insulin resistance in CC and MetS in the white adipose tissue……… 30
Figure 3 - Main hepatocyte Insulin and cytokine signaling pathways ………. 33
Figure 4 - Muscle-related molecular mechanisms underlying inflammation and insulin resistance in CC and MetS……….………. 35
Figure 5 - Molecular mechanisms associated with CC and MetS in the Liver… 37 Figure 6 – Insulin-dependent induction of IL- in U9 macrophages………… 59
Figure 7 – Monocyte differentiation test……….. 60
Figure 8 - IL- , IL-8, CCL2, IL-6, TNF- , IL-10, TLR2 and TLR4 gene expression modulation under Insulin, LPS and Insulin + LPS stimulation in U937 cells………. 61
Figure 9 - IL- , CCL , IL-6, mPGES1, COX2 and TNF- gene expression under Insulin, PGE2 and insulin + PGE2 stimulation in U937 cells 63 Figure 10 - Inhibition of insulin-induced Glucokinase induction in hepatocytes by supernatants of insulin-treated U937 macrophages………. 67
Figure 11 - Activation of STAT3 and induction of SOCS3 in hepatocytes by supernatants of insulin-treated U937 macrophages………..……… 68
Figure 12 - Activation of ERK1/2 and inhibitory IRS Ser-phosphorylation in hepatocyte induced by supernatants of insulin-treated U937 macrophage cultures……….. 69
Figure 13 - Activation of AKT in hepatocyte induced by supernatants of insulin-treated U937 macrophage cultures………..……….. 70
Figure 14 - Quality of life assessment………. 72
Figure 15 - Biochemical parameters and the Glasgow Prognostic Score... 73
Figure 16 - Plasma cytokine expression…..………... 74
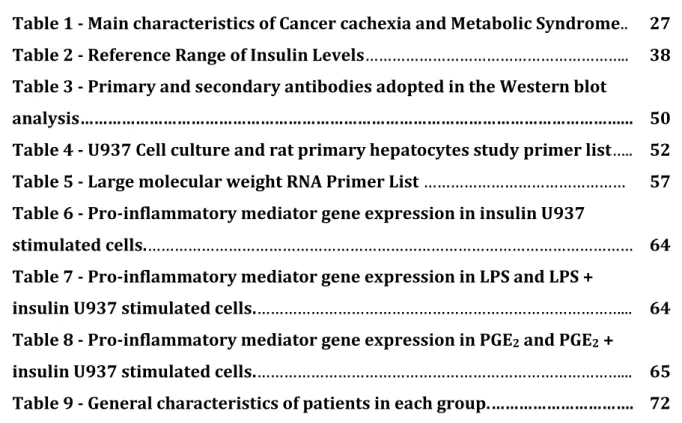
Table 1 - Main characteristics of Cancer cachexia and Metabolic Syndrome.. 27 Table 2 - Reference Range of Insulin Levels……….. 38 Table 3 - Primary and secondary antibodies adopted in the Western blot
analysis………... 50
Table 4 - U937 Cell culture and rat primary hepatocytes study primer list….. 52 Table 5 - Large molecular weight RNA Primer List……… 57 Table 6 - Pro-inflammatory mediator gene expression in insulin U937
stimulated cells.……… 64
Table 7 - Pro-inflammatory mediator gene expression in LPS and LPS +
insulin U937 stimulated cells.………... 64 Table 8 - Pro-inflammatory mediator gene expression in PGE2 and PGE2 +
AA Amino acid;
AIDS Acquired Immune Deficiency Syndrome;
AKT Protein Kinase B;
ALB Albumin;
AMP Adenosine monophosphate;
ANOVA Analysis of variance;
AP1 Activator protein 1;
APS Ammonium Persulfate;
ATGL Adipose Triglyceride Lipase; ATP III Adult Treatment Panel III;
BMI Body mass index;
CC Cancer Cachexia;
CCL2 CC-chemokine ligand 2 (monocyte chemoattractant protein 1);
CD68 Cluster of Differentiation 68;
cDNA Complementary DNA;
CHF Chronic Heart Failure;
COPD Chronic Obstructive Pulmonary Disease;
COX-2 Cyclooxygenase-2;
CRP C-Reactive protein;
Ct Cycle Threshold;
CVD Cardiovascular Disease;
DNA Deoxyribonucleic acid;
ERK1/2 Extracellular signal-regulated kinases 1 and 2;
FCS Fetal Calf serum;
FFA Free-fatty Acid;
FOXO1 Forkhead box protein O1;
FPG Fasting plasma glucose;
GAPDH Glyceraldehyde 3-phosphate dehydrogenase;
GK Glucokinase;
HC Hepatocyte;
HRP Horseradish peroxidase;
HSL Hormone Sensitive Lipase;
IDF International Diabetes federation;
IκB Inhibitor of kappa B;
IKK Inhibitor of kappa B kinase;
IL-6-R Interleukin-6 receptor;
IL Interleukin;
INSR Insulin receptor;
IR Insulin resistance;
IRS Insulin receptor substrate;
JAK Janus kinase;
JNK c-Jun N-terminal kinase;
LPS Lipopolysaccharide;
LDL Low-density lipoprotein;
LDL-R Low-density lipoprotein receptor;
MAP Mitogen Activated Protein;
MetS Metabolic Syndrome;
miRNA MicroRNA;
miRISC MicroRNA-induced silencing complex; mPGES1 Microsomal prostaglandin E2 synthase 1;
mRNA Messenger RNA;
NCS Neonatal Calf serum;
NFκB Nuclear factor kappa B;
nt Nucleotide;
OSM oncostatin M;
PCR Polymerase chain reaction;
PDK Phosphoinositide-dependent kinase;
PGE2 Prostaglandin E2;
PKC Protein Kinase C;
PIP3 Phosphatidylinositol (3,4,5)-trisphosphate;
PLIN Perilipin;
PMA Phorbol-myristate acetate;
pre-miRNA Precursor microRNA; pri-miRNA Primary microRNA;
PTEN Phosphatase and tensin homolog; PTP1B Protein-tyrosine phosphatase 1B; PVDF Polyvinylidene difluoride;
TG Triglyceride;
TNF- Tumor necrosis factor alpha;
TLR Toll-like receptor;
STAT3 Signal transducer and activator of transcription 3; SOCS3 Suppressor of cytokine signaling 3;
RNA Ribonucleic acid;
SDS-PAGE sodium dodecylsulfate polyacrylamid electrophoresis; SREBP Sterol regulatory element-binding protein;
VLDL Very-low-density lipoprotein;
TPCA-1 2-[(Aminocarbonyl)amino]-5-(4-fluorophenyl)-3-thiophenecarboxamide;
TEMED Tetramethylethylenediamine;
1 INTRODUCTION……… 23 1.1 Cancer cachexia and the Metabolic Syndrome……… 23 1.2 Definitions and main symptoms……….... 24
1.2.1 Cachexia………. 24
1.2.2 Metabolic Syndrome………... 25
1.3 Inflammation……….... 27
1.3.1 Inflammation in the adipose tissue………... 28
1.4 Insulin resistance……….. 30
1.4.1 Effects of inflammation and insulin resistance on the Muscle……... 33
1.4.2 Effects of hepatic inflammation and insulin resistance ……… 35
1.4.3 Hyperinsulinemia………... 37
1.5 MicroRNAs in inflammatory states and metabolic conditions……….. 38
1.5.1 MicroRNA-21-5p………... 39
1.6 Integrated metabolism and main hypothesis………. 40 2 AIMS……….. 42
2.1 General……… 42
2.2 Specific……… 42
3 MATERIAL E METHODS………... 43
3.1 Part I – Insulin-induced insulin resistance: Cell culture and rat
primary hepatocyte study……… 43
3.1.1 Materials………... 43
3.1.2 Animals……….. 43
3.1.3 U937 cell culture………. 44
3.1.3.1 U937 cell culture differentiation experiment……… 44
3.1.3.2 U937 macrophages stimulation with Insulin and LPS………... 44
3.1.4 Rat primary hepatocytes culture……… 44
3.1.4.1 Non-recirculating in situ perfusion of rat liver for hepatocyte
isolation………..………. 45
3.1.4.2 Preparation of rat hepatocytes………... 45
3.1.4.3 Rat hepatocytes isolation by density gradient centrifugation……… 46
analysis by Western blot………... 47
3.1.4.6.1 Preparation of cell lysates………... 47
3.1.4.6.2 Protein determination by the Bradford method……….. 47
3.1.4.6.3 Preparation of the samples for the SDS-polyacrylamide gel
electrophoresis (SDS-PAGE)……….... 48
3.1.4.6.4 Protein separation by SDS-PAGE………. 48
3.1.4.6.5 Protein transfer to PVDF membranes………... 48
3.1.4.6.6 Detection of the blotted proteins by Ponceau S staining………... 49
3.1.4.6.7 Immunological detection of proteins by the peroxidase-mediated
chemiluminescent reaction………. 49
3.1.4.7 U937 Macrophage and rat primary hepatocyte gene expression analysis by
Real time PCR……… 50
3.1.4.7.1 Total RNA extraction………... 50
3.1.4.7.2 Complementary DNA synthesis……….. 51
3.1.4.7.3 Real-time PCR amplification……… 51
3.1.4.8 Statistics……….. 52
3.2 Part II – Study with patients………. 53
3.2.1 Patient recruitment……….. 53
3.2.1.1 Ethics Committee approval………... 53
3.2.1.2 Inclusion criteria………... 53
3.2.1.3 Consent term signature obtainment and clinical evaluation……... 53
3.2.2 Clinical and biochemical parameters assessment………... 54
3.2.3 Real time PCR (RT-PCR) analysis……… 54
3.2.3.1 Total RNA extraction……….. 54
3.2.3.2 Complementary DNA synthesis………... 55
3.2.3.3 Primer validation……….. 55
3.2.3.4 Real-time PCR Amplification……….. 56
3.2.4 Plasma pro and anti-inflammatory cytokine and chemokine content
measurement (IL-1 , IL-6, IFN-γ, TNF- , IL-10, IL-8, CCL2)……… 57
3.2.5 Statistics... 57
primary hepatocyte study………...………...
4.1.1 Insulin-dependent induction of IL-1 production in U937
macrophages………. 58
4.1.2 Exclusion of an insulin-dependent induction of U937 monocyte
differentiation into macrophages………..……… 59
4.1.3 Insulin-dependent induction of cytokine production in U937
macrophages and synergism with pro-inflammatory mediators………. 60
4.1.4 Induction of insulin resistance in hepatocytes by supernatants of
insulin-treated U937 macrophages……….. 65
4.2 Part II – Study with Humans………. 71
4.2.1 Clinical findings………... 71
4.2.2 Quality of life assessment……… 71
4.2.3 Biochemical parameters………... 72
4.2.4 Cytokine expression assay………... 73
4.2.5 MicroRNA expression assay……… 74
5 DISCUSSION……….... 76
6 CONCLUSION……….. 82
REFERENCES………. 83
APPENDIX………... 91
A- FREE AND INFORMED CONSENT FORM………... 91
SUPPLEMENTARY MATERIAL………. 93
A - U937 cell culture experiment - buffers and Solutions……… 93 B - Rat primary hepatocytes experiment - buffers and Solutions….. 95 C - U937 macrophages and rat primary hepatocytes protein
1 INTRODUCTION
1.1 Cancer cachexia and the Metabolic Syndrome
Cancer cachexia (CC) and Metabolic Syndrome (MetS) are both recognized as multifactorial conditions with marked impairment of intermediate metabolism. Cachexia was described as a wasting condition two thousand years ago and is frequently reported as a common negative consequence of diseases such as cancer, Chronic Heart Failure (CHF), Chronic Obstructive Pulmonary Disease (COPD), Acquired Immune Deficiency Syndrome (AIDS) and sepsis, among other. MetS is a consequence of excessive calorie intake combined with reduced energy expenditure due to a sedentary life style. It is considered a risk factor for heart disease and other health problems, such as stroke and/or type II diabetes. Both syndromes share several common issues, in spite of a major differences regarding the final outcome: the excessive uptake and storage of energy substrates in MetS leading to overweight or obesity, while in CC extensive catabolism of fat and lean mass is the most prominent feature (1).
Cachexia is present in approximately half of all cancer patients, and in 15% of patients with Chronic Heart Failure (CHF) (2). This scenario rises up to 80% in cancer patients with advanced disease (3). In addition to markedly increasing cancer-associated morbidity, leading to a gradual loss of peripheral organ function (1), cachexia is directly responsible for the death of a large proportion of cancer patients, reaching up to 20% (3). Furthermore, the quality of life of cachectic patients is compromised, implying in reduced effect of cancer treatment (4). In spite of its clinical relevance, to the present date there is no nutritional (5) or pharmacological treatment able to prevent, attenuate or to stop the progression of the syndrome (6), frustrating physicians and patients.
and among its main features, lipid metabolism abnormalities and insulin resistance are the most prominent. This disease is linked to a 2-fold increase in cardio-vascular disease risk and to 1.5-fold augmented mortality, as well as to a 5-fold increase in the risk of developing type II diabetes (11). The global epidemics of obesity and related outcomes, such as type II diabetes and cardiovascular disease have raised the attention addressed to MetS, which has thus become a major focus in clinical research. Dietary modification and lifestyle intervention may prevent the development of MetS (12).
1.2 Definitions and main symptoms
1.2.1 Cachexia
anorexia and metabolic changes may be observed before weight loss; cachexia itself, including weight loss > 5% in the past six months or weight loss between 2% and 5% and BMI < 22 in the past six months or, still the presence of sarcopenia with often reduced food intake and systemic inflammation; and refractory cachexia, in which a low performance score and poor responsiveness to cancer treatment is observed; usually, life expectancy does not exceed three months (14).
1.2.2 Metabolic Syndrome
The definition of MetS has been proposed by the experts of the Adult Treatment Panel III (ATP III, 2001-2005), and, by the International Diabetes Federation (IDF - 2005) (15). The best way to define MetS is still frequently the focus of debate in the literature, and despite the criteria may vary to some degree in all of them; in general, MetS definitions target a population with increased risk for the development of type II diabetes mellitus and increased
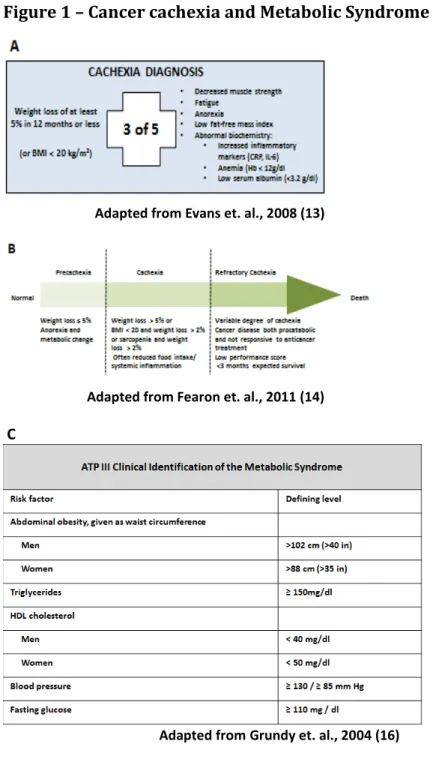
Figure 1 – Cancer cachexia and Metabolic Syndrome main diagnosis criteria
Adapted from Evans et. al., 2008 (13)
Adapted from Fearon et. al., 2011 (14)
C
Adapted from Grundy et. al., 2004 (16)
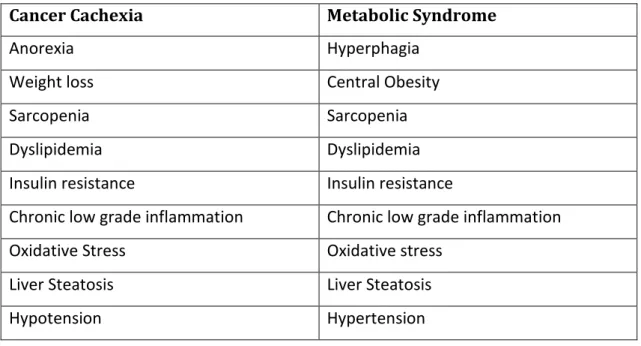
Table 1 – Main characteristics of Cancer cachexia and Metabolic Syndrome
Cancer Cachexia Metabolic Syndrome
Anorexia Hyperphagia
Weight loss Central Obesity
Sarcopenia Sarcopenia
Dyslipidemia Dyslipidemia
Insulin resistance Insulin resistance
Chronic low grade inflammation Chronic low grade inflammation
Oxidative Stress Oxidative stress
Liver Steatosis Liver Steatosis
Hypotension Hypertension
1.3 Inflammation
I the e e t ea s, it has e o e idel a epted that i fla atio is a pi otal pla e underlying the development and progression of chronic diseases, such as cancer, obesity and
type II diabetes, being this, the most relevant feature pointing out to poor clinical and
candidate tissue due to its altered pro-inflammatory secretion and conspicuous mononuclear cell infiltration during cachexia (26). In MetS, the most accepted hypothesis is linked to the broad expansion of the adipose tissue. This would trigger adipocyte apoptosis and culminate in the development of local low-grade inflammation that would later affect other tissues. Despite some evidence supporting this hypothesis, it is believed that both in MetS and CC, an orchestrated response of the organism involving several different organs and tissues is contributing for a sustained inflammatory state (27). The adipose tissue, muscle and liver, in this scenario, are often infiltrated with inflammatory cells, with great capacity to produce and release pro-inflammatory mediators (28).
1.3.1 Inflammation in the adipose tissue
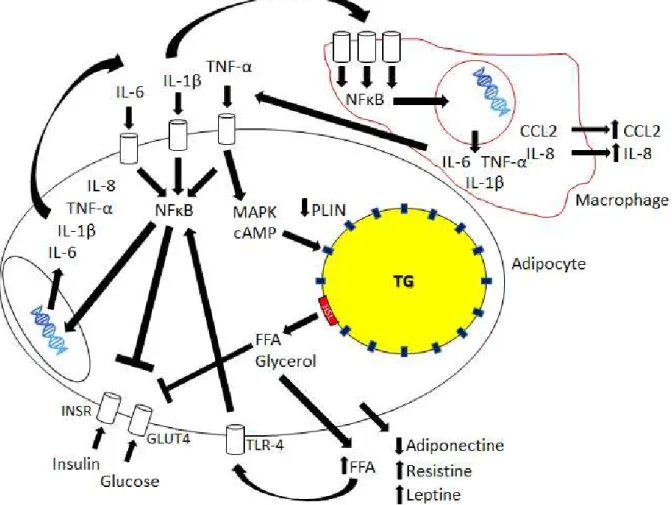
Figure 2 - Molecular mechanisms underlying the setting of inflammation and insulin resistance in CC and MetS in the white adipose tissue
Pro-inflammatory mediators, including IL-6, IL- β a d TNF-α i d to spe ifi e a e e epto s a d t igge
several signaling cascades, such as those of as the NFκB a d MAP ki ases. Pe ilipi s PLIN e p essio is
decreased, elevating the levels of free-fatty acids (FFA) and glycerol. These FFA bind to Toll-like receptor 4
(TLR-4) and maintain the state of local inflammation. Macrophages are part of the process, as cells that are
sensitive to pro-inflammatory mediators, responding with further release of several pro-inflammatory
mediators such as CCL2, adding to the recruitment of monocytes from the bloodstream and maintaining local
inflammation in the adipose tissue. Release of adipokines involved in the regulation of inflammation
amplifies the process.
1.4 Insulin resistance
receptor tyrosine kinases (Figure 3). Upon ligand binding the receptor is auto phosphorylated on tyrosine residues. This results in the recruitment of SH2-domain containing downstream signaling proteins, in particular the insulin receptor substrates (IRS), which in turn also get phosphorylated at tyrosine residues. The trypsin phosphorylated IRS then activates two downstream signal cascades, one of which results in the activation of the protein kinase B (Akt), part of the insulin signaling pathway and the protein responsible for the signal that triggers cell glucose uptake via the stimulation of glucose transporter IV vesicles translocation to the plasma membrane and subsequently glucose transport (42) in skeletal muscle and adipose tissue. Insulin is regarded as the primary anabolic hormone (43). In order to re-synthesize ATP to maintain cell homeostasis, glucose is one of the main substrates, although, if the demand for energy in the cell is low and the availability of glucose is high over an extended period, signals that impair the function of the insulin related cascade may be triggered within the cell or, still by extracellular signals. When insulin signaling pathway is inhibited, binding of insulin to its receptor no longer transduces into downstream signaling and thus the cell is considered to be in a state of insulin resistance (IR). One such state is defined as a significant decrease in insulin sensitivity (30). It occurs when tissues that normally are sensitive to the hormone lose the ability to respond properly to stimulation (32). This will provoke impaired tissue glucose uptake and impaired inhibition of hepatic glucose production (44). IR is considered a metabolic component of cachexia (27, 44), and one of the most prominent features of MetS pathogenesis (18, 45, 46). Interestingly, a similar degree of IR in CC patients and in obese and type II diabetes patients
may be found (44).
The precise mechanisms, as well as the mediators involved in this interaction are not completely unveiled yet (19, 32, 44, 52), although inflammatory cytokines as IL- β o TNFα bind to receptors on insulin target cell membrane and culminate in kinase activation, (e.g. NFκB i hi ito kinase, IKKβ). This protein is also capable of provoking the inhibitory serine phosphorylation of the IRS (53), impairing the insulin signaling chain. Other cytokines as those of the IL-6 cytokines family through canonic signaling chains trigger the synthesis of suppressors of cytokine signaling (SOCS) that act as feed-back inhibitors of their proper signaling chains. However, SOCS can also bind unspecifically to the tyrosine phosphorylated insulin receptor or IRS reduce insulin signaling by uncoupling the tyrosine-phosphorylated insulin receptor from its downstream signaling chain and enhancing the degradation of the IRS (54). Other mediators are also described as capable of impairing insulin signaling, including prostaglandin E2 (55). Its mechanism of action in insulin target-tissues involves the
direct phosphorylation of IRS-inactivating serine kinases such as the Extracellular signal-regulated kinases 1 and 2 (ERK1/2) (56). In addition, PGE2 may also induce cytokine
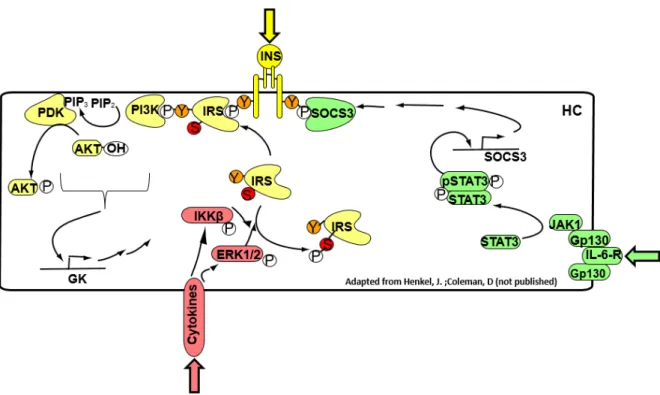
Figure 3 – Main hepatocyte Insulin and cytokine signaling pathways
Insulin binds to its receptor in hepatocytes (HC) inducing recruitment of insulin receptor substrates (IRS), which when phosphorylated in tyrosine residues, will activate protein PI3K and subsequently, the conversion
of PIP2 into PIP3, activating PDK and subsequently, Akt, by phosphorylation. These stimuli culminate in
elevated glucokinase (GK) expression. Cytokines bind to specific membrane receptors and trigger the
phosphorylation of MAP kinases su h as ERK / a d the NFκB inhibitor kinase (IKK). These kinases are
capable of phosphorylating the IRS inhibitory residue, impairing the insulin signaling pathway. Interleukin-6 family cytokines bind to membrane receptors (IL-6-R) and activate the transcription factor STAT3, which induces the suppressor of cytokine signaling (SOCS3). This suppressor binds directly to the insulin receptor, impairing the signaling cascade.
1.4.1 Effects of inflammation and insulin resistance on the Muscle
and degradation (58). The utilization of muscle amino acids as carbon skeletons for gluconeogenesis and as a source of energy (Krebs cycle intermediates) is frequently observed in cachectic patients (59). Argiles (17), pointed out that cytokines per se are capable of modulating muscle catabolism, causing wasting and consequently, weight loss. Tumor-derived factors, such as the proteolysis-inducing factor (PIF) may as well provoke muscle loss (60). Nuclear factor κB (NFκB) and the Mitogen-activated protein kinases (MAPKs) are the main modulators of skeletal muscle metabolism in response to inflammatory stimulus. The chronic activation of these signaling pathways is directly involved in the development and maintenance of wasting conditions such as Cachexia and Diabetes (61). Protein degradation occurs in the skeletal muscle through different mechanisms: a) The lysosomal system, b) The Calcium-activated calpains I and II, and c) The ubiquitin–proteasome pathway and the augmented expression of the ubiquitin–proteasome pathway proteins (60). Insulin resistance contributes to sarcopenia because insulin increases amino acid uptake into skeletal muscle cells, increases translation of mRNA by activating eukaryotic translation initiation factors, among others and inhibits both autophagy and proteasomal protein degradation (62, 63).
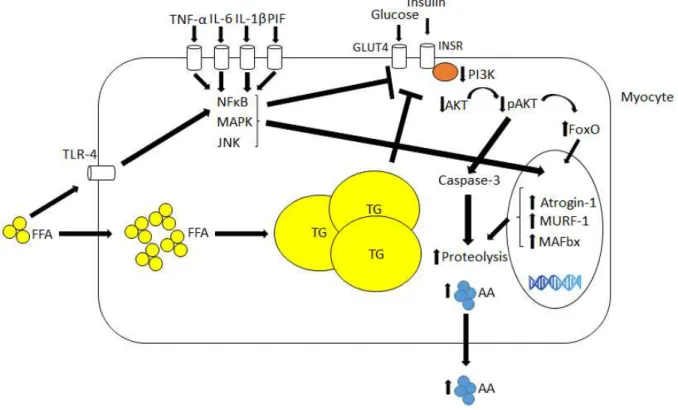
Figure 4 - Muscle-related molecular mechanisms underlying inflammation and insulin resistance in CC and MetS
Pro-inflammatory mediators as TNF-α, IL-6, IL- β a d p oteol sis i du i g fa to PIF i d to e a e
receptors in myocytes a d a ti ate se e al sig ali g path a s as those of MAP ki ases, JNK a d NFκB, hi h
are capable of impairing insulin signaling cascade and inducing the expression of several proteins involved in proteolysis such as Atrogin-1, MURF-1 and FoxO. Diminished insulin signaling enhances proteolysis, while augmented influx of FFA and its binding to receptors such as TLR-4 contributes to insulin signaling impairment.
1.4.2 Effects of hepatic inflammation and insulin resistance
suppressor of cytokine signaling (SOCS) and also of different kinases as JNK, IKK-β and of PKC, as of protein tyrosine phosphatases such as the protein-tyrosine phosphatase 1B (PTP1B) and the phosphatase and tensin homolog (PTEN), which in turn, may impair insulin signaling directly at the receptor or receptor substrate (IRS) level (18).
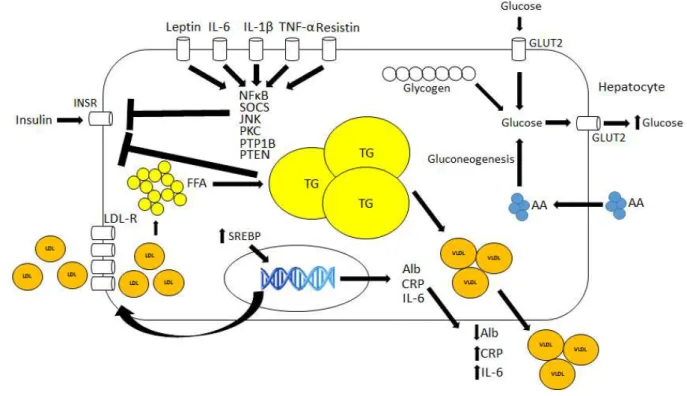
Figure 5 - Molecular mechanisms associated with CC and MetS in the Liver
Interleukin-6, TNF-α, IL- β, Resisti a d lepti i du e se e al p o-inflammatory signaling pathways that impair insulin signaling. Free-fatty acid enhanced uptake similarly induces insulin impairment and augmented acute-phase protein synthesis. Gluconeogenesis is also induced due to insulin signaling impairment.
1.4.3 Hyperinsulinemia
some processes downstream of the insulin receptor, despite the impaired insulin-dependent stimulation of glucose disposal. Among others, these include tumor promoting and antiapoptotic signals (78), as well as cell differentiation leading to inflammation (79).
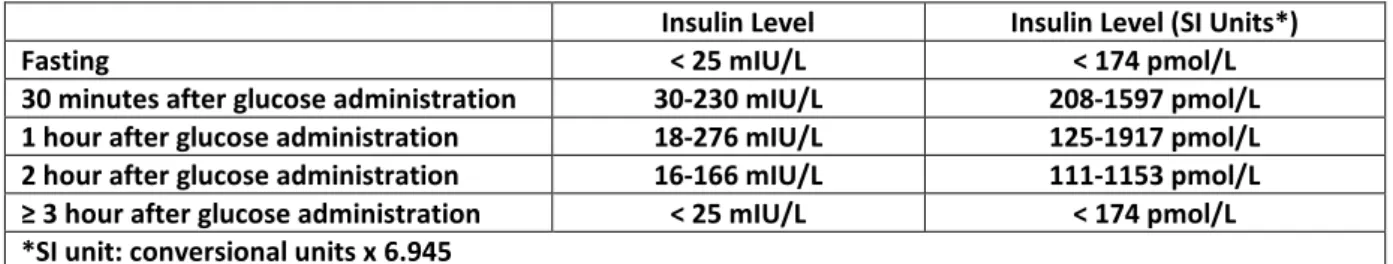
Table 2 – Reference Range of Insulin Levels
Insulin Level Insulin Level (SI Units*)
Fasting < 25 mIU/L < 174 pmol/L
30 minutes after glucose administration 30-230 mIU/L 208-1597 pmol/L
1 hour after glucose administration 18-276 mIU/L 125-1917 pmol/L
2 hour after glucose administration 16-166 mIU/L 111-1153 pmol/L
≥ hou afte glu ose ad i ist atio < 25 mIU/L < 174 pmol/L *SI unit: conversional units x 6.945
Adapted from Melmed, 2011 (80)
1.5 MicroRNAs in inflammatory states and metabolic conditions
effect and regulate protein expression, the complex miRISC binds directly to the mRNA as to repress the translation of target genes by cleavage (perfect or near-perfect binding) or by fo i g a hai pi i the UT‘, through imperfect base pairing (90). Base-pairing of approximately 7 nucleotides must be complementary to provoke effects in the target mRNA (91). These base-pairing complementary nucleotides sequences are known as the seed egio and consist on the most important pre requisite to the miRISC action. The binding site of the miRISC may also not correspond to the UT‘, ut the O‘F o UT‘ egio of the target, ausi g ta get ge e ep essio o he i di g to the UT‘, even stimulating the translation of target genes (92).
More than half of all described human genes are susceptible to modulation by miRNAs (93). MicroRNAs expression depends on to the local of synthesis, metabolic status and presence of disrupt states as diseases (94). Several studies point out a role for miRNAs as important regulators of diverse biological processes as cellular differentiation, proliferation, tissue development and cell-type specific function and homeostasis. Moreover, several inflammatory conditions have been linked in the past years to altered miRNAs expression (95, 96). MicroRNAs apparently modulate the magnitude of inflammatory responses (97) and act as pivotal players in the maintenance of inflammatory conditions such as cachexia and MetS.
1.5.1 MicroRNA-21-5p
cancer (100-102) and obesity (103, 104). Specifically in regard to cachexia, one study showed that dysregulated miRNA-21-5p expression was linked to the wasting condition prevalent in patients and rodents (105). Among the specific types of cancer, including colorectal cancer, up-regulation of microRNA-21-5p is the most frequent observation, despite some of the studies not identifying differences in the expression in cancer patients, compared to non-cancer patients (11). In obesity, the opposite is observed, diminished microRNA-21-5p expression is linked to inflammation and obesity (103, 104). According to
mirbase, microRNA-21-5p targets several essential proteins in the development of
inflammation, such as PTEN and STAT3. A link between STAT3 activation and microRNA-21-5p is described (101, 102), as well as a negative correlation between miRNA-21-microRNA-21-5p and pro-inflammatory mediators (102). Due to a high relevance in pro-inflammatory processes, immune system cells were also focus of various studies in which the modulation by miRNA-21-5p was evaluated. Curiously, miRNA-21-5p is induced by STAT3 activation (106), but inhibits STAT3 th ough t o sites of i te a tio i the UT‘ egio of “TAT mRNA (101). Whether this represents a feedback mechanism is not fully clear. Since MetS and CC are inflammatory conditions, miRNA-21-5p appears as good candidate for the modulation of imbalanced inflammatory response.
1.6 Integrated metabolism and main hypothesis
prolonged hyperinsulinaemic, euglycaemic clamp (111). This suggests that hyperinsulinemia itself might trigger local inflammation and subsequently, provoke insulin resistance. Once immune system cells are known to be active players in tissue local inflammation due to their capacity of secreting pro-inflammatory mediators, the main hypothesis of this study was to answer the question: Does hyperinsulinemia per se in some way contribute to the development or progression of insulin resistance, through the induction of inflammation?
2 AIMS
2.1 General
To test the hypothesis whether insulin might elicit an inflammatory response in macrophages that could in turn contribute to the development of hepatic insulin resistance.
To verify whether cachectic patients present difference in circulating microRNA expression, as compared to non-cachectic and control patients.
2.2 Specific
To assess specific gene and protein expression of pro-inflammatory mediators and insulin signaling pathway proteins in cultured differentiated macrophages and primary rat hepatocytes;
3 MATERIAL E METHODS
3.1 Part I – Insulin-induced insulin resistance: Cell culture and rat primary hepatocyte study
3.1.1 Materials
The antibiotics, fetal calf serum (FCS), calf serum and M199 culture medium were obtained from Biochrom AG (Berlin, Germany). The RPMI1640 medium was purchased from Gibco (Eggenstein, Germany). Dexamethasone, phorbol 12-myristate 13-acetate (PMA), Insulin and lipopolysaccharide (LPS) were obtained from Sigma-Aldrich (Deisenhofen, Germany). Oligo(89)12-18 and acetone were obtained from Roth (Karlsruhe, Germany). The Ma i a™
SYBR Green qPCR Master Mix and the ‘e e tAid™ M-MuLV reverse transcriptase were obtained from ThermoFisher Scientific (Darmstadt, Germany). The antibodies against phospho-Ser306-IRS1, phospho-Ser636/639-IRS1, IRS1, p44/42 MAPK, phospho-p44/42 MAPK (Thr202/Tyr204), STAT3, phospho-STAT3 (Tyr705), phosphor-Akt (Ser473), Akt and
IL-β e e pu hased f o Cell “ig ali g Technology (Frankfurt, Germany). The antibody against GAPDH was purchased from Santa Cruz Biotechnology (Heidelberg, Germany). All oligonucleotides were customized by Biolegio (Nijmegen, The Netherlands) or Eurofins Genomics (Ebersberg, Germany).
3.1.2 Animals
3.1.3 U937 cell culture
The buffers and solutions detailed preparation protocols are described in the supplementary material.
3.1.3.1 U937 cell culture differentiation experiment
The human monocytic cell line U937 was cultivated in medium RPMI1640 with 10% heat-inactivated FCS and 1% antibiotics (cell culture medium I). Cells were seeded in 35-mm diameter culture plates (1 x 10⁶ cells per plate). Monocytes were tested for differentiation capacity into macrophages by the addition of 100 ng/ml Phorbol-myristate acetate (PMA) or 100 nM insulin for 24 h. The control cells were cultivated in cell culture medium I under no stimulation. After removal of the medium, macrophages were washed with RPMI1640, at room temperature and the number of differentiated cells estimated by counting under a microscope at 10 times magnification.
3.1.3.2 U937 macrophages stimulation with Insulin and LPS
The human monocytic cell line U937 was cultivated as described previously (3.1.3.1). Monocytes were differentiated into macrophages by addition of 100 ng/ml PMA for 24 h. After removal of the medium, macrophages were washed with RPMI1640 medium at room temperature and incubated in RPMI1640 medium with 0.5% heat-inactivated FCS and 1% antibiotics (cell culture medium II), in the absence of PMA for 24 h. Macrophages were then stimulated for another 24 h, with 100 nM insulin and/or 100 ng/ml LPS from Escherichia coli
Serotype 0127:B8 to evaluate the effect of insulin, LPS and the possible synergism. Cells were shock-frozen in liquid nitrogen and stored at -70 °C for further analysis and the supernatant collected and centrifuged (10,000 x g, 15 min, and 4 °C).
3.1.4 Rat primary hepatocytes culture
purification and culture. The hepatocytes isolation and purification was performed following the protocol of Meredith, 1988 (112). Hepatocytes were released from the cell structure of the liver by perfusion with an EDTA-containing buffer without calcium. This leads to cell separation once calcium is needed for cell-cell contacts. After perfusion, cells were purified by centrifugation, separated from non-parenchymal cells and debris with continuous Percoll density gradient and cultured in the appropriate culture medium.
3.1.4.1 Non-recirculating in situ perfusion of rat liver for hepatocyte isolation
One male Wistar rat (200-350 g body weight) was anesthetized by intraperitoneal injection of 100 µl Narcoren/100 g body weight. After removing the skin of the abdomen, a longitudinal incision along the linea alba to the processus xyphoideus was made. The hepatic
portal vein was exposed by shifting the intestinal miscellany. The portal vein was then cannulated and the liver was perfused with Perfusion buffer (140 mM NaCl, 5 mM KCl, 0.8 mM MgCl2 x 6 H2O, 1.6 mM Na2HPO4 x 2 H2O, 0.4 mM KH2PO4, 25 mM NaHCO3, 2 mM EDTA,
1.5 mM Glucose, 0.2 mM Lactate, 0.02 mM Pyruvate – pH 7.4) at a flow rate of 40 ml / min at 37 °C (2l per 45 - 60 min). After opening the inferior vena cava, the cannula in the portal
vein was attached at the desired position, while the liver was flushed bloodless and the thorax was opened by extending the clavicle paramedian through a longitudinal incision (112).
3.1.4.2 Preparation of rat hepatocytes
After perfusion, the liver was dissected from the abdomen and placed on a glass plate filled with wash buffer (140 mM NaCl, 5 mM KCl, 0.8 mM MgCl2 x 6 H20, 1.6 mM Na2HPO4 x 2 H2O,
0.4 mM KH2PO4, 0.1 mM CaCl2 x H20). The liver was torn and completely separated from the
3.1.4.3 Rat hepatocytes isolation by density gradient centrifugation
After the third centrifugation, the cell sediment was resuspended in wash buffer to a volume of 16ml and mixed with 32ml of Percoll gradient medium (27.8 ml Percoll and 4.2 ml Perfusion solution 10 X (1400 mM NaCl, 50 mM KCl, 8 mM MgCl2 x 6 H20, 16 mM Na2HPO4 x
2 H2O, 4 mM KH2PO4). Percoll final concentration was 58% (v/v). The suspension was
centrifuged for 5 min at 800 x g (2100 rpm, Hettich centrifuge Rotina 35), at room temperature. Non-parenchymal cells, dead hepatocytes and cell debris were aspirated, along with the excess of buffer.
3.1.4.4 Cell counting
The counting of hepatocytes was performed in a Neubauer chamber (0.0025 mm2 / 0.1 mm) by pipetting 96 µl of M199 cell culture medium mixed with 4 µl of Hepatocyte suspension (1:25 dilution), under a microscope at 10 times magnification.
3.1.4.5 Rat hepatocyte culture
Hepatocytes were plated and immediately treated with M199 cell culture medium with 4% (v/v) neonatal calf serum for optimal attachment to the bottom of the polystyrene trays, with 1% (v/v) penicillin/streptomycin, 0.1 mM Dexamethasone and 0.5 nM insulin (= M199 cell culture medium I). The hepatocytes were cultured in 35 mm cell culture plates at a density of 1.0 x 10⁶ cells (1.5 ml). After an initial period of 4 hours, the medium was changed to 1.5 ml M199 culture medium II, in the absence of neonatal calf serum (NCS). Another Medium change with M199 culture medium II was carried out after 24 h. The cell culture experiments occurred after a period of 40 hours from seeding. The incubation of hepatocytes was performed in a steam saturated atmosphere with 5% (v/v) CO2, at 37 °C.
3.1.4.6 U937 macrophages and rat primary hepatocytes protein expression analysis by Western blotting
The Western Blot experiment was performed following in three steps: protein separation by molecular size, protein transfer from a gel to the membrane, and target protein labeling, with a proper primary and secondary antibodies as to allow detection (113).
3.1.4.6.1 Preparation of cell lysates
Rat primary hepatocytes and U937 macrophages were ruptured in 100ul of lysis buffer with protease inhibitors and Sodium orthovanadate [20 mM Tris / HCl (pH 7.5), 150 mM NaCl, 1 mM EDTA, 1 mM EGTA, 1% Triton X-100 (v/v), 2.5 mM Sodium pyrophosphate, 1 mM β -Glycerol phosphate, 50 mM NaF, 200 µM Pefablock, 10 µg/ml Leupeptin, 10 µg/ml Trypsin inhibitor, 1 mM Na3VO4] to each cell culture plate. Subsequently, the cells were scraped off
and transferred to the lysates in 1.5 ml reaction tubes. For optimal cell disruption, the cell suspension was homogenized for 10 seconds under ultrasound (Ultrasound Wand Bandelin UW 2070 Power 55%, Cycle 5). Then, cell homogenates were centrifuged for 15 min at 10,000 x g (Sigma 3K30 centrifuge rotor 1215/4-H), and the supernatant transferred to 1.5 ml reaction tubes. The cell lysates were stored at -20 °C. Determination of the protein content was performed by the method described by Bradford (114).
3.1.4.6.2 Measurement of sample protein content
The samples were diluted 1:100 by adding into 3 µl of the lysate, 27 µl H2O, and then 10 µl of
the prediluted lysate to 90 µl H2O (duplicates). The Standard series consisted of decreasing
3.1.4.6.3 Preparation of the samples for SDS-polyacrylamide gel electrophoresis (SDS-PAGE)
The protein content of cell lysates was determined as described in item 3.1.4.10.4 and all the samples were diluted with lysis buffer to 40 µg of protein, in a maximum volume of 45 µl. The samples were then mixed with 1/3 volume of sample buffer [80 mM Tris / HCl (pH 7.5), 2% SDS (w/v), 5% Glycerol (w/v), 0.0025% Bromophenol blue (w/v), 20% β -mercaptoethanol], briefly centrifuged (spin) and then denaturated on heating block for 5 min at 95 °C, followed by another centrifugation for 5 min at 13,000 rpm (16,050 x g, Biofuge Pico). For the detection of IL- β i the supe ata ts of the U9 a ophage culture, the medium was mixed with 1:5 acetone, stored over night at -20 °C, and centrifuged (4696 x g, 5 min, 4 °C). The pellet was resuspended in 55 µl of the sample buffer.
3.1.4.6.4 Protein separation by SDS-PAGE
For the analytical separation of proteins by molecular weight, discontinuous polyacrylamide gels were used according to Laemmli (115). Gels were set and run in the electrophoresis system Mini Protean II (BIO-RAD). The resolving gels were cast with 10% polyacrylamide [30% Acrylamide (30% w/v), 22.5% Resolving gel buffer (1.5 M TRIS, 0.4% SDS (w/v), pH 8.8), 0.15% TEMED and 0.75% APS (10% w/v)] for the detection ERK 1/2, STAT3 and 6% acrylamide [18% Acrylamide (30% w/v), 22.5% Resolving gel buffer (1.5 M TRIS, 0.4% SDS (w/v), pH 8.8), 0.15% TEMED and 0.75% APS 10% (w/v)]for IRS1. The stacking gel was cast with 4.45% polyacrylamide [25% Acrylamide (30% w/v), 30% Stacking gel buffer (0.5 M TRIS, 0.4% SDS (w/v), pH 6.8), 2% TEMED and 10% Ammonium persulfate (APS, 10% w/v)]. Samples (45 µl) and the protein standard were pipetted to the gels. Electrophoresis was set at 15 mA / gel for the stacking gel and 20 mA / gel for the resolving gel.
3.1.4.6.5 Protein transfer to PVDF membranes
0.1% SDS (w/v), 20% Methanol (v/v), pH 10.5] for about 15 minutes. The transfer took place at a constant current of 1.2 mA / cm2 gel area (= 56 mA / gel), over a period of 45 minutes (Akt, ERK 1/2, STAT3, IL- β) or 120 minutes (IRS1, IRS2).
3.1.4.6.6 Detection of transferred proteins by Ponceau S staining
The PVDF membrane rested briefly in a bowl with Ponceau S staining solution [0.25% Ponceau S, 40% Methanol (v/v), 15% Acetic acid (v/v)] and the protein bands were reversibly stained. The membrane was then washed with TBS / Tween buffer [TRIS 0.02 M, NaCl 0.136 M, 20% TWEEN (0.1% v/v)], three times for 5 minutes.
3.1.4.6.7 Immunological detection of proteins by the peroxidase-mediated chemiluminescent reaction
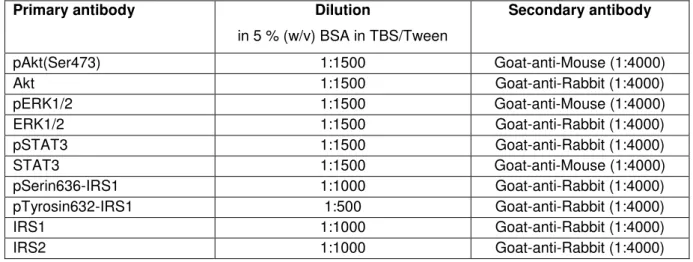
Table 3 - Primary and secondary antibodies adopted in the Western blot analysis
Primary antibody Dilution
in 5 % (w/v) BSA in TBS/Tween
Secondary antibody
pAkt(Ser473) 1:1500 Goat-anti-Mouse (1:4000)
Akt 1:1500 Goat-anti-Rabbit (1:4000)
pERK1/2 1:1500 Goat-anti-Mouse (1:4000)
ERK1/2 1:1500 Goat-anti-Rabbit (1:4000)
pSTAT3 1:1500 Goat-anti-Rabbit (1:4000)
STAT3 1:1500 Goat-anti-Mouse (1:4000)
pSerin636-IRS1 1:1000 Goat-anti-Rabbit (1:4000)
pTyrosin632-IRS1 1:500 Goat-anti-Rabbit (1:4000)
IRS1 1:1000 Goat-anti-Rabbit (1:4000)
IRS2 1:1000 Goat-anti-Rabbit (1:4000)
3.1.4.7 U937 Macrophage and rat primary hepatocyte gene expression analysis by Real time PCR
The PCR experiments were preceded by the synthesis of complementary DNA through reverse transcription reaction from isolated RNA, followed by polymerase chain reaction. This technic has been proven to be an adequate and powerful method to quantify gene expression (36).
3.1.4.7.1 Total RNA extraction
RNA concentration (μg/ml) = Absorption 260 × 40 × Dilution Factor. The samples were stored at -70 oC.
3.1.4.7.2 Complementary DNA synthesis
Complementary DNA was synthesized from 600 – 1500 ng purified RNA and 500 ng Oligo(89)12-18 in DEPC treated water (13.0 µl), 5X reaction buffer (250 mM Tris-HCl pH 8.3,
250 mM KCl, 20 mM MgCl2, 50 mM DTT) (4 µl), 200 U of ‘e e tAid™ M-MuLV reverse
transcriptase (1 µl) and 10 mM dNTP Mix (2 µl), in a total volume of 20 µl. The reaction was incubated for 60 min at 42 oC in a T3000 Thermocycler (Biometra GmbH, Göttingen, Germany).
3.1.4.7.3 Real-time PCR amplification
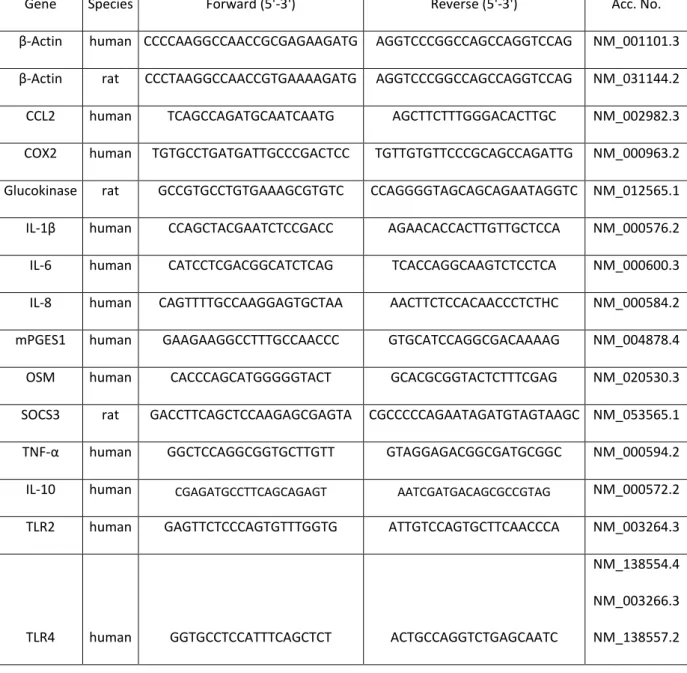
Table 4 - U937 Cell culture and rat primary hepatocytes study primer list
Gene Species Forward (5'-3') Reverse (5'-3') Acc. No.
β-Actin human CCCCAAGGCCAACCGCGAGAAGATG AGGTCCCGGCCAGCCAGGTCCAG NM_001101.3
β-Actin rat CCCTAAGGCCAACCGTGAAAAGATG AGGTCCCGGCCAGCCAGGTCCAG NM_031144.2
CCL2 human TCAGCCAGATGCAATCAATG AGCTTCTTTGGGACACTTGC NM_002982.3
COX2 human TGTGCCTGATGATTGCCCGACTCC TGTTGTGTTCCCGCAGCCAGATTG NM_000963.2
Glucokinase rat GCCGTGCCTGTGAAAGCGTGTC CCAGGGGTAGCAGCAGAATAGGTC NM_012565.1
IL- β human CCAGCTACGAATCTCCGACC AGAACACCACTTGTTGCTCCA NM_000576.2
IL-6 human CATCCTCGACGGCATCTCAG TCACCAGGCAAGTCTCCTCA NM_000600.3
IL-8 human CAGTTTTGCCAAGGAGTGCTAA AACTTCTCCACAACCCTCTHC NM_000584.2
mPGES1 human GAAGAAGGCCTTTGCCAACCC GTGCATCCAGGCGACAAAAG NM_004878.4
OSM human CACCCAGCATGGGGGTACT GCACGCGGTACTCTTTCGAG NM_020530.3
SOCS3 rat GACCTTCAGCTCCAAGAGCGAGTA CGCCCCCAGAATAGATGTAGTAAGC NM_053565.1
TNF-α human GGCTCCAGGCGGTGCTTGTT GTAGGAGACGGCGATGCGGC NM_000594.2
IL-10 human CGAGATGCCTTCAGCAGAGT AATCGATGACAGCGCCGTAG NM_000572.2
TLR2 human GAGTTCTCCCAGTGTTTGGTG ATTGTCCAGTGCTTCAACCCA NM_003264.3
TLR4 human GGTGCCTCCATTTCAGCTCT ACTGCCAGGTCTGAGCAATC
NM_138554.4
NM_003266.3
NM_138557.2
3.1.4.8 Statistics
3.2 Part II – Study with cachectic cancer patients
3.2.1 Patient recruitment
3.2.1.1 Ethics Committee Approval
The Project was approved by the University of São Paulo Biomedical Sciences Institute Ethics Committee (1109/CEP) and the University Hospital Ethics Committee (HU/USP: 1387/14) and registered on the Brazilian Platform for Human Studies (CAAE:13803213.0.0000.5467).
3.2.1.2 Inclusion criteria
Patients (n = 48) were recruited between August 2014 and July 2015 at the University Hospital of the University of Sao Paulo. The recruitment was carried out by the Hospital physicians and consisted in selecting patients engaged in the treatment of hernia (Control group, n = 16) and cancer (weight stable group, n = 16; cachectic group, n = 16). The inclusion criteria were not having received prior anticancer or anti-inflammatory treatment (the hospital operates only with patients who will undergo surgery, but no adjuvant treatment, as determined by the in-charge physicians, according to individual clinical recommendations); and willingness to participate. The criterion for the diagnosis of gastric cancer was the based on the TNM Classification of Malignant Tumors (116) (Esophagus, Stomach, Small intestine, Colon and rectum, Anal canal, Liver, Gallbladder, Extra bile liver pathways, Vater Ampoule and Pancreas). The exclusion criteria were liver failure, renal failure, AIDS, inflammatory diseases of the bowel; autoimmune disorders and continuous anti-inflammatory medication.
3.2.1.3 Consent term signature obtainment and clinical evaluation
high score for Global Health Status and Functional Scales means better quality of life; a high score for Symptoms scale means worsened quality of life. The patients under cancer treatment were then divided into two groups, based on the answers and on the anthropometric measurements. The cachectic group (TC) consisted of patients with a self-declared weight loss > 5% in the past six months on weight loss between 2% and 5% in the past six months, with concomitant presence of sarcopenia; reduced food intake and/or systemic inflammation (14). The cancer weight stable group (WSC) consisted of patients in treatment for cancer without declared weight loss > 5% in the past 12 months. Full written consent form was obtained from each patient (Supplementary material). All procedures were carried out in the hospital premises.
3.2.2 Assessment of Clinical and biochemical parameters
Height and weight were assessed and, approximately 20 mL of blood, collected prior to the surgical procedure (by a certificated trained health professional). Blood was placed in tubes with or without anticoagulant (EDTA) and then, centrifuged at 3000 rpm for 15 minutes, at 4°C to obtain plasma and serum, respectively. Then, plasma and serum were transferred to plastic microtubes and stored at -80 °C for analysis. Serum concentration of hemoglobin was determined by the University Hospital, while C-reactive protein and albumin were measured with commercial kits (PCR Plus Ultra Turbiquest ref 335 – Labtest dignostica SA, Lagoa Santa, MG, Brazil; range 0.5 – 10 mg/L) and Albumin - Diagnostic Labtest ref 19 - Labtest dignostica SA, Lagoa Santa, MG, Brazil; range 0-6.0 g/dL), according to the manufacturers p oto ols.
3.2.3 Real time PCR analysis
3.2.3.1 Total RNA extraction
Total ‘NA as isolated f o patie ts plas a employing the mirVa a™ i‘NA Isolatio Kit
which removed most of the other cellular components, leaving a semi-pure RNA sample. This RNA was further purified over a glass-fiber filter to yield total RNA and 5 µl of total extracted RNA was aliquot for further cDNA synthesis.
3.2.3.2 Complementary DNA synthesis
Complementary DNA (cDNA) was synthesized from 5 µl purified RNA with the TaqMan® MicroRNA Reverse Transcription Kit (Thermofisher Scientific Inc., Waltham, MA, USA). Specific cDNA was synthesized for the miRNA-21-5p and RNU6B by adding to the cDNA Mastermix the miRNA-21-5p (Thermofisher Scientific Inc., Waltham, MA, USA, CAT# 4427975) or RNU6B specific primers (Thermofisher Scientific Inc., Waltham, MA, USA, CAT# 4427795). The reaction was setup in a mixture of 0.15 µl of 100nM dNTPs (with dTTP), 1 µl MultiScribeTM Reverse transcriptase (50 U/µl), 1.50 µl 10X Reverse Transcription Buffer, 0.19 µl RNase Inhibitor (20 U/µl), 4.16 µl Nuclease-free Water in a volume of 7 µl. Then, 3 µl of 5X RT specific primers and 5 µl of miRNA sample were added to the mixture, in a total of 15 µl reaction volume. The reaction was performed in the 96 well VERITI termocycler (Thermofisher Scientific Inc., Waltham, MA, USA), at the following parameters: Step I, 30 minutes at 16 oC; step II, 30 minutes at 42 oC; step III, 5 minutes at 85 oC. Complementary DNA synthesis for large molecular weight RNAs was carried out using the high capacity cDNA reverse transcription kit (Thermofisher Scientific Inc., Waltham, MA, USA), which consisted of an assay mix containing 5 μl purified RNA, 2 μL 10× RT Buffer, 0.8 μL 25× dNTP mix (100 mM), 2 μL 10× Random primers, 1 μL MultiScri e™ ‘e e se T a s iptase a d 9.2 μL of nuclease-free water in a final volume of 20 μL. The thermal cycler conditions were: 25 °C for 10 min, then 37 °C for 120 min followed by 85 °C for 5 min.
3.2.3.3 Primer validation
The choice of the endogenous control for the quantification of miRNA-21-5p was based on a microRNA array (Human miRNome miScript® miRNA PCR Array, Qiagen, Valencia, CA, USA),
However, when tested in each sample, RNU6B amplification presented cycle threshold (Ct) for the vast majority of samples was over the value of 35 Cts. This way, large molecular weights RNAs were also tested as endogenous controls to avoid possible misleading results. Primers for 18S, HPRT and RPL-27 were tested in one pool per group of human plasma samples (supplementary figure S2). The primer for 18S displayed good linearity (r2 = 0.999) and was shown to be the least prone to variation. Then, gene expression results for miRNA-21-5p were calculated with RNU6B or 18S as reference genes, and the results correlated by the “pea a s test = 0.5835; p = 0.0028), confirming a positive correlation, and validating the results for both primers. The primer for 18S was chosen as reference gene, as it was the most stable in samples.
3.2.3.4 Real-time PCR Amplification
Realtime PCR for the quantification of each miRNA-21-5p and RNU6B transcripts was performed in samples duplicates by mixing 1.00 µl of TaqMan® Small RNA Assay (20✕), 1.33 µl of the specific synthesized cDNA for miRNA-21-5p or RNU6B, 10 µl of TaqMan® Universal PCR Master Mix II (2✕), no UNG and 7.67 µl of nuclease-free water, in a total volume of 20 µl. The reaction was performed with an initial enzyme activation step at 95 °C for 10 min, followed by 40 cycles of denaturation at 95 °C for 15 seconds, annealing and extension at 60 °C for 60 seconds, with a subsequent melt curve analysis in the Quantstudio K™ The al Cycler (Thermofisher Scientific Inc., Waltham, MA, USA). Real-time PCR for the quantification of each of the large molecular weight RNAs 18S, RPL-27 and HPRT transcripts was carried out in duplicates in a reaction mixture of 2x SybrGreen® qPCR Master Mix, 400 nM forward and reverse oligonucleotides (table 5), and 4.2 µl cDNA in a total volume of 10 µl qPCR was performed with an initial enzyme activation step at 95°C for 10 min, followed by 40 cycles of denaturation at 95 °C for 20 sec, annealing at 60 °C for 30 sec and extension at 72 °C for 20 sec with a subsequent melt curve analysis in a Quantstudio K™ The al C le (Thermofisher Scientific Inc., Waltham, MA, USA). The expression level was calculated as the n-fold induction of the gene of interest in treated versus control cells with 18S as reference gene. The calculation is based on the differences in the threshold cycles between control (c) and treated (treat) groups according to the formula: fold induction = 2 (c-treated)interest / 2
(c-treated)reference
Table 5 – Large molecular weight RNA Primer List
Gene Species Forward (5'-3') Reverse (5'-3') Acc. No.
18S Human CCTGCGGCTTAATTTGACTC ATGCCAGAGTCTCGTTCGTT NR_003286.2
RPL-27 Human CCGAAATGGGCAAGTTCAT CCATCATCAATGTTCTTCACGA NM_000988.3
HPRT Human TGGCGTCGTGATTAGTGATG CTTGAGCACACAGAGGGCTA NM_000194.2
3.2.4 Measurement of plasma cytokine and chemokine content (IL-1 , IL-6, IFN-γ, TNF- , IL-10, IL-8, CCL2)
The protein measurement protocol consisted of incubating the samples (50 µl) with a mixture of MagPlex® beads coated with different antibodies for 2 hours, followed by the detection of target antigens bound to the microspheres with a mixture of biotinylated capture antibody incubated for 1 hour; then followed by incubation with phycoerithrin labeled streptavidin for 30 minutes. The identification of microspheres was performed with the Luminex instrument MAGPIX (Thermofisher Scientific Inc., Waltham, MA, USA). After reading, the value for each cytokine was analyzed with the Analyst 5.1 software, and expressed as pg/ml.
3.2.5 Statistics