www.nat-hazards-earth-syst-sci.net/12/699/2012/ doi:10.5194/nhess-12-699-2012
© Author(s) 2012. CC Attribution 3.0 License.
and Earth
System Sciences
Sensitivity of fire weather index to different reanalysis products in
the Iberian Peninsula
J. Bedia1, S. Herrera2, J. M. Guti´errez1, G. Zavala3, I. R. Urbieta3, and J. M. Moreno3 1Instituto de F´ısica de Cantabria (IFCA-CSIC) – Universidad de Cantabria, 39005 Santander, Spain
2Predictia Intelligent Data Solutions S.L. CDTUC Fase A, Planta 2–203. Avda. los Castros s/n 39005 Santander, Spain 3Dpto. Ciencias Ambientales, Universidad de Castilla La Mancha. Av. Carlos III s/n, 45071 Toledo, Spain
Correspondence to:J. Bedia ([email protected])
Received: 17 November 2011 – Accepted: 8 January 2012 – Published: 23 March 2012
Abstract. Wildfires are a major concern on the Iberian Peninsula, and the establishment of effective prevention and early warning systems are crucial to reduce impacts and losses. Fire weather indices are daily indicators of fire dan-ger based upon meteorological information. However, their application in many studies is conditioned to the availability of sufficiently large climatological time series over extensive geographical areas and of sufficient quality. Furthermore, wind and relative humidity, important for the calculation of fire spread and fuel flammability parameters, are relatively scarce data. For these reasons, different reanalysis products are often used for the calculation of surrogate fire danger in-dices, although the agreement with those derived from obser-vations remains as an open question to be addressed.
In this study, we analyze this problem focusing on the Canadian Fire Weather Index (FWI) – and the associated Seasonal Severity Rating (SSR) – and considering three different reanalysis products of varying resolutions on the Iberian Peninsula: NCEP, ERA-40 and ERA-Interim. Be-sides the inter-comparison of the resulting FWI/SSR values, we also study their correspondence with observational data from 7 weather stations in Spain and their sensitivity to the input parameters (precipitation, temperature, relative humid-ity and wind velochumid-ity).
As a general result, ERA-Interim reproduces the observed FWI magnitudes with better accuracy than NCEP, with lower/higher correlations in the coast/inland locations. For instance, ERA-Interim summer correlations are above 0.5 in inland locations – where higher FWI magnitudes are attained – whereas the corresponding values for NCEP are below this threshold. Nevertheless, departures from the observed distri-butions are generally found in all reanalysis, with a general tendency to underestimation, more pronounced in the case of NCEP. In spite of these limitations, ERA-Interim may still be useful for the identification of extreme fire danger events.
(e.g. those above the 90th percentile value) and for the defi-nition of danger levels/classes (with level thresholds adapted to the observed/reanalysis distributions).
1 Introduction
Wildfires are the result of complex interactions between cli-matic, biological, topographical and socioeconomic factors. Weather and climate are key factors in determining fire oc-currence and spread (e.g.: V´azquez and Moreno, 1993; Pyne et al., 1996; Trigo et al., 2006). Understanding the links be-tween weather and climate and fires is important to imple-ment effective fire prevention policies; moreover, in a context of climate change this is further needed to implement adapta-tion strategies. To this aim, indicators of fire risk, such as fire weather danger indices, are of paramount importance as long as they can be used to anticipate potentially dangerous con-ditions (e.g. Stocks et al., 1998; Williams et al., 2001; Car-valho et al., 2008; Littell et al., 2009). Fire weather indices were developed to help fire prevention and fire fighting; they combine meteorological information in order to provide an estimator of fire intensity once a fire has broken out. One of the most widely applied indices is the Canadian Fire Weather Index (FWI), based on the the Canadian Forest Fire Danger Rating System established in Canada since 1971 (van Wag-ner and Pickett, 1987; Stocks et al., 1989). Although ini-tially conceived to be applied to the forests of Canada, it has demonstrated to be useful in other regions of the world, such as the Mediterranean (Viegas et al., 1999; Dimitrakopoulos et al., 2011), Indonesia and Malaysia (deGroot et al., 2006) or New Zealand (Briggs et al., 2005), among others. The broad international interest in the FWI system is the motiva-tion to use it as example in this study.
historical weather records are available for the input vari-ables (instantaneous values for temperature, wind and hu-midity, and 24 hourly accumulated values for precipitation, all measured at noon). However, this information is not always available with the required quality, particularly for wind and relative humidity. Under these circumstances, re-analysis products, which are largely available for the whole world and long periods, might be an alternative for fire dan-ger index reconstructions (e.g.: Hu et al., 2010; Lu et al., 2011).
A reanalysis project consists of the assimilation of obser-vational data through numerical simulation models in order to produce a dataset that reproduces the state of the atmo-sphere with variable vertical and horizontal spatial resolu-tion and spanning an extended historical period that covers several decades or more. Reanalysis outputs can be used for meteorological and climatological studies, including the analysis of past climate variations and change, future climate projections, etc., and so their applications are manyfold in different scientific and technical fields such as agriculture, water resources, energy or natural hazards, to name a few. However, reanalysis data may present spatial and temporal inconsistencies and deviations from the observed climate. In some regions, these can be very pronounced due to model in-accuracies, changes in the observing systems, or simply be-cause their relatively coarse spatial resolution is not able to properly capture local climate variability (Sterl, 2004). These inaccuracies might be critical in the context of FWI calcula-tion due to the mighty importance of weather and climate extremes on fires. Indeed, it is common that, out of the many fires that break out during a year, just a few can amount to significant proportions (>90 %) of the total area burned dur-ing a year (Strauss et al., 1989; V´azquez and Moreno, 1995). Consequently, as it happens with other weather- and climate-related, disaster-prone phenomena, extremes are most rele-vant, and testing the ability of reanalysis data to correctly reproduce critical periods of risk and evaluate their perfor-mance against historical fire records is of utmost importance. The aim of this work was to analyze the consistency of three common reanalysis products of varying resolutions in the Iberian Peninsula and validate their results using obser-vational data, in order to make recommendations on their potential uses and limitations for forest fire research. This study is divided into three main parts: First, the consistency between the different reanalyses for FWI calculation was as-sessed by means of correlation analysis. Then, FWI results, including the sensitivities to input variables, were validated against an observational dataset derived from a network of weather stations (in this case, however, only the two more distinct reanalysis products were tested due to the different overlapping periods). Finally, a percentile analysis was per-formed in order to analyze the behavior of the index under extreme fire danger events. To this aim, we tested the ability of reanalysis to reproduce extreme FWI values and also to identify the periods in which extreme events occurred.
2 Data and methods
FWI is constructed using four weather inputs: precipita-tion accumulated over 24 h (P), and instantaneous temper-ature (T), relative humidity (H) and wind speed (W), gener-ally taken at noon local standard time (Lawson and Armitage, 2008). Based on these four variables, six standard compo-nents are computed. Three of them are known as “fuel mois-ture codes” and model daily changes in the moismois-ture content of forest fuels with different drying rates (van Wagner and Pickett, 1987):
– The Fine Fuel Moisture Code (FFMC), for litter and other fine fuels.
– The Duff Moisture Code (DMC), for loosely compacted organic layers and medium-sized woody materials.
– The Drought Code (DC), an indicator of seasonal drought effects.
The next two components are related with fire behavior and spread:
– The Initial Spread Index (ISI), a numeric rating of the expected rate of fire spread.
– The Buildup Index (BUI), which rates the total amount of fuel available.
Finally, the FWI is obtained as a combination of the previous parameters, representing the intensity of a spreading fire as energy output rate per unit length of fire front, which is used as a general, daily-based indicator of fire danger. Daily FWI values can then be converted to daily severity rating (DSR, van Wagner, 1970), which allows the aggregation of FWI over larger periods of time.
2.1 Reanalysis data
Table 1.Summary of reanalysis data.
Reanalysis Institution Time span (this study) Model res. Horiz. res. Reference
ERA-40 ECMWF 43 yr (1 Jan 1958–31 Dec 2001) T159 L60 ≈1.125◦ Uppala et al. (2005) ERA-Interim ECMWF 21+ yr (1 Jan 1989–31 Jul 2011) T255 L60 ≈0.7◦ Dee et al. (2011) NCEP NCAR 51 yr (1 Jan 1958–31 Dec 2011) T62 L28 ≈2.5◦ Kistler et al. (2001)
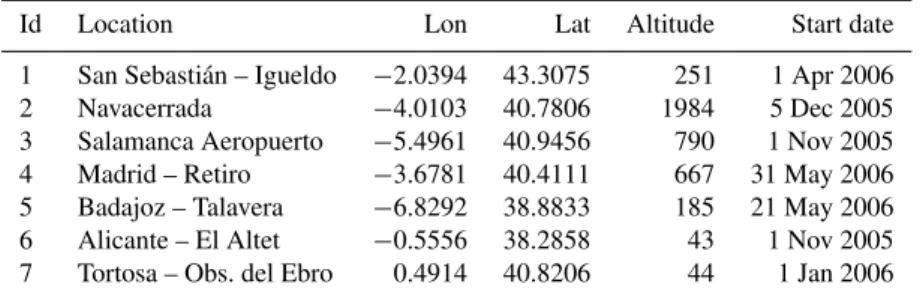
Table 2. Weather stations from the AEMET network used in this study. Their location is indicated on the first map of Fig. 1. Position in decimal degrees and m above sea level (WGS84).
Id Location Lon Lat Altitude Start date
1 San Sebasti´an – Igueldo −2.0394 43.3075 251 1 Apr 2006
2 Navacerrada −4.0103 40.7806 1984 5 Dec 2005
3 Salamanca Aeropuerto −5.4961 40.9456 790 1 Nov 2005
4 Madrid – Retiro −3.6781 40.4111 667 31 May 2006
5 Badajoz – Talavera −6.8292 38.8833 185 21 May 2006 6 Alicante – El Altet −0.5556 38.2858 43 1 Nov 2005 7 Tortosa – Obs. del Ebro 0.4914 40.8206 44 1 Jan 2006
1948 and has been continually updated until present. In Ta-ble 1 we present a summary of the main characteristics of each reanalysis product.
Reanalysis data for the four required variables at 12:00 UTC was gathered considering 24 h accumulated val-ues for precipitation and instantaneous valval-ues for 2 m tem-perature, 10 m wind speed, and surface relative humidity. In the case of precipitation, it is important to note that this is a forecast variable in all reanalysis products (i.e. it is forecasted forward in time from the analysis); on the one hand, NCEP provides precipitation directly as 6-hourly data, and we have calculated present day precipitation as the accumulated val-ues from 12:00 of the previous day to 12:00 of the present day. On the other hand, ECMWF reanalysis products pro-vide accumulated precipitation data at a 3-hourly, forecast-time basis from the analysis forecast-time. In this case, we calculated the accumulated precipitation from 12:00 to 12:00 consider-ing the difference between the accumulated values of forecast times 36 and 12, using the analysis of 00UTC, thus avoiding the spin–up period of the forecasted precipitation that may produce unreliable values.
Moreover, for spatial comparability the three datasets were interpolated to a common grid of 0.5◦resolution centered on the Iberian Peninsula using bilinear interpolation – only grid points within the land-mask were considered to avoid arti-facts due to the transition between sea and land climatic con-ditions in coastal areas. For temporal consistency of compar-isons, we only considered the common 12-yr period for the three reanalysis datasets (i.e. from the start of the most recent ERA-Interim, 1 January 1989, to the end of ERA-40, 31 De-cember 2001). However, for trend analysis we computed the longest available time series in each case.
Fig. 1. Correlations (Mann-Kendall’s Tau coefficient) between the daily FWI values calculated upon the different reanalyses consider-ing their overlappconsider-ing time period (1989–2001). All grid points are significant at theα=0.05 significance level. Crosses indicate the locations of the control weather stations, which have been labeled in the upper left hand panel according to numeric codes displayed in Table 2.
2.2 Local weather data
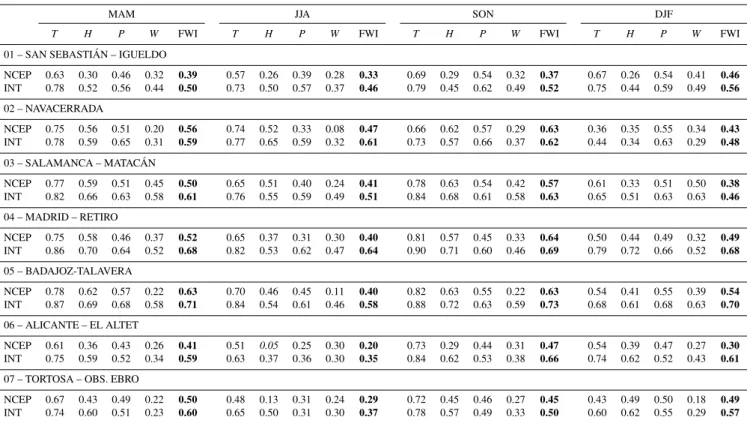
Table 3.Correlation coefficients (Mann-Kendall’s Tau) between observations of the AEMET stations network (Table 2) and the NCEP and ERA-Interim reanalyses for the variables mean surface temperature (T), relative humidity (H), precipitation (P) and wind velocity (W), grouped by seasons (MAM=Spring, March, April, May; JJA = Summer, June, July, August; SON = Fall, September, October, November; DFJ = Winter, December, January, February). The correlation of the derived fire weather index (FWI) is also indicated. Non-significant correlations are written in italics (p >0.05).
MAM JJA SON DJF
T H P W FWI T H P W FWI T H P W FWI T H P W FWI
01 – SAN SEBASTI ´AN – IGUELDO
NCEP 0.63 0.30 0.46 0.32 0.39 0.57 0.26 0.39 0.28 0.33 0.69 0.29 0.54 0.32 0.37 0.67 0.26 0.54 0.41 0.46
INT 0.78 0.52 0.56 0.44 0.50 0.73 0.50 0.57 0.37 0.46 0.79 0.45 0.62 0.49 0.52 0.75 0.44 0.59 0.49 0.56
02 – NAVACERRADA
NCEP 0.75 0.56 0.51 0.20 0.56 0.74 0.52 0.33 0.08 0.47 0.66 0.62 0.57 0.29 0.63 0.36 0.35 0.55 0.34 0.43
INT 0.78 0.59 0.65 0.31 0.59 0.77 0.65 0.59 0.32 0.61 0.73 0.57 0.66 0.37 0.62 0.44 0.34 0.63 0.29 0.48
03 – SALAMANCA – MATAC ´AN
NCEP 0.77 0.59 0.51 0.45 0.50 0.65 0.51 0.40 0.24 0.41 0.78 0.63 0.54 0.42 0.57 0.61 0.33 0.51 0.50 0.38
INT 0.82 0.66 0.63 0.58 0.61 0.76 0.55 0.59 0.49 0.51 0.84 0.68 0.61 0.58 0.63 0.65 0.51 0.63 0.63 0.46
04 – MADRID – RETIRO
NCEP 0.75 0.58 0.46 0.37 0.52 0.65 0.37 0.31 0.30 0.40 0.81 0.57 0.45 0.33 0.64 0.50 0.44 0.49 0.32 0.49
INT 0.86 0.70 0.64 0.52 0.68 0.82 0.53 0.62 0.47 0.64 0.90 0.71 0.60 0.46 0.69 0.79 0.72 0.66 0.52 0.68
05 – BADAJOZ-TALAVERA
NCEP 0.78 0.62 0.57 0.22 0.63 0.70 0.46 0.45 0.11 0.40 0.82 0.63 0.55 0.22 0.63 0.54 0.41 0.55 0.39 0.54
INT 0.87 0.69 0.68 0.58 0.71 0.84 0.54 0.61 0.46 0.58 0.88 0.72 0.63 0.59 0.73 0.68 0.61 0.68 0.63 0.70
06 – ALICANTE – EL ALTET
NCEP 0.61 0.36 0.43 0.26 0.41 0.51 0.05 0.25 0.30 0.20 0.73 0.29 0.44 0.31 0.47 0.54 0.39 0.47 0.27 0.30
INT 0.75 0.59 0.52 0.34 0.59 0.63 0.37 0.36 0.30 0.35 0.84 0.62 0.53 0.38 0.66 0.74 0.62 0.52 0.43 0.61
07 – TORTOSA – OBS. EBRO
NCEP 0.67 0.43 0.49 0.22 0.50 0.48 0.13 0.31 0.24 0.29 0.72 0.45 0.46 0.27 0.45 0.43 0.49 0.50 0.18 0.49
INT 0.74 0.60 0.51 0.23 0.60 0.65 0.50 0.31 0.30 0.37 0.78 0.57 0.49 0.33 0.50 0.60 0.62 0.55 0.29 0.57
obtained. We selected all the available AEMET stations recording the required variables for FWI calculation (includ-ing relative humidity, which is often miss(includ-ing in most obser-vational datasets) and having at least five years of records, resulting in the set of stations presented in Table 2.
Regarding precipitation, daily accumulated values in this case correspond to the 24 h period from 07:00 of the pre-vious day to 07:00 of the current day. This is the standard defined for daily observation gathering protocols, with the exception that usually this value is assigned to the previous day’s precipitation, as opposed to the particular case of FWI calculation, where this accumulated value is assigned to the current day; thus, there is no perfect matching between ob-served and reanalysis precipitations. The rest of the variables correspond to instantaneous noon values, according to the standard definition of FWI (Lawson and Armitage, 2008).
Finally, we want to remark that a careful selection of variables must be performed when using observational and model-simulated (reanalysis and global or regional climate predictions) datasets in order to properly undertake studies involving the calculation of FWI.
2.3 Data analysis
2.3.1 Correlation analysis
2.3.2 Trend analysis
In the same way, we applied the modified Mann-Kendall’s trend test (Hamed and Rao, 1998) for trend analysis. We computed the seasonal severity rating (SSR), a seasonal ag-gregation of daily DSR (van Wagner, 1970) prior to trend analysis. The classical Mann-Kendall correlation test for-mulation evaluates the null hypothesis H0 that a time se-ries{t1,...,tn}is random (independent and identically
dis-tributed) against the alternative hypothesisH1 that the series exhibits a monotonic trend (Mann, 1945). The variance for-mulation of the test is expressed as follows:
var(S)=n(n−1)(2n+5)
18 (1)
In its modified version, a correction factor is applied to the original variance formulation, accounting for the effec-tive sample size in the presence of temporal autocorrelation (Eq. 2), thus avoiding the inflation of type–I statistical error (i.e. the rejection of the null hypothesis when it is actually true).
V∗(S)=var(S)n n∗
s
(2) wherenis the actual number of observations and the effec-tive sample size n/n∗s is given by the following empirical expression:
n n∗
s
=1+ 2
n(n−1)(n−2)
×
n−1
X
i=1
(n−i)(n−i−1)(n−i−2)ρs(i) (3)
in whichρs(i)is the autocorrelation function of the ranks
of the observations. This test is shown to be robust in the presence of serially correlated time series data (Hamed and Rao, 1998).
2.3.3 Influence of input variables on FWI values
We computed mean values of the different input variables for ERA-Interim obtaining maps to draw some conclusions about the influence of input data on fire danger values and their spatial distribution. In addition, we studied the influ-ence of each input variable on FWI values by means of per-centile analysis and plotting the results.
2.3.4 Percentile analysis
We compared the frequency distributions of FWI calculated from NCEP and ERA-Interim and from the observations by means of scatter plots. Fire danger levels are usually assessed by means of percentiles, and in particular the 90th percentile is often used as reference (e.g. Andrews et al., 2003; Car-valho et al., 2008; Dowdy et al., 2010). Thus, henceforth we
will refer to FWI above the 90th percentile (FWI90) as ex-treme fire danger. In order to compare the performance of the different reanalysis products under extreme fire danger situ-ations, we computed FWI90 using the different reanalyses. We also compared the temporal correspondence between re-analysis and observed extreme fire danger events in order to analyze the ability of reanalysis-derived data to identify ob-served extreme events.
All analyses were performed using the R language and environment for statistical computing. FWI was computed following the original equations and FORTRAN code of the FWI presented in van Wagner and Pickett (1985), and the modified Mann-Kendall’s trend test according to the equa-tions presented in Hamed and Rao (1998) and Sheng and Wang (2004).
3 Results and discussion
3.1 Comparison of reanalysis data
The correlations among the daily FWI obtained with the three reanalysis products is shown in Fig. 1. The results indicate remarkable inconsistencies among reanalyses, more apparent when comparing NCEP against ERA-Interim, espe-cially in northwestern Spain in winter. In general, the highest correlation between datasets occurred in fall and the lowest in summer and winter. ERA-40 and ERA-Interim showed general better agreement although there were also inconsis-tencies in northern Spain, notably in the Northwest in winter, and in the Northeast in fall.
3.2 Validation against observations
Table 3 shows the validation of the daily FWI and the re-lated meteorological variables against observations in terms of correlation coefficients. The best correlations were ob-tained by ERA-Interim with lower/higher correlations in the coast/inland locations. For instance, ERA-Interim summer correlations were above 0.5 in inland locations – where higher FWI magnitudes were attained. On the other hand, NCEP was unable to faithfully reproduce the observed local climate in most occasions, leading to poorly correlated FWI values, and it even yielded non-significant correlations for humidity in Alicante.
3.3 Sensitivity of FWI to input parameters
Fig. 2. Sensitivity of FWI to its input variables according to both observational data and ERA-Interim reanalysis at six locations. For each variable, the graph represents the mean FWI values (Y-axis) for those dates in different decile bins of the input variables, as shown in the X-axis labelled from 10 (values of the variable in the lowest decile) to 100 (values in the highest decile).
the FWI, with a high agreement between the results obtained for the observations and for the ERA-Interim reanalysis (the reanalysis with best correlation values).
Note that these results differ from similar studies per-formed in different regions. For instance, according to Dowdy et al. (2010), FWI in Australia is most sensitive to wind, followed by humidity and temperature.
3.4 Fire Danger trend analysis
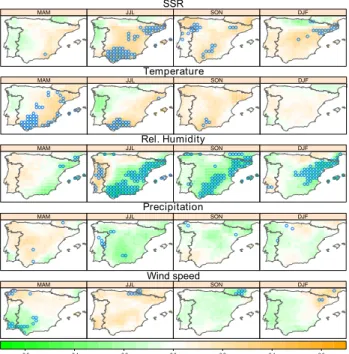
In Fig. 3 we present the trends calculated for SSR using ERA-Interim for the period 1989–2011 showing a significant positive trend in summer. In agreement with the sensitiv-ity results in Sect. 3.3, the trends in southern and northeast-ern Iberia seem to be linked to the spatial pattnortheast-ern of positive trends in temperature and negative trends in relative humid-ity. We found no significant trends in wind velocity and pre-cipitation for most grid cells.
3.5 Percentile and analysis of extremes
In order to analyze the distributional similarity of observed and ERA-Interim and NCEP FWI values, Fig. 4 shows the scatter plots of observed vs reanalysis values as well as the corresponding regression lines. Overall, in spite of the depar-tures of reanalysis FWI from the observed distributions, with a general tendency to underestimation, more pronounced in the case of NCEP, higherR2values were attained by ERA-Interim than for NCEP (e.g. 0.86 vs. 0.65 for Madrid). In
Table 4. Percentage of correct extreme fire danger events (above FWI90) given by the reanalysis – computed as the probability (in %) that an event is extreme for observations, given that it is extreme in the reanalysis. Station codes according to Table 2.
Station NCEP ERA-Int
01 – San Sebasti´an 20 29
02 – Navacerrada 48 58
03 – Salamanca 43 54
04 – Madrid 51 72
05 – Badajoz 40 63
06 – Alicante 25 46
07 – Tortosa 40 42
accordance with the results reported in previous sections, better results were obtained for the inland than for the coastal locations. In the former cases, the distributions are in good correspondence, but the existing biases must be taken into account when using reanalysis data as surrogates of observa-tions.
Fig. 3. Seasonal trends (modified Mann-Kendall’s trend test) for the period 1989–2011 of the seasonal severity rating (SSR) and the input variables temperature, relative humidity, precipitation, and wind velocity according to the ERA-Interim reanalysis. Legend represents Mann-Kendall’s Tau correlation coefficient. Significant trends (p <0.05) are indicated by circles.
box-and-whiskers plot of the corresponding observed quan-tiles. Note that those events over the 0.9 threshold in this plot correspond to reanalysis extreme fire danger events which are also ranked as extreme cases according to the observed datasets – the corresponding probabilities that an event is ex-treme for observations, given that it is exex-treme in the reanal-ysis are given in Table 4. Although there are some outliers, ERA-Interim achieved moderate to good results, revealing its higher performance in the identifications of extreme fire danger situations than NCEP, with probabilities of detection over 60 % for inland locations. Therefore, ERA-Interim can be a suitable choice for the detection of historical, extreme, fire danger events in those areas lacking historical records.
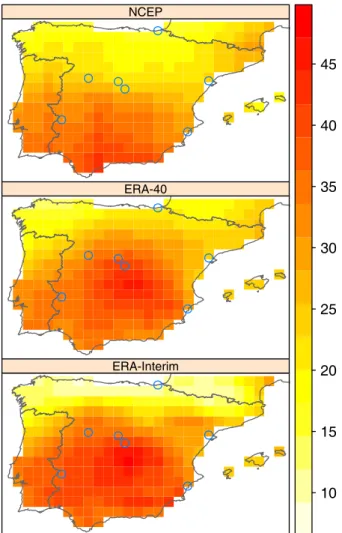
Finally, in Fig. 6 we show the spatial distribution of FWI90 across the Iberian Peninsula according to the different re-analysis datasets. The spatial patterns are similar between ERA-40 and ERA-Interim, whereas NCEP exhibits a smooth north-south gradient. The main differences in the magnitudes were found in central Spain.
4 Conclusions
In this study we evaluated the consistency of the Cana-dian FWI calculated from three reanalysis products of vary-ing original resolutions. Our results indicate significant
01 - San Sebastián
Observed
40 40
0 10 20 30
10 20 30
0
Reanalysis
ERA-Int R2 = 0.20 NCEP R2 = 0.06
140 140 0 Observed Reanalysis 100 120
20 40 60 80
100 120 0 20 40 60 80
03 - Salamanca
ERA-Int R2 = 0.72 NCEP R2 = 0.58
100 0
100
0
20 40 60 80
20 40 60 80 Observed Reanalysis
04 - Madrid
ERA-Int R2 = 0.86 NCEP R2 = 0.65
80 0
0
Observed
Reanalysis
20 40 60
20 40 60 80
05 - Badajoz
ERA-Int R2 = 0.86 NCEP R2 = 0.66
80 0
Observed
Reanalysis
20 40 60
0 20 40 60 80
07 - Tortosa
ERA-Int R2 = 0.55 NCEP R2 = 0.41
FWI90 Observed FWI NCEP vs Obs FWI ERA-Int vs Obs
FWI90 NCEP FWI90 ERA-Int
Reg ERA-Int vs Obs Reg NCEP vs Obs
120 0
Observed
Reanalysis
100
20 40 60 80
100 120 0 20 40 60 80
06 - Alicante
ERA-Int R2 = 0.66 NCEP R2 = 0.38
20 40 60 80 100
100 0 0 20 40 60 80 Observed Reanalysis
02 - Navacerrada
ERA-Int R2 = 0.71 NCEP R2 = 0.64
Fig. 4. Scatter plots of observed vs ERA-Interim and NCEP reanal-ysis FWI values for the period encompassed since the beginning of the observations (Table 2) to June 2011. The dashed lines indicate the corresponding FWI90 values and the regression lines.
Rank
Rank
Rank
Rank
01 - San Sebastián
03 - Salamanca 04 - Madrid
05 - Badajoz
07 - Tortosa
06 - Alicante 02 - Navacerrada
Fig. 5. Rank boxplots of observed FWI quantiles corresponding to the reanalysis (ERA-Interim and NCEP) extreme fire danger events (values above FWI90).
NCEP
ERA-40
ERA-Interim
10 15 20 25 30 35 40 45
Fig. 6. Spatial distribution of the FWI90 as calculated from dif-ferent datasets in the Iberian Peninsula, using their common pe-riod (1989–2001). Blue circles indicate the locations of the control weather stations, which have been labeled in Fig. 1 according to numeric codes displayed in Table 2.
The comparison of NCEP and ERA-Interim predictions with real observations revealed a much better accuracy of ERA-Interim in reproducing both the mean and the extreme fire danger regimes, although this ability was notably dimin-ished in the case of coastal locations compared to inland ones, due to more pronounced departures of the FWI series from the observed distributions.
Acknowledgements. We are grateful to the Spanish Meteorological Agency (AEMET) for providing the observational data used in this study and to Jes´us Fern´andez for useful comments that helped to improve the original manuscript. The research leading to these results has received funding from the European Union’s Seventh Framework Programme (FP7/2007–2013) under grant agreement 243888 (FUME Project) and 265192 (CLIMRUN Project), and from the CICYT project CGL2010-21869.
Edited by: R. Lasaponara
Reviewed by: L. Ghermandi and A. Lanorte
References
Andrews, P., Loftsgaarden, D., and Bradshaw, L.: Evaluation of fire danger rating indexes using logistic regression and percentile analysis, Int. J. Wildland Fire, 12, 213–226, 2003.
Briggs, C., Price, R., and Pearce, G.: Spatial predic-tion of wilfire hazard across New Zealand, Landcare Research Contract Report LC0506/014, New Zealand Fire Service, Chrischurch, New Zealand, available at: http://www.fire.org.nz/Research/Publishsed-Reports/Pages/ Impact-of-Climate-Change-on-Long-term-Fire-Danger.aspx (last access: 16 November 2011), 2005.
Carvalho, A., Flannigan, M. D., Logan, K., Miranda, A. I., and Bor-rego, C.: Fire activity in Portugal and its relationship to weather and the Canadian Fire Weather Index System, Int. J. Wildland Fire, 17, 328–338, 2008.
Dee, D. P., Uppala, S. M., Simmons, A. J., Berrisford, P., Poli, P., Kobayashi, S., Andrae, U., Balmaseda, M. A., Balsamo, G., Bauer, P., Bechtold, P., Beljaars, A. C. M., van de Berg, L., Bid-lot, J., Bormann, N., Delsol, C., Dragani, R., Fuentes, M., Geer, A. J., Haimberger, L., Healy, S. B., Hersbach, H., H´olm, E. V., Isaksen, L., K˚allberg, P., K¨ohler, M., Matricardi, M., McNally, A. P., Monge-Sanz, B. M., Morcrette, J., Park, B., Peubey, C., de Rosnay, P., Tavolato, C., Th´epaut, J.-N., and Vitart, F.: The ERA-Interim reanalysis: configuration and performance of the data assimilation system, Quart. J. R. Meteorol. Soc., 137, 553– 597, 2011.
deGroot, W., Field, R., Brady, A., Roswintiarti, O., and Mohamad, M.: Development of the Indonesian and Malaysian Fire Danger Rating Systems, Mitig. Adapt. Strat. Glob. Change, 12, 165–180, 2006.
Dimitrakopoulos, A., Bemmerzouk, A., and Mitsopoulos, I.: Eval-uation of the Canadian fire weather index system in an eastern Mediterranean environment, Meteorol. Appl., 18, 83–93, 2011. Dowdy, A., Mills, G., Finkele, K., and deGroot, W.: Index
sensi-tivity analysis applied to the Canadian Forest Fire Weather Index and the McArthur Forest Fire Danger Index, Meteorol. Appl., 17, 298–312, 2010.
Hamed, K. H. and Rao, A. R.: A modified Mann-Kendall trend test for autocorrelated data, J. Hydrol., 204, 182–196, 1998. Hu, F., Higuera, P., Walsh, J., Chapman, W., Duffy, P., Brubaker,
L., and Chipman, M.: Tundra burning in Alaska: Linkages to climatic change and sea ice retreat, J. Geophys. Res.-Biogeosci., 115, doi:10.1029/2009JG001270, 2010.
Kistler, R., Kalnay, E., Collins, W., Saha, S., White, G., Woollen, J., Chelliah, M., Ebisuzaki, W., Kanamitsu, M., Kousky, V., van den Dool, H., Jenne, R., and Fiorino, M.: The NCEP-NCAR 50-year
reanalysis: Monthly means CD-ROM and documentation, Bull. Amer. Meteorol. Soc., 82, 247–267, 2001.
Lawson, B. and Armitage, O.: Weather guide for the Canadian For-est Fire Danger Rating System, Tech. rep., Nat. Resour. Can., Can. For. Serv., Edmonton, Canada, 2008.
Littell, J., McKenzie, D., Peterson, D., and Westerling, A.: Climate and wildfire area burned in western US ecoprovinces, 1916– 2003, Ecol. Appl., 1003–1021, 2009.
Lu, W., Charney, J., Zhong, S., Bian, X., and Liu, S.: A North American regional reanalysis climatology of the Haines Index, Int. J. Wildland Fire, 20, 91–103, doi:10.1071/WF08196, 2011. Mann, H.: Nonparametric tests against trend, Econometrica, 13,
245–259, 1945.
Pyne, S., Andrews, P., and Laven, R.: Introduction to Wildland Fire, John Wiley & Sons, New York, USA, 2nd Edn., 1996.
Sheng, Y. and Wang, C.: The Mann-Kendall test modified by effec-tive sample size to detect trend in serially correlated hydrological series, Water Resour. Manag., 18, 201–218, 2004.
Sterl, A.: On the (in)homogeneity of reanalysis products, J. Cli-mate, 17, 3866–3873, 2004.
Stocks, B., Fosberg, M., Lynham, T., Mearns, L., Wotton, B., Yang, Q., Jin, J.-Z., Lawrence, K., Hartley, G. R., Mason, J., and McKenney, D.: Climate change and forest fire potential in Rus-sian and Canadian boreal forests, Climatic Change, 1–13, 1998. Stocks, B., Lawson, B., Alexander, M., Van Wagner, C., McAlpine,
R., Lynham, T., and Dube, D.: The Canadian Forest Fire Danger Rating System – An Overview, For. Chron., 65, 450–457, 1989. Strauss, D., Bednar, L., and Mees, R.: Do One Percent of the Forest Fires Cause Ninety-Nine Percent of the Damage?, Forest Sci., 35, 319–328, 1989.
Tank, A., Wijngaard, J., Konnen, G., Bohm, R., Demaree, G., Gocheva, A., Mileta, M., Pashiardis, S., Hejkrlik, L., Kern-Hansen, C., Heino, R., Bessemoulin, P., Muller-Westermeier, G., Tzanakou, M., Szalai, S., Palsdottir, T., Fitzgerald, D., Rubin, S., Capaldo, M., Maugeri, M., Leitass, A., Bukantis, A., Aber-feld, R., Van Engelen, A., Forland, E., Mietus, M., Coelho, F., Mares, C., Razuvaev, V., Nieplova, E., Cegnar, T., Lopez, J., Dahlstrom, B., Moberg, A., Kirchhofer, W., Ceylan, A., Pachal-iuk, O., Alexander, L., and Petrovic, P.: Daily dataset of 20th-century surface air temperature and precipitation series for the European Climate Assessment, Int. J. Climatol., 22, 1441–1453, 2002.
Trigo, R., Pereira, J., Pereira, M., Mota, B., Calado, T., DaCamara, C., and Santo, F.: Atmospheric conditions associated with the exceptional fire season of 2003 in Portugal, Int. J. Climatol., 26, 1741–1757, 2006.
Uppala, S., Kallberg, P., Simmons, A., Andrae, U., Bechtold, V., Fiorino, M., Gibson, J., Haseler, J., Hernandez, A., Kelly, G., Li, X., Onogi, K., Saarinen, S., Sokka, N., Allan, R., Anders-son, E., Arpe, K., Balmaseda, M., Beljaars, A., Van De Berg, L., Bidlot, J., Bormann, N., Caires, S., Chevallier, F., Dethof, A., Dragosavac, M., Fisher, M., Fuentes, M., Hagemann, S., Holm, E., Hoskins, B., Isaksen, L., Janssen, P., Jenne, R., McNally, A., Mahfouf, J., Morcrette, J., Rayner, N., Saunders, R., Simon, P., Sterl, A., Trenberth, K., Untch, A., Vasiljevic, D., Viterbo, P., and Woollen, J.: The ERA-40 re-analysis, Q. J. R. Meteorol. Soc., 131, 2961–3012, 2005.
Canadian Forestry Service, Ontario, Canada, 1970.
van Wagner, C. E. and Pickett, T. L.: Equations and FORTRAN pro-gram for the Canadian forest fire weather index system, Forestry Tech. Rep. 33, Canadian Forestry Service, Ottawa, Canada, 1985.
van Wagner, C. E. and Pickett, T. L.: Development and structure of the Canadian Forest Fire Weather Index, Forestry Tech. Rep. 35, Canadian Forestry Service, Ottawa, Canada, 1987.
V´azquez, A. and Moreno, J.: Sensitivity of fire occurrence to meteo-rological variables in Mediterranean and Atlantic areas of Spain, Landscape Urban Plan., 117, 129–142, 1993.
V´azquez, A. and Moreno, J.: Patterns of fire occurrence across a cli-matic gradient and its relationship to meteorological variables in Spain, in: Global Change and Mediterranean-Type Ecosystems, edited by: Moreno, J. and Oechel, W., no. 117 in Ecological Studies, Springer Verlag, New York, USA, 1995.
Viegas, D., Bovio, G., Ferreira, A., Nosenzo, A., and Sol, B.: Com-parative study of various methods of fire danger evaluation in southern Europe, Int. J. Wildland Fire, 9, 235–246, 1999. Williams, A., Karoly, D., and Tapper, N.: The sensitivity of