Iranian Journal of Optimization 2(2010) 375-387
of
Optimization
Performance Evaluation of Banks Using DEA
(Case study: Guilan Saderat Bank Branches)
Kambiz Shahroudi, Shamin Assimi
*Department of Industrial Management, Islamic Azad University-Rasht Branch, Rasht, Iran
Young Researchers Club member, Business Administration in M.A., Islamic Azad University-Rasht Branch, Rasht, Iran
Abstract
Performance evaluation has been developed in the form of management schools along by managerial thought development. Banks and financial institutes are one of the most important economic sections to each country which by receipts and payments directing and organizing facilitate business and commercial transactions and develop markets and economic growth and as the main pillars in directing and managing dispersed funds toward production units and regulate cash flow, have specific place in economic growth and inflation control. Therefore, it is necessary for banks to be aware about their branches efficiency and take revision techniques into account for their future planning. In this paper BCC and CCR models (output-oriented) have been used to evaluate the efficiency of 29 sample Saderat bank branches in Guilan Province.
Keywords: Data Envelopment Analysis (DEA), Efficiency, Bank Branches.
*
1. Introduction
Performance evaluation has been developed in the form of management schools along by managerial thought development. Performance appraisal began with F.W. Taylor around the end of the nineteenth century. According to scientific management theory, measurement of tasks and processes provided useful information on which to base improvements in working methods, plant designs, etc (Amaratunga and Baldry, 2002).
There are various factors which improve sustainability and competitiveness situation of a company in a world wide open space e.g. long-term planning, correct definition of objectives, researches, innovation and creativity in the organization, products and services quality, human resource training and continuous appraisal, technology management, etc.
Current era which researchers call it postmodern, owns the characteristics of continuous change and complex structures. Under such a situation only managers can perform successfully who have updated and integrated information on their organization performance and can make on time and correct decisions to improve their organization continuously based on current changes (Saremi and Malaei, 2003). Therefore, What today is referred as the main problem of management is how to face and how to react against environmental changes.
On the other hand, banks and financial institutes are one of the most important economic sections to each country which by receipts and payments directing and organizing facilitate business and commercial transactions and develop markets and economic growth (Hassanzadeh, 2008).
Therefore, performance evaluation (efficiency) of each bank is necessary. In this way, top managers have to logically answer the questions about bank productivity and it is impossible without evaluating the efficiency of their branches. In addition, bank management always have to revise and improve bank services, evaluation, budgeting, innovation in services, competing with other banks, and finally increasing efficiency among their branches based on economic circumstances in now and future time. Therefore, it is necessary for banks to be aware about their branches efficiency and take revision techniques into account for their future planning (Saremi and Malaei, 2003).
Therefore, the questions to the research are:
Is it possible to distinguish between Saderat Bank efficient and inefficient branches in Guilan province?
Can we define reference units for inefficient ones in order to improve them and make them efficient?
2. Literature review
DEA is a non-parametric method which evaluates relative efficiency of DMUs in comparison with each other. In this technique there is no need to know the production function form and there is no limitation in amount of inputs and outputs (Mehrgan, 2008). The primary DEA model developed by Charens, Cooper, and Rodez in 1978 (Cooper and Seiford, 2006). They added mathematical programming to Farel’s non-parametric method that was developed to evaluate the efficiency of DMUs containing two inputs and one output. The developed model by three above called CCR model.
In 1984 BCC model identified by Banker, Charenz, and Cooper in order to develop the CCR model and revise it (Saremi and Malaei, 2003). Bank efficiency as a service-providing unit, is calculating by the ratio of the minimum possible cost to the minimum accomplished cost in order to specify the distinct amount of output in comparison to other units in banking industry (Hassanzadeh, 2008).
(Saremi and Malaei, 2003), hospitals (Al-Shammary, 1999), tourism (Bosseti et al., 2004), logistics (Min and Joo, 2006), post offices (Borenstein, 2004), R&D units (Lee et al., 2009), and schools and universities (Dharmapala and Saber, 2007). Some of the researches in bank industry are shown in table 1.
Table1- some of current researches in bank industry by applying DEA method
Authors Inputs Outputs
Staub et al. (2009) Financial credit
Interest expense Capital Staffs Deposits Loans Investments
Hassan et al. (2009) Fixed assets
Total investments
Total loans
Other incomes from assets
Lin et al. (2009) Number of staff
Interest expense
Deposit operating amount
Current deposit operating amount
Loan operating amount Earning
Operating revenue Interest revenue
Mokhtar et al. (2008) Total deposits
Total overhead expenses
Total earning assets
Bdour et al. (2008) Staffs
Total assets
Total operating expenses
Total deposits Net direct credits Operating income
Kumar and Gulati
(2008)
Physical assets Labour
Loanable funds
Net interest income Non- interest income
Mostafa (2007) Assets
Capital
Net profit ROA ROE
Sufian (2007) Total deposits
Fixed assets
Total loan Other income
Ramanathan (2006) Fixed assets
Deposits Short-term deposits ROA Personnel expenses Loans Other incomes
Wu (2006) Labor
General expenses
3. Methodology
In this paper in order to evaluate the efficiency of bank branches, two radial DEA models have been applied.
Using BCC and CCR output-oriented models 29 branches of Guilan Saderat bank have been evaluated and ranked in a one year period (2009).
There are some steps to the model that are expressed bellow:
Step1. Identifying effective factors to bank branches performance and choosing inputs and outputs to the research,
Step 2.Collecting Inputs and Outputs Data,
Step 3.Evaluating bank branches performance by DEA,
Step 4.Performing AP evaluation method to rank efficient DMUs,
Step 5.Final ranking, and
Step 6.Identifying reference branches for inefficient branches. The explanation of each step is as below:
Step 1. There were so many indicators to evaluate the performance of bank branches regarding to researches.
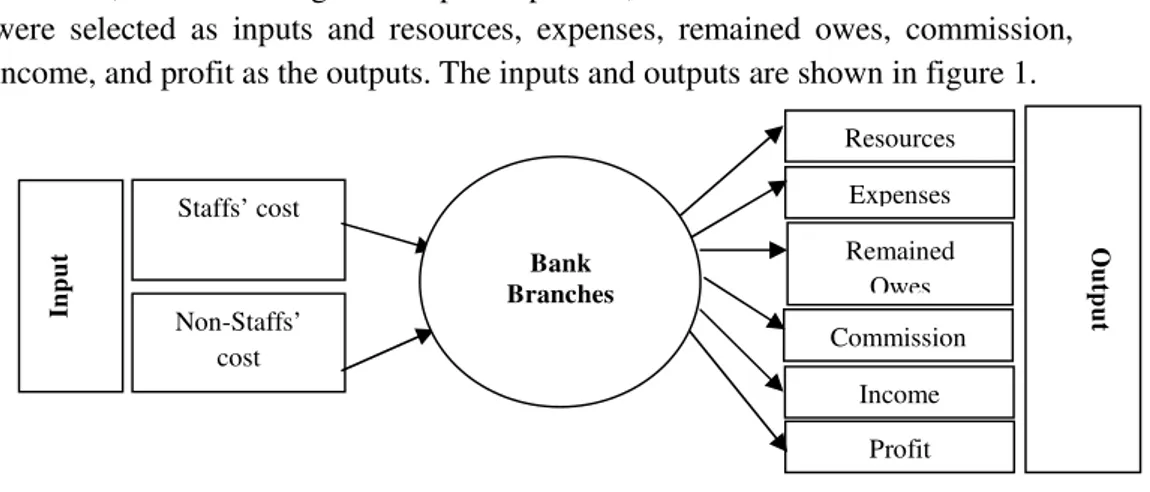
However, after collecting bank experts opinions, Staffs’ costs and non-staff’s cost were selected as inputs and resources, expenses, remained owes, commission, income, and profit as the outputs. The inputs and outputs are shown in figure 1.
Figure 1: Inputs and Outputs of the model.
In
p
u
t
Staffs’ cost
Non-Staffs’ cost
O
u
tp
u
t
Resources
Remained Owes Expenses
Commission
Income
Profit
Step 2.All data were collected by using bank data base and branches documents.
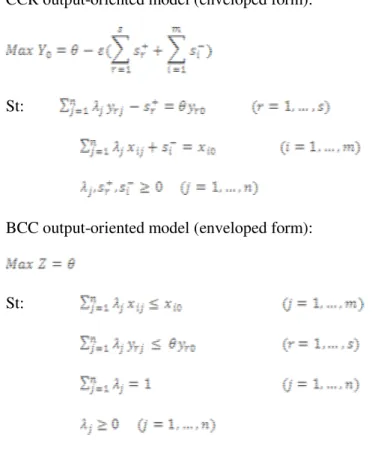
Step 3.In this level bank branches were evaluated by using CCR and BCC both output-oriented forms:
CCR output-oriented model (enveloped form):
St:
BCC output-oriented model (enveloped form):
St:
The results are shown in table 2 and 3.
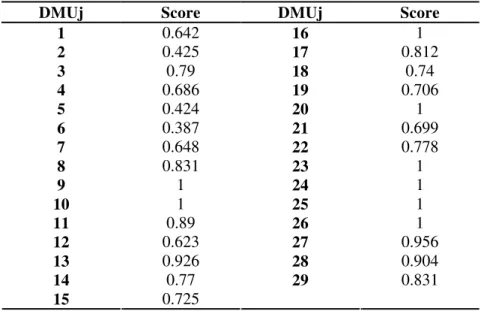
Table 2-solving the model by using CCR output-oriented
DMUj Score DMUj Score
1 0.642 16 1
2 0.425 17 0.812
3 0.79 18 0.74
4 0.686 19 0.706
5 0.424 20 1
6 0.387 21 0.699
7 0.648 22 0.778
9 1 24 1
10 1 25 1
11 0.89 26 1
12 0.623 27 0.956
13 0.926 28 0.904
14 0.77
15 0.725
29 0.831
Table 3-solving the model by using BCC output-oriented
DMUj Score DMUj Score
1 0.642 16 1
2 0.425 17 0.812
3 0.79 18 0.74
4 0.686 19 0.706
5 0.424 20 1
6 0.387 21 0.699
7 0.648 22 0.778
8 0.831 23 1
9 1 24 1
10 1 25 1
11 0.89 26 1
12 0.623 27 0.956
13 0.926 28 0.904
14 0.77
15 0.725
29 0.831
Step 4. Performing AP evaluation method to rank efficient DMUs. As it has shown in table 2 and table 3 the amount of branches with score 1 is more than one. Therefore, in order to rank among efficient branches, AP model has applied. (Table 4)
Table 4-Results of ranking efficient DMUs using AP model
DMUj CCR Rank BCC Rank DMUj CCR Rank BCC Rank
4 - - 1.003 13 23 1.27 6 1.27 8
8 - - 2.11 3 24 1.08 8 1.08 10
9 2.94 1 2.94 1 25 1.41 4 1.05 23
10 1.25 7 1.19 9 26 1.4 5 1.4 7
11 - - 1.07 11 27 - - 1.68 4
16 1.55 3 1.55 6
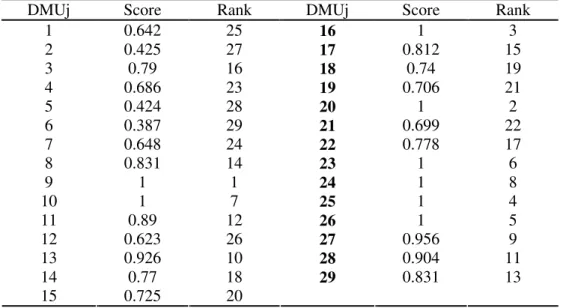
Step 5. Final ranking.The final ranking of Guilan Saderat bank branches after applying AP model are shown in tables 5 and 6.
Table 5-Results of bank branches ranking using CCR model
DMUj Score Rank DMUj Score Rank
1 0.642 25 16 1 3
2 0.425 27 17 0.812 15
3 0.79 16 18 0.74 19
4 0.686 23 19 0.706 21
5 0.424 28 20 1 2
6 0.387 29 21 0.699 22
7 0.648 24 22 0.778 17
8 0.831 14 23 1 6
9 1 1 24 1 8
10 1 7 25 1 4
11 0.89 12 26 1 5
12 0.623 26 27 0.956 9
13 0.926 10 28 0.904 11
14 0.77 18
15 0.725 20
29 0.831 13
Table 6-Results of bank branches ranking using BCC model
DMUj Score Rank DMUj Score Rank
1 0.958 16 16 1 6
2 0.914 17 17 0.853 19
3 0.791 24 18 0.742 27
4 1 13 19 0.707 29
5 0.814 21 20 1 5
6 0.761 26 21 0.717 28
7 0.807 23 22 0.896 18
8 1 3 23 1 8
9 1 1 24 1 10
10 1 9 25 1 12
11 1 11 26 1 7
12 0.811 22 27 1 4
13 0.993 14 28 1 2
14 0.842 20
15 0.725 25
29 0.968 15
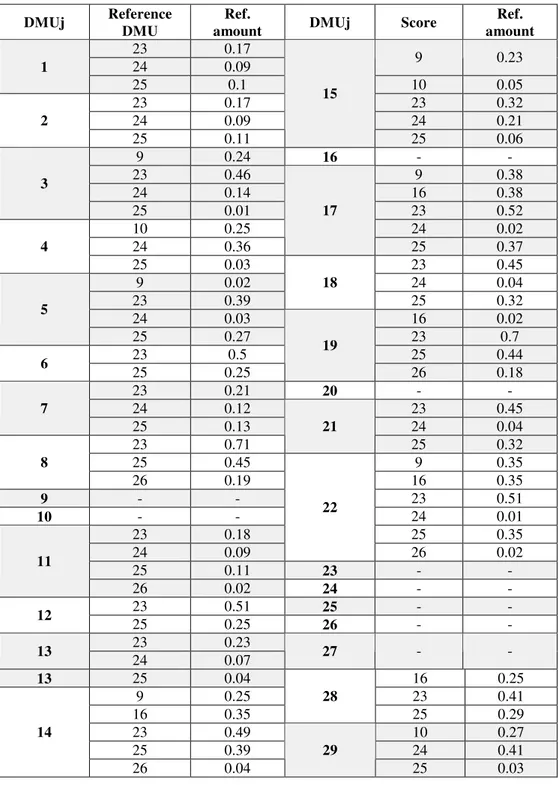
Tables 7 and 8 show the reference branches for inefficient units. Table 7- Reference branches for inefficient DMUs in CCR model
DMUj Reference
DMU
Ref.
amount DMUj Score
Ref. amount
23 0.17
24 0.09 9 0.23
1
25 0.1 10 0.05
23 0.17 23 0.32
24 0.09 24 0.21
2
25 0.11
15
25 0.06
9 0.24 16 -
-23 0.46 9 0.38
24 0.14 16 0.38
3
25 0.01 23 0.52
10 0.25 24 0.02
24 0.36
17
25 0.37
4
25 0.03 23 0.45
9 0.02 24 0.04
23 0.39
18
25 0.32
24 0.03 16 0.02
5
25 0.27 23 0.7
23 0.5 25 0.44
6
25 0.25
19
26 0.18
23 0.21 20 -
-24 0.12 23 0.45
7
25 0.13 24 0.04
23 0.71
21
25 0.32
25 0.45 9 0.35
8
26 0.19 16 0.35
9 - - 23 0.51
10 - - 24 0.01
23 0.18 25 0.35
24 0.09
22
26 0.02
25 0.11 23 -
-11
26 0.02 24 -
-23 0.51 25 -
-12
25 0.25 26 -
-23 0.23
13
24 0.07 27 -
-13 25 0.04 16 0.25
9 0.25 23 0.41
16 0.35
28
25 0.29
23 0.49 10 0.27
25 0.39 24 0.41
14
26 0.04
29
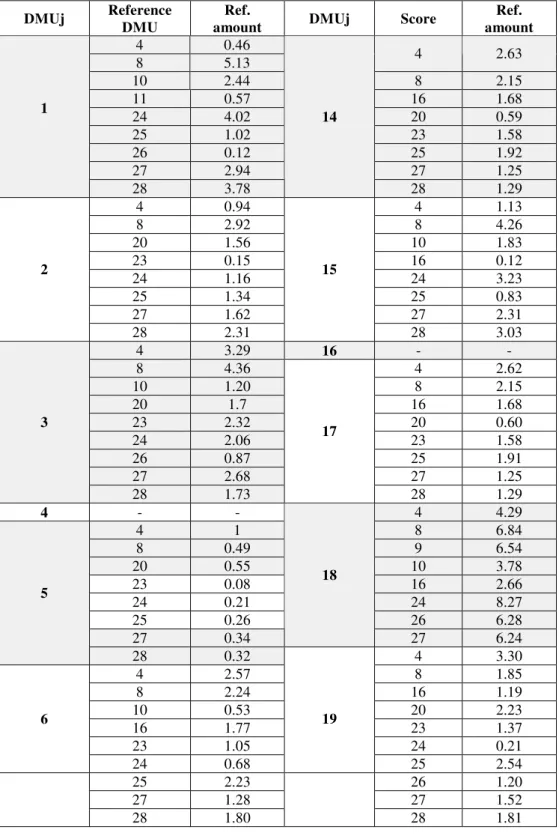
Table 8- Reference branches for inefficient DMUs in BCC model
DMUj Reference
DMU
Ref.
amount DMUj Score
Ref. amount
4 0.46
8 5.13 4 2.63
10 2.44 8 2.15
11 0.57 16 1.68
24 4.02 20 0.59
25 1.02 23 1.58
26 0.12 25 1.92
27 2.94 27 1.25
1
28 3.78
14
28 1.29
4 0.94 4 1.13
8 2.92 8 4.26
20 1.56 10 1.83
23 0.15 16 0.12
24 1.16 24 3.23
25 1.34 25 0.83
27 1.62 27 2.31
2
28 2.31
15
28 3.03
4 3.29 16 -
-8 4.36 4 2.62
10 1.20 8 2.15
20 1.7 16 1.68
23 2.32 20 0.60
24 2.06 23 1.58
26 0.87 25 1.91
27 2.68 27 1.25
3
28 1.73
17
28 1.29
4 - - 4 4.29
4 1 8 6.84
8 0.49 9 6.54
20 0.55 10 3.78
23 0.08 16 2.66
24 0.21 24 8.27
25 0.26 26 6.28
27 0.34
18
27 6.24
5
28 0.32 4 3.30
4 2.57 8 1.85
8 2.24 16 1.19
10 0.53 20 2.23
16 1.77 23 1.37
23 1.05 24 0.21
6
24 0.68
19
25 2.54
25 2.23 26 1.20
27 1.28 27 1.52
4 1.46 20 -
-8 2.79 4 0.89
23 1.93 8 0.39
24 0.04 10 0.28
25 1.13 23 0.11
27 1.34 24 0.41
7
28 1.66 25 0.01
8 - - 27 0.23
9 -
-21
28 0.17
10 - - 4 1.06
11 - - 8 2.18
4 1.11 16 0.88
8 0.42 20 1.07
16 0.46 24 0.71
23 1.68 25 2.22
24 0.42 27 1.28
25 0.01
22
28 2.27
27 0.62 23 -
-12
28 0.22 24 -
-4 1.68 25 -
-9 3.95 26 -
-16 0.94 27 -
-20 0.55 28 -
-4 0.79
8 3.20
10 0.38
20 1.38
24 1.60
25 1.21
27 1.81
13
23 2.92 29
28 2.47
4. Conclusions
Calculated efficiency scores by using DEA technique are always between 0 and 1. This means that DMUs with score 1 are evaluated as efficient and the others lower than 1 are evaluated as inefficient DMUs.
References
[1] Al-Shammari M., “A multi-criteria DEA model for measuring the productive efficiency of hospitals”, International Journal of Operatioans & Production Management 19, 879-891, 1999.
[2] Amaratunga D., and Bardly D., “performance measurement in facilities management and its relationship with management theory and motivation”, facilities, 20 (10), 327-336, 2002.
[3] Bodur J., Al-khoury A., “predicting change in bank efficiency in Jordan: a data envelopment analysis”, Journal of accounting & organizational change, 4 (2), 162-181, 2008.
[4] Borenstein D., Becker J. L., and Prado V. J., “Measuring the efficiency of Brazilian post office stores using data envelopment analysis”, International Journal of Operations & Production Management 24, 1055-1078, 2004.
[5] Bosetti V., Cassinelli M., and Lanza A., “Using data envelopment analysis to evaluate environmentally conscious tourism management”, Nota Di Lavoro59, 1-25, 2004.
[6] Cooper W. W., Seiford L. M., “Introduction to Data Envelopment Analysis and its uses”, Springer 2006.
[7] Hassan T., Mohamad S., and Bader M., “efficiency of conventional versus Islamic banks: evidence from the middle east”, international Journal of Islamic and middle eastern finance and management, 2 (1), 46-65, 2009.
[8] Hassanzadeh A., “Efficiency and Its Effective Factors in Iran Banking System”, Scientific-researching Journal of Jastarhaye Eghtesadi 7, 75-98, 2008.
[9] Kumar S., and Gulati R., “evaluation of technical efficiency and ranking of public sector banks in India”, International journal of productivity and performance management, 57 (7), 540-568,2008.
[11] Lin T., Lee C., and Chiu T., “application of DEA in analyzing a bank’s operating performance”, Expert systems with applications, 36, pp. 8883-8891, 2009.
[12] Mehregan M. R., “Quantitative Models for Organizational Performance Evaluation”, University of Tehran: Faculty of Management, 2008.
[13] Min H., and Joo S. J., “Benchmarking the operational efficiency of third party logistics providers using data envelopment analysis”, Supply Chain Management: An International Journal 11, 259-265, 2006.
[14] Mokhtar H., Abdullah N., Alhabashi S., “Efficiency and competition of Islamic banking in Malaysia”,Humanomics, 24 (1), 28-48, 2008.
[15] Mostafa M., “Modeling the efficiency of GCC banks: a data envelopment analysis approach”, International journal of productivity and performance management, 56 (7), 623-643, 2007.
[16] Ramanathan R., “performance of banks in countries of the Gulf cooperation council”, International journal of productivity and performance management, 56 (2) 137-154, 2007.