A Modified Integrated Genetic Model for Risk
Prediction in Younger Patients with Acute
Myeloid Leukemia
Caroline E. Sloan1,2, Marlise R. Luskin3, Anne M. Boccuti4, Alison R. Sehgal5, Jianhua Zhao2, Robert D. Daber2, Jennifer J. D. Morrissette2, Selina M. Luger3, Adam Bagg2, Phyllis A. Gimotty4☯, Martin Carroll3,6☯*
1Department of Medicine, Perelman School of Medicine at the University of Pennsylvania, Philadelphia, Pennsylvania, United States of America,2Department of Pathology and Laboratory Medicine, Perelman School of Medicine at the University of Pennsylvania, Philadelphia, Pennsylvania, United States of America,
3Division of Hematology and Oncology, Perelman School of Medicine at the University of Pennsylvania, Philadelphia, Pennsylvania, United States of America,4Department of Biostatistics and Epidemiology, Perelman School of Medicine at the University of Pennsylvania, Philadelphia, Pennsylvania, United States of America,5Division of Hematology and Oncology, University of Pittsburgh School of Medicine, Pittsburgh, Pennsylvania, United States of America,6Philadelphia Veterans Administration Medical Center, Philadelphia, Pennsylvania, United States of America
☯These authors contributed equally to this work. *carroll2@mail.med.upenn.edu
Abstract
Background
Although cytogenetics-based prognostication systems are well described in acute myeloid leukemia (AML), overall survival (OS) remains highly variable within risk groups. An inte-grated genetic prognostic (IGP) model using cytogenetics plus mutations in nine genes was recently proposed for patients60 years to improve classification. This model has not been validated in clinical practice.
Methods and Findings
We retrospectively studied 197 patients with newly diagnosed de novo AML. We compared OS curves among the mutational profiles defined by the IGP model. The IGP model assigned patients with intermediate cytogenetics as having favorable, intermediate or unfa-vorable mutational profiles. The IGP model reassigned 50 of 137 patients with intermediate cytogenetics to favorable or unfavorable mutational profiles. Median OS was 2.8 years among 14 patients with intermediate cytogenetics and favorable mutational profiles (mutant
NPM1and mutantIDH1orIDH2) and 1.3 years among patients with intermediate muta-tional profiles. Among patients with intermediate cytogenetics labeled as having unfavor-able mutational profiles, median OS was 0.8 years among 24 patients withFLT3-ITD positive AML and high-risk genetic changes (trisomy 8,TET2and/orDNMT3A) and 1.7 years among 12 patients withFLT3-ITD negative AML and high-risk mutations (TET2,
ASXL1and/orPHF6). OS for patients with intermediate cytogenetics and favorable
a11111
OPEN ACCESS
Citation:Sloan CE, Luskin MR, Boccuti AM, Sehgal AR, Zhao J, Daber RD, et al. (2016) A Modified Integrated Genetic Model for Risk Prediction in Younger Patients with Acute Myeloid Leukemia. PLoS ONE 11(4): e0153016. doi:10.1371/journal. pone.0153016
Editor:Ken Mills, Queen's University Belfast, UNITED KINGDOM
Received:February 23, 2016
Accepted:March 22, 2016
Published:April 6, 2016
Copyright:© 2016 Sloan et al. This is an open access article distributed under the terms of the
Creative Commons Attribution License, which permits unrestricted use, distribution, and reproduction in any medium, provided the original author and source are credited.
Data Availability Statement:All relevant data are within the paper and its supporting information files.
Funding:This work was supported in part by NCI grant R21CA185365 and by the Hematologic Malignancies Translational Center of Excellence of the Abramson Cancer Center. The funders had no role in study design, data collection and analysis, decision to publish, or preparation of the manuscript.
mutational profiles was similar to OS for patients with favorable cytogenetics (p = 0.697) and different from patients with intermediate cytogenetics and intermediate mutational pro-files (p = 0.028). OS among patients withFLT3-ITD positive AML and high-risk genetic changes was similar to patients with unfavorable cytogenetics (p = 0.793) and different from patients with intermediate IGP profile (p = 0.022). Patients withFLT3-ITD negative AML and high-risk mutations, defined as‘unfavorable’in the IGP model, had OS similar to patients with intermediate IGP profile (p = 0.919).
Conclusions
The IGP model was not completely validated in our cohort. However, mutations in six out of the nine genes can be used to characterize survival (NPMI,IDH1,IDH2,FLT3-ITD,TET2,
DNMT3A) and allow for more robust prognostication in the patients who are re-categorized by the IGP model. These mutations should be incorporated into clinical testing for younger patients outside of clinical trials, in order to guide therapy.
Introduction
Acute myeloid leukemia (AML) is a heterogeneous disease with a wide range of clinical out-comes. Clinicians have traditionally relied on clinical features of the patient and disease, as well as the pre-treatment karyotype of leukemic blasts, to predict a patient’s clinical outcome [1,2]. While the presence of a favorable- or unfavorable-risk karyotype may provide useful prognos-tic information, the outcomes of patients with intermediate cytogeneprognos-tics—the largest subgroup
—remain highly heterogeneous, making treatment planning challenging. Recently, the prog-nostic relevance of mutations inFLT3,NPM1andCEBPAhave been established in patients
aged60 years old, specifically in those with intermediate cytogenetic risk [3–6]. These muta-tions have been incorporated into AML prognostic schemas and are recommended for stan-dard testing in patients with newly diagnosed AML [7–9]. Despite these advances, our ability to predict clinical outcomes in patients with AML, especially those with intermediate-risk cyto-genetics, remains limited [2,3,8].
In recent years, advances in sequencing technology have led to the rapid identification of additional recurrent somatic mutations in AML. Mutations in several genes, includingTET2, DNMT3A,ASXL1andPHF6, have been associated with poor prognosis in some cohorts [10–
15], while the prognostic impact of mutations in other genes, such asIDH1andIDH2, is less
clear [16]. In 2012, Patelet al. proposed a prognostic model that integrates cytogenetics and
mutational status for nine genes [14]. This model was developed using data from patients enrolled in a multicenter Eastern Cooperative Oncology Group (ECOG) trial of different doses of anthracycline. Despite the use of this prognostic model by some, its validity in clinical prac-tice has not been demonstrated. The aim of this study was to evaluate the performance of Patel
et al.’s integrated prognostic model in a cohort of patients with de novo AML seen in clinical
practice, and to investigate refinements that could improve risk prediction.
Methods
Patient cohort
Washington University between 2001 and 2013. De novo AML was defined as no prior diagno-sis of hematologic malignancy or myelodysplastic syndrome, or history of previous chemother-apy or radiation. The 106 patients from Penn provided written informed consent to donation of a diagnostic bone marrow, peripheral blood, or pheresis sample to the institution’s Hemato-logic Malignancies Tissue Bank. Information about patient and disease characteristics, treat-ment, and clinical outcome was obtained from review of the medical records. We note that 32 of the Penn patients were included in the ECOG 1900 study, which was used by Patelet al. to
develop their integrated model. The 91 patients from Washington University were identified from The Cancer Genome Atlas (TCGA), which includes data on clinical and disease charac-teristics, as well as patient outcomes [17]. Patients with karyotype t(15;17), unknown cyto-genetic risk, or unavailable clinical information were excluded. All patients received induction chemotherapy at their respective institutions with cytarabine and an anthracycline [18]. Patients did not all get the same dose of induction chemotherapy, reflecting management dif-ferences seen in clinical practice at the time patients were treated. Post-induction chemother-apy and allogeneic stem cell transplant (SCT) regimens were varied and provided at
physicians’discretion. Overall survival (OS) was the primary endpoint and was defined as the time between AML diagnosis and death. Patients alive at the time of data collection were cen-sored at the date of last follow-up. The Penn institutional review board approved this study.
Genetic analysis
Cytogenetic risk was classified as favorable, intermediate, or unfavorable according to the mod-ified Medical Research Council (MRC) criteria [2]. Mutational analysis of samples from Penn was performed by the Center for Personalized Diagnostics, using an amplicon-based custom targeted next-generation sequencing panel for 33 hematologic malignancy-associated genes (TruSeq Custom Amplicon, Illumina Inc.;S1 Table). The libraries generated were pooled and sequenced on the Illumina MiSeq (Illumina, Inc.). The mean depth of coverage across the entire panel was 2000x to achieve a minimum read depth of 250x at any given position. Variant allele frequency was consistently detectable down to 4%. All of the genes included in the panel used by Patelet al., except forMLL-PTD andCEBPA, were included in the Penn multiplex
panel. TheCEBPAgene was isolated using long range PCR, prepared for sequencing using the
Nextera library preparation kit (Illumina, Inc.), and sequenced in tandem with the hematologic next-generation sequencing panel (manuscript in preparation). At Washington University, whole-genome or whole-exome sequencing was performed on all samples with matched nor-mal skin samples, as previously described [17]. Validation re-sequencing for all of the TCGA samples was performed at Wash U. The minimum variant allele frequency for single nucleotide variants was 8%, which was the standard value when using VarScan2 at the time (except for CEBPA, which was 5%, because coverage was lower for that locus).
Statistical analysis
the least non-significant factor in the model to develop the most parsimonious model. SAS ver-sion 9.4 was used for statistical analysis. R was used to produce graphs.
Results
Patient characteristics
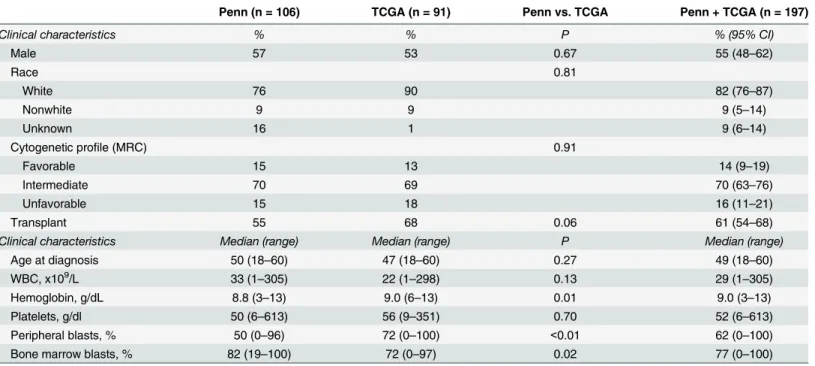
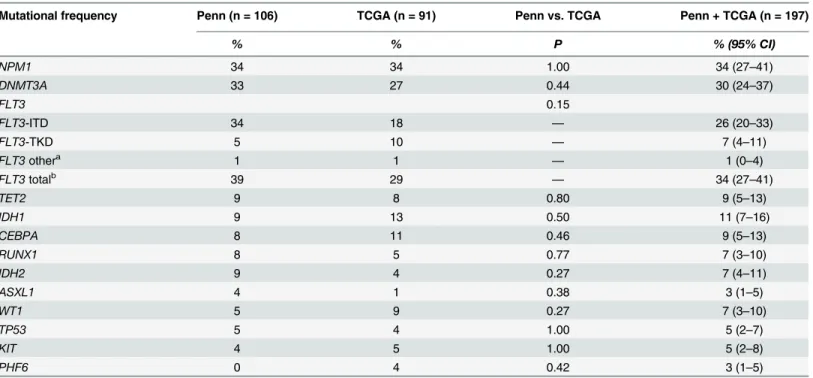
Patient and disease characteristics, including mutational profile, were similar for the Penn and TCGA cohorts, with the exception of hemoglobin, peripheral blast percentage and bone marrow blast percentage (Tables1and2). Among patients at Penn, median follow-up time was 5.1 years for those alive at the end of the study and 1.3 years for those who died. Among patients at Wash-ington University, median follow-up was 2.1 years for those alive at the end of the study and 1.0 year for those who died. The two cohorts were combined for further analysis. The median age of the overall study cohort was 49 years (range, 18–60 years) and 55% were male. The majority had intermediate cytogenetics (70%) and the three most frequent mutations wereNPM1(34%), DNMT3A(30%) andFLT3-ITD (26%). Median follow-up time for the study cohort was 3.0
years among patients alive at the end of the study and 1.0 year among patients who died. Overall, the characteristics of the study cohort, including mutational profile, were similar to the characteristics of the ECOG 1900 cohort that Patelet al. used to develop their model [14].
Median survival time in the ECOG 1900 cohort, defined by Patelet al. as time to death for
those who died or time to last follow-up for those alive at the time of analysis, was 1.7 years at the time of reporting [14].
Overall survival by cytogenetic risk
As expected, OS curves varied by cytogenetic risk. OS for patients with favorable cytogenetics was significantly better than OS for patients with unfavorable cytogenetics (adjusted p = 0.003;
Table 1. Clinical characteristics.
Penn (n = 106) TCGA (n = 91) Penn vs. TCGA Penn + TCGA (n = 197)
Clinical characteristics % % P % (95% CI)
Male 57 53 0.67 55 (48–62)
Race 0.81
White 76 90 82 (76–87)
Nonwhite 9 9 9 (5–14)
Unknown 16 1 9 (6–14)
Cytogenetic profile (MRC) 0.91
Favorable 15 13 14 (9–19)
Intermediate 70 69 70 (63–76)
Unfavorable 15 18 16 (11–21)
Transplant 55 68 0.06 61 (54–68)
Clinical characteristics Median (range) Median (range) P Median (range)
Age at diagnosis 50 (18–60) 47 (18–60) 0.27 49 (18–60)
WBC, x109/L 33 (1–305) 22 (1–298) 0.13 29 (1–305)
Hemoglobin, g/dL 8.8 (3–13) 9.0 (6–13) 0.01 9.0 (3–13)
Platelets, g/dl 50 (6–613) 56 (9–351) 0.70 52 (6–613)
Peripheral blasts, % 50 (0–96) 72 (0–100) <0.01 62 (0–100)
Bone marrow blasts, % 82 (19–100) 72 (0–97) 0.02 77 (0–100)
Penn: Hospital of the University of Pennsylvania; TCGA: The Cancer Genome Network; 95% CI: 95% confidence interval; MRC: Modified Medical Research Council; WBC: white blood cell count.
S1 Fig). Of note, there was no significant difference in OS curves between patients with favor-able and intermediate cytogenetics (adjusted p = 0.141), or between patients with intermediate and unfavorable cytogenetics (adjusted p = 0.976).
Overall survival by integrated genetic prognostic profile
The integrated genetic prognostic model developed by Patelet al., (hereafter referred to as the
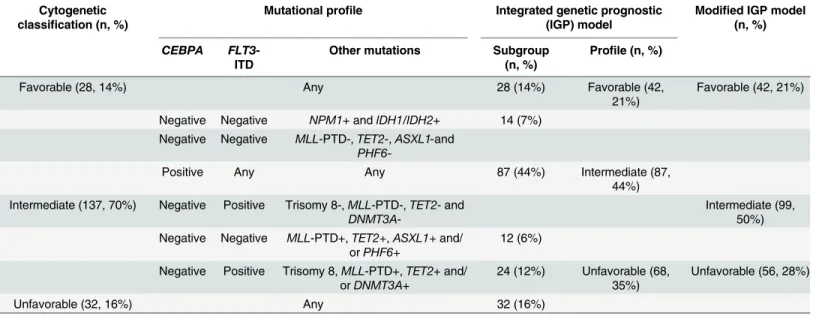
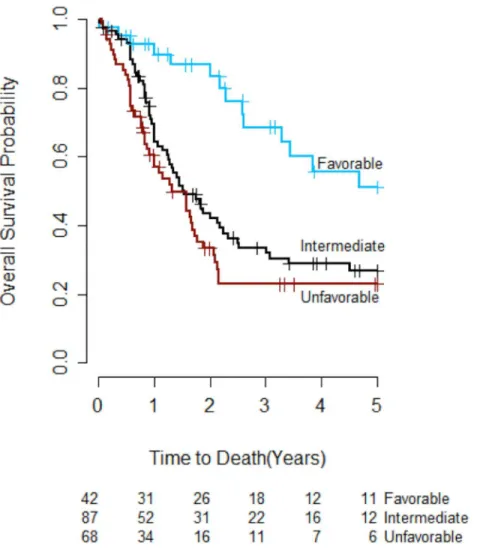
IGP model;Table 3) was evaluated to determine whether the risk groups it defined had differ-ent OS in our study cohort. The IGP model reassigned 14 patidiffer-ents with intermediate cytogenet-ics to the favorable risk group and 36 to the unfavorable risk group, with the remaining 87 patients classified as having intermediate IGP risk. After reclassification, 21% (42), 44% (87), and 35% (68) of the study patients were categorized as having favorable, intermediate and unfavorable IGP risk, respectively (Table 3). The OS curves for the three IGP risk groups are presented inFig 1. OS in the favorable IGP risk group was significantly better than OS in the unfavorable IGP risk group (adjusted p<0.001), but there was no significant difference in OS
between patients with favorable and intermediate IGP risk (adjusted p = 0.055), or between patients with unfavorable and intermediate IGP risk (adjusted p = 0.596).
Survival among subgroups of patients who were reclassified in the IGP model was further examined in order to better understand the impact of molecularly defined genetic mutations on prognosis (Fig 2).Fig 2Apresents the OS curves for the six cytogenetic and mutational pro-files that comprise the IGP model and is shown as a summary for comparison of all groups. Reclassification of a subgroup of patients was considered to be successful when the OS curve of the reclassified subgroup was 1) similar to the OS curve of the risk group to which it was
Table 2. Genetic characteristics.
Mutational frequency Penn (n = 106) TCGA (n = 91) Penn vs. TCGA Penn + TCGA (n = 197)
% % P % (95% CI)
NPM1 34 34 1.00 34 (27–41)
DNMT3A 33 27 0.44 30 (24–37)
FLT3 0.15
FLT3-ITD 34 18 — 26 (20–33)
FLT3-TKD 5 10 — 7 (4–11)
FLT3othera 1 1 — 1 (0–4)
FLT3totalb 39 29 — 34 (27–41)
TET2 9 8 0.80 9 (5–13)
IDH1 9 13 0.50 11 (7–16)
CEBPA 8 11 0.46 9 (5–13)
RUNX1 8 5 0.77 7 (3–10)
IDH2 9 4 0.27 7 (4–11)
ASXL1 4 1 0.38 3 (1–5)
WT1 5 9 0.27 7 (3–10)
TP53 5 4 1.00 5 (2–7)
KIT 4 5 1.00 5 (2–8)
PHF6 0 4 0.42 3 (1–5)
Penn: Hospital of the University of Pennsylvania; TCGA: The Cancer Genome Network.
a
‘FLT3other’includes allFLT3mutations in our database that were not categorized asFLT3-ITD orFLT3-TKD (N841K, D839G, M578T).
b
‘FLT3total’includes allFLT3mutations
reclassified, and 2) different from the OS curve of the group from which it was removed, i.e. the intermediate IGP risk group. These subgroups were analyzed in more detail, as discussed below.
Favorable mutational profile: NPM1 mutant plus IDH1/IDH2 mutant. The OS curve for patients in the study cohort who had intermediate cytogenetics and mutantNPM1plus
mutantIDH1orIDH2(NPM1mut/IDHmut) was similar to the OS curve for patients with
favorable cytogenetics (adjusted p = 0.697) and was significantly different from the OS curve for patients in the intermediate IGP risk group (adjusted p = 0.028;Fig 2B). Closer examination shows that while the OS curve for patients withNPM1mut/IDHmut was similar to the OS
curve for patients with favorable cytogenetics in the first two years, it was closer to the OS curve for the intermediate IGP risk group after two years. Nine of the 14 patients in this group relapsed, up to three years after the initial diagnosis.
Unfavorable mutational profiles. Two subgroups of patients with intermediate cytoge-netics were reclassified to the unfavorable IGP risk group. The OS curve for the 12 patients in the first subgroup–FLT3-ITD negative AML with co-occurring high-risk mutations as defined
by the IGP model (TET2,ASXL1and/orPHF6)–was not significantly different from the OS
curves for patients with unfavorable cytogenetics or patients with intermediate IGP risk (adjusted p = 0.111 and p = 0.919, respectively;Fig 2C). In contrast, the OS curve for the 24 patients in the second subgroup–FLT3-ITD positive AML with co-occurring high-risk genetic
changes (trisomy 8,TET2and/orDNMT3A)–was similar to the OS curve for patients with
unfavorable cytogenetics (adjusted p = 0.793) and significantly different from the OS curve for the intermediate IGP risk group (adjusted p = 0.022;Fig 2D).
Modified IGP model
Based on these observations, a modified IGP (M-IGP) model was developed (Table 3, far right column). The 14 patients with intermediate cytogenetics and favorable mutational profiles were reclassified as having favorable prognosis. The 24 patients with intermediate cytogenetics
Table 3. Schematic representation of integrated genetic prognostic (IGP) model and modified IGP model.
Cytogenetic classification (n, %)
Mutational profile Integrated genetic prognostic (IGP) model
Modified IGP model (n, %)
CEBPA FLT3-ITD
Other mutations Subgroup (n, %)
Profile (n, %)
Favorable (28, 14%) Any 28 (14%) Favorable (42,
21%)
Favorable (42, 21%)
Negative Negative NPM1+ andIDH1/IDH2+ 14 (7%) Negative Negative MLL-PTD-,TET2-,ASXL1-and
PHF6-Positive Any Any 87 (44%) Intermediate (87,
44%) Intermediate (137, 70%) Negative Positive Trisomy 8-,MLL-PTD-,TET2- and
DNMT3A
-Intermediate (99, 50%) Negative Negative MLL-PTD+,TET2+,ASXL1+and/
orPHF6+
12 (6%)
Negative Positive Trisomy 8,MLL-PTD+,TET2+ and/ orDNMT3A+
24 (12%) Unfavorable (68, 35%)
Unfavorable (56, 28%)
Unfavorable (32, 16%) Any 32 (16%)
Adapted from Patelet al.[14]“+”= abnormality or mutation present;“-”= abnormality or mutation absent.
who wereFLT3-ITD positive and had co-occurring high-risk mutations (12% of total; 18% of
those with intermediate cytogenetics) were reclassified as having unfavorable prognosis. Over-all, 21% (42), 50% (99) and 28% (56) of the study patients were categorized as having favorable, intermediate and unfavorable M-IGP risk, respectively (Table 3). Using this model, the OS curves were significantly different between patients with favorable and unfavorable M-IGP profiles (adjusted p<0.001), but there was again no significant difference in OS between
patients with favorable and intermediate M-IGP profiles (adjusted p = 0.178) or between patients with unfavorable and intermediate M-IGP profiles (adjusted p = 0.100).
Three-year OS rates were 69%, 36% and 16% among patients with favorable, intermediate and unfavorable M-IGP profiles, respectively (Table 4andFig 3). The absolute difference in three-year OS rates between favorable and unfavorable profiles in the study cohort was larger in the M-IGP model (53%) than in the IGP (46%) model, but this difference was largest in the cytogenetic model (56%).
Fig 1. Overall survival by integrated genetic prognostic (IGP) profile (n = 197).The overall survival curve for patients with favorable IGP risk was significantly different from the curve for patients with unfavorable IGP risk (adjusted p<0.001). There was no significant difference in survival curves between patients with favorable IGP risk and patients with intermediate IGP risk (adjusted p = 0.055), or between patients with unfavorable IGP risk and patients with intermediate IGP risk (adjusted p = 0.596).
Fig 2. Overall survival in IGP model subgroups.A. Overall survival by cytogenetics and mutational profiles. Among patients with intermediate cytogenetics, three-year overall survival was 59% for those with favorable mutational profiles (A), 33% for those with intermediate mutational profiles (B), 51% for those who wereFLT3-ITD negative with high-risk mutations (C) and 11% for those who wereFLT3-ITD positive with high-risk mutations (D). Three-year overall survival was 77% among patients with favorable cytogenetics (favorable) and 21% among patients with unfavorable cytogenetics (unfavorable). B. Overall survival among patients with favorable mutational profiles. The overall survival curve for patients with intermediate cytogenetics and mutantNPM1
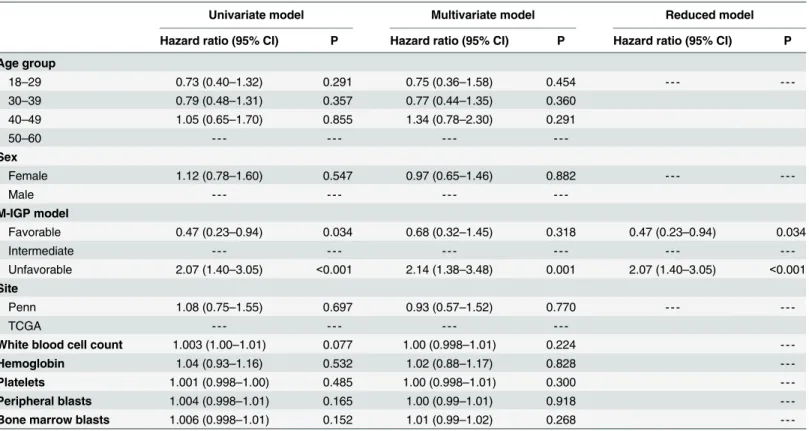
Univariate and multivariate analyses. The correlations between clinical and genetic vari-ables and prognosis were considered next. The only factor that was significant in the univariate Cox regression analyses was the M-IGP classification (Table 5). Compared to patients in the intermediate M-IGP risk group, patients with favorable M-IGP risk had significantly better prognosis (HR = 0.47, 95% CI = 0.23–0.94, p = 0.034) and patients with unfavorable M-IGP risk had significantly worse prognosis (HR = 2.07, 95% CI = 1.40–3.05, p<0.001). M-IGP
pro-file remained a significant prognostic factor in the multivariate model that controlled for clini-cal factors and treatment site, and was the only significant factor in the reduced multivariate model.
Discussion
Every AML diagnosis is accompanied by an assessment of prognosis, customarily based on the clinical features of the patient as well as pre-treatment karyotype [1,19]. Prognostication not only helps set accurate patient expectations, but also informs recommendations for post-remis-sion therapy, including allogeneic SCT. Most experts recommend that patients with favorable cytogenetics proceed with chemotherapy-based consolidation [9,18]. In contrast, patients with unfavorable cytogenetics or other high-risk clinical features should undergo SCT in first remis-sion, because of their poor chance of achieving cure with chemotherapy alone. An optimal treatment course for patients with intermediate cytogenetics has not been defined, however [18]. These patients have highly varied clinical outcomes, making it difficult to provide an assessment of prognosis or informed recommendations for consolidation therapy.
Recently, a number of recurrent somatic mutations associated with AML have been shown to be independently associated with prognosis [5,11,20–25]. The challenge is now to incorpo-rate the prognostic information of these frequently co-occurring mutations with established clinical and cytogenetic factors, in order to improve our ability to determine AML prognosis and improve clinical care, particularly among patients with intermediate cytogenetics. The European LeukemiaNet (ELN) was the first group to develop a prognostic model that accounted for both cytogenetics and molecular markers. This model was validated in a large European cohort [8], but only included mutations in three genes. Building on the ELN’s approach, Patelet al. developed an integrated prognostic model with a wider range of
molecu-lar markers, using data from patients enrolled in a multicenter randomized controlled trial. Despite the use of this model in clinical practice by some, it has not been validated in a second cohort of patients.
p = 0.919, respectively). D. Overall survival among patients withFLT3-ITD positive AML and high-risk mutations. The overall survival curve for patients with
FLT3-ITD positive (FLT3-ITD+) AML and co-occurring high-risk mutations (trisomy 8,TET2and/orDNMT3A) was similar to the survival curve for patients with unfavorable cytogenetics (adjusted p = 0.793) and different from the survival curve for patients in the intermediate IGP risk group (adjusted p = 0.022).
doi:10.1371/journal.pone.0153016.g002
Table 4. Three-year overall survival by classification system.
3-year overall survival, % (95% CI)
Prognostic group Cytogenetic classification Integrated genetic prognostic (IGP) model Modified IGP model
Favorable 77 (58–96) 69 (52–85) 69 (52–85)
Intermediate 34 (25–42) 33 (23–44) 36 (25–46)
Unfavorable 21 (4–37) 23 (12–34) 16 (5–27)
95% CI: 95% confidence interval
We studied Patelet al.’s IGP model in a cohort of patients from two different institutions
who were not treated uniformly, reflecting variations seen in clinical practice. The proportions of ECOG 1900 patients in each IGP risk group were similar to those of our study cohort [14]. Yet, the IGP model was not completely validated in our cohort: it did not consistently define groups of AML patients with statistically significant differences in survival. We would therefore not recommend its use as originally described in routine clinical practice. When we applied the IGP model to our patient cohort, it did reclassify 50 of 137 patients with intermediate cytoge-netics as having favorable or unfavorable mutational profiles, thus reducing the number of patients with intermediate-risk AML from 70% to 44%. However, not all patients who were reclassified to the favorable and unfavorable risk groups had survival outcomes that were truly different from the intermediate risk group. It is crucial that the risk groups defined by a classifi-cation model accurately describe survival outcomes and fully consider all treatment options, including allogeneic stem cell transplant, which we are not able to assess due to lack of available data. In our study, we created refined subgroups, defined by the M-IGP model, to provide a
Fig 3. Overall survival by modified IGP profile (n = 197).The overall survival curve for patients with favorable M-IGP risk was significantly different from the survival curve for patients with unfavorable IGP risk (adjusted p<0.001). There was no significant difference in survival curves between patients with favorable M-IGP profiles and patients with intermediate M-IGP profiles (adjusted p = 0.178), or between patients with unfavorable M-IGP profiles and patients with intermediate M-IGP profiles (adjusted p = 0.100).
comparison to the previous work by Patel et al. Further studies should investigate appropriate management of these subgroups. It is also possible that a de novo approach to prognostication would in fact define only two prognostic groups (favorable and unfavorable). Further studies using an unbiased approach will address this question.
As shown, we assessed the survival curves for each IGP mutational subgroup to determine where the IGP model was successful and whether it could be refined. We found that patients who hadFLT3-ITD negativeNPM1mut/IDHmut AML had an OS curve that was significantly
different from that of the intermediate IGP risk group and similar to that of patients with favorable cytogenetics, indicating that this molecular subgroup is truly a low-risk group. How-ever, while survival among these patients was similar to survival among patients with favorable cytogenetics in the first two years after diagnosis, it was closer to survival for the intermediate IGP risk group after two years. This may suggest that while patients withNPM1mut/IDHmut
AML respond favorably to induction chemotherapy, they are more likely to relapse than patients with core binding factor AML, leading to long-term outcomes similar to patients with intermediate-risk AML. It is still not clear whether these patients should receive the same man-agement as patients with favorable cytogenetics [26]. Future research should study long-term survival among patients with this mutational profile.
Patients who hadFLT3-ITD negative AML with co-occurring high-risk mutations (TET2, ASXL1and/orPHF6) had survival similar to patients with intermediate IGP risk AML and
therefore did not merit reclassification into an unfavorable risk group. To try to explain this difference from Patelet al.’s results, it would be desirable to compare the clinical characteristics
of this group in the ECOG 1900 cohort and our study cohort; however, this information was
Table 5. Univariate and multivariate Cox models for overall survival (n = 197).
Univariate model Multivariate model Reduced model
Hazard ratio (95% CI) P Hazard ratio (95% CI) P Hazard ratio (95% CI) P
Age group
18–29 0.73 (0.40–1.32) 0.291 0.75 (0.36–1.58) 0.454 - - -
-30–39 0.79 (0.48–1.31) 0.357 0.77 (0.44–1.35) 0.360
40–49 1.05 (0.65–1.70) 0.855 1.34 (0.78–2.30) 0.291
50–60 - - -
-Sex
Female 1.12 (0.78–1.60) 0.547 0.97 (0.65–1.46) 0.882 - - -
-Male - - -
-M-IGP model
Favorable 0.47 (0.23–0.94) 0.034 0.68 (0.32–1.45) 0.318 0.47 (0.23–0.94) 0.034
Intermediate - - -
-Unfavorable 2.07 (1.40–3.05) <0.001 2.14 (1.38–3.48) 0.001 2.07 (1.40–3.05) <0.001
Site
Penn 1.08 (0.75–1.55) 0.697 0.93 (0.57–1.52) 0.770 - - -
-TCGA - - -
-White blood cell count 1.003 (1.00–1.01) 0.077 1.00 (0.998–1.01) 0.224
-Hemoglobin 1.04 (0.93–1.16) 0.532 1.02 (0.88–1.17) 0.828
-Platelets 1.001 (0.998–1.00) 0.485 1.00 (0.998–1.01) 0.300
-Peripheral blasts 1.004 (0.998–1.01) 0.165 1.00 (0.99–1.01) 0.918
-Bone marrow blasts 1.006 (0.998–1.01) 0.152 1.01 (0.99–1.02) 0.268
-95% CI: -95% confidence interval; M-IGP model: Modified integrated genetic prognostic model
not available for the ECOG 1900 cohort. In contrast, a third group of patients, those with
FLT3-ITD positive AML and co-occurring high-risk genetic changes (trisomy 8,TET2and/or
DNMT3A) had an OS curve that was significantly different from that of the intermediate IGP
risk group and similar to that of patients with unfavorable cytogenetics. This result suggests that this molecular subgroup is truly a high-risk group with an outcome similar to AML with unfavorable cytogenetics. The genes included in this molecular subgroup should be incorpo-rated into clinical testing outside of clinical trials, as these patients may benefit from SCT in first remission, similar to patients with unfavorable cytogenetics.
Although we have not validated the overall IGP model, we do believe that two of the molec-ular groups identified by Patelet al. deserve to be considered in patient management. We
there-fore refined the IGP model by reclassifying only two out of three mutational profiles. We found that the intermediate M-IGP risk group included a larger proportion of patients (55%) compared to the intermediate IGP risk group (44%), thus increasing the number of patients for whom prognosis is less certain. However, this classification model ensures that patients seen in clinical practice who meet criteria for each risk group are correctly classified. The M-IGP model is thus more accurate when applied to our study cohort, but should be validated in other cohorts in further studies. We propose that the IGP model should not be used indiscriminately in all patient populations, as the performance of prognostic models may vary among patients not included in the cohorts used to establish the models.
Several differences between our study and that conducted by Patelet al. [14] may explain
why the IGP model was not completely reproducible in our study cohort. First, the methodol-ogy used to assess for mutations differed among the Penn, TCGA and ECOG 1900 cohorts. The TCGA and Penn mutational analyses were performed using next generation sequencing methodologies, which are quite analytically sensitive. The current level for clinical reporting at Penn is 4% whereas Sanger sequencing, used by Patelet al., is considered to have a sensitivity
of only 20%. Second, our group of patients was not treated uniformly with high-dose anthracy-cline-containing regimens, reflecting differences in clinical practice within and across institu-tions. Variations in treatment may particularly impact patients withFLT3-ITD negative, NPM1mut/IDHmut AML. Half of the patients in ECOG 1900 were randomized to high-dose
daunorubicin induction chemotherapy and recent studies suggest that high-dose chemother-apy could significantly improve prognosis among patients withNPM1mutations [27]. Third,
the cytogenetic classification schema used by Patelet al. is different from the one used for our
cohort. We chose to use the MRC schema, as it was developed from a large cohort, is newer, and is commonly used in clinical practice, both in the United States and in Europe [2]. Despite these differences, we found that patients in the study cohort who had intermediate cytogenetics and wereFLT3-ITD negativeNPM1mut/IDHmut had a very good prognosis, as predicted by
the IGP model. Patients who had intermediate cytogenetics and wereFLT3-ITD positive with
co-occurring high-risk genetic changes had a very poor prognosis. This suggests that reclassifi-cation of these two groups is valid and reproducible, regardless of differences in methodology and clinical characteristics.
Our study has several limitations. First, it is limited by sample size, particularly when assess-ing the association between individual mutations and OS. Second, we neither assessed the impact of post-remission therapy and SCT on prognosis, nor included complete remission as an endpoint, as this information was not available for TCGA patients and was not included by Patelet al. as part of their published analysis. Third, in the years since Patelet al.’s paper was
published, increasing evidence has shown that mutations inCEBPAgenerally only affect
prog-nosis when they are biallelic [4,5]. We included both monoallelic and biallelicCEBPA
However, this mutation is only seen in 5–6% of patients with AML so it is unlikely that its inclusion would have changed our overall conclusions [14,28].
In conclusion, we believe that while molecular markers have the potential to improve risk stratification for patients60 years old with de novo AML, we should exercise caution when developing integrated prognostic models to ensure that patients labeled as having favorable-, intermediate-, or unfavorable-risk AML do indeed have different overall survival. Although we did not completely validate the IGP model, we demonstrated that incorporation of six out of nine mutations (FLT3-ITD,DNMT3A,TET2,NPM1,IDH1,IDH2) into clinical testing at
diag-nosis can be used to identify a group of lower risk and very high-risk patients with intermediate cytogenetics. As these mutations are strong molecular determinants of survival, incorporation of testing for them among younger patients with AML may help guide therapy. Given that 28% of younger patients with AML have a three-year survival probability of 16%, further studies should be undertaken to develop novel approaches to therapy for the highest-risk patients.
Supporting Information
S1 Fig. Overall survival by cytogenetic risk (n = 197).The survival curve for patients with favorable cytogenetics was significantly different from the survival curve for patients with unfa-vorable cytogenetics (adjusted p = 0.003). There was no significant difference in OS survival curves between patients with favorable cytogenetics and patients with intermediate cytogenet-ics (adjusted p = 0.141), or between patients with unfavorable cytogenetcytogenet-ics and patients with intermediate cytogenetics (adjusted p = 0.976).
(TIF)
S1 Table. Genomic regions targeted in the next-generation sequencing panel for 33 hema-tologic malignancy-associated genes plusCEBPAat the University of Pennsylvania.
(DOCX)
Acknowledgments
We gratefully acknowledge the patients who provided consent and samples for this study. We thank Lucas Wartman, M.D. for help accessing and annotating the TCGA dataset.
Author Contributions
Conceived and designed the experiments: CES ARS PAG MC. Performed the experiments: CES MRL AMB PAG. Analyzed the data: CES MRL AMB PAG. Contributed reagents/materi-als/analysis tools: JZ RDD JJDM. Wrote the paper: CES MRL AMB SML AB PAG MC.
References
1. Slovak ML, Kopecky KJ, Cassileth PA, Harrington DH, Theil KS, Mohamed A, et al. Karyotypic analysis predicts outcome of preremission and postremission therapy in adult acute myeloid leukemia: a South-west Oncology Group/Eastern Cooperative Oncology Group Study. Blood. 2000; 96: 4075–4083. PMID:11110676
2. Grimwade D, Hills RK, Moorman AV, Walker H, Chatters S, Goldstone AH, et al. Refinement of cyto-genetic classification in acute myeloid leukemia: determination of prognostic significance of rare recur-ring chromosomal abnormalities among 5876 younger adult patients treated in the United Kingdom Medical Research Council trials. Blood. 2010; 116: 354–365. doi:10.1182/blood-2009-11-254441 PMID:20385793
4. Green CL, Koo KK, Hills RK, Burnett AK, Linch DC, Gale RE. Prognostic Significance of CEBPA Muta-tions in a Large Cohort of Younger Adult Patients With Acute Myeloid Leukemia: Impact of Double CEBPA Mutations and the Interaction With FLT3 and NPM1 Mutations. J Clin Oncol. 2010; 28: 2739– 2747. doi:10.1200/JCO.2009.26.2501PMID:20439648
5. Taskesen E, Bullinger L, Corbacioglu A, Sanders MA, Erpelinck CAJ, Wouters BJ, et al. Prognostic impact, concurrent genetic mutations, and gene expression features of AML with CEBPA mutations in a cohort of 1182 cytogenetically normal AML patients: further evidence for CEBPA double mutant AML as a distinctive disease entity. Blood. 2011; 117: 2469–2475. doi:10.1182/blood-2010-09-307280 PMID:21177436
6. Frohling S. Prognostic significance of activating FLT3 mutations in younger adults (16 to 60 years) with acute myeloid leukemia and normal cytogenetics: a study of the AML Study Group Ulm. Blood. 2002; 100: 4372–4380. doi:10.1182/blood-2002-05-1440PMID:12393388
7. Swerdlow Steven H, Campo Elias, Harris Nancy Lee, Jaffe Elaine S, Pileri Stefano A, Stein Harald, et al., editors. WHO Classification of Tumours of Haematopoietic and Lymphoid Tissues. 4th ed. Lyon: International Agency for Research on Cancer; 2008.
8. Mrozek K, Marcucci G, Nicolet D, Maharry KS, Becker H, Whitman SP, et al. Prognostic Significance of the European LeukemiaNet Standardized System for Reporting Cytogenetic and Molecular Alterations in Adults With Acute Myeloid Leukemia. J Clin Oncol. 2012; 30: 4515–4523. doi:10.1200/JCO.2012. 43.4738PMID:22987078
9. Dohner H, Estey EH, Amadori S, Appelbaum FR, Buchner T, Burnett AK, et al. Diagnosis and manage-ment of acute myeloid leukemia in adults: recommendations from an international expert panel, on behalf of the European LeukemiaNet. Blood. 2010; 115: 453–474. doi:10.1182/blood-2009-07-235358 PMID:19880497
10. Metzeler KH, Maharry K, Radmacher MD, Mrozek K, Margeson D, Becker H, et al. TET2 Mutations Improve the New European LeukemiaNet Risk Classification of Acute Myeloid Leukemia: A Cancer and Leukemia Group B Study. J Clin Oncol. 2011; 29: 1373–1381. doi:10.1200/JCO.2010.32.7742 PMID:21343549
11. Chou W-C, Chou S-C, Liu C-Y, Chen C-Y, Hou H-A, Kuo Y-Y, et al. TET2 mutation is an unfavorable prognostic factor in acute myeloid leukemia patients with intermediate-risk cytogenetics. Blood. 2011; 118: 3803–3810. doi:10.1182/blood-2011-02-339747PMID:21828143
12. Metzeler KH, Becker H, Maharry K, Radmacher MD, Kohlschmidt J, Mrozek K, et al. ASXL1 mutations identify a high-risk subgroup of older patients with primary cytogenetically normal AML within the ELN Favorable genetic category. Blood. 2011; 118: 6920–6929. doi:10.1182/blood-2011-08-368225PMID: 22031865
13. Van Vlierberghe P, Patel J, Abdel-Wahab O, Lobry C, Hedvat CV, Balbin M, et al. PHF6 mutations in adult acute myeloid leukemia. Leukemia. 2011; 25: 130–134. doi:10.1038/leu.2010.247PMID: 21030981
14. Patel JP, Gönen M, Figueroa ME, Fernandez H, Sun Z, Racevskis J, et al. Prognostic Relevance of Integrated Genetic Profiling in Acute Myeloid Leukemia. N Engl J Med. 2012; 366: 1079–1089. doi:10. 1056/NEJMoa1112304PMID:22417203
15. Ley TJ, Ding L, Walter MJ, McLellan MD, Lamprecht T, Larson DE, et al. DNMT3A mutations in acute myeloid leukemia. N Engl J Med. 2010; 363: 2424–2433. doi:10.1056/NEJMoa1005143PMID: 21067377
16. Abdel-Wahab. Molecular genetics of acute myeloid leukemia: clinical implications and opportunities for integrating genomics into clinical practice. Hematology. 2012; doi:10.1179/
102453312X13336169155411
17. The Cancer Genome Atlas Research Network. Genomic and Epigenomic Landscapes of Adult De Novo Acute Myeloid Leukemia. N Engl J Med. 2013; 368: 2059–2074. doi:10.1056/NEJMoa1301689 PMID:23634996
18. National Comprehensive Cancer Network. NCCN Clinical Practice Guidelines in Oncology: Acute Mye-loid Leukemia. Version 2.2013 [Internet]. 1 Mar 2013 [cited 5 Nov 2014]. Available:http://www.nccn. org/professionals/physician_gls/PDF/aml.pdf
19. Grimwade D, Walker H, Oliver F, Wheatley K, Harrison C, Harrison G, et al. The importance of diagnos-tic cytogenediagnos-tics on outcome in AML: analysis of 1,612 patients entered into the MRC AML 10 trial. Blood. 1998; 92: 2322–2333. PMID:9746770
21. Gaidzik VI, Paschka P, Späth D, Habdank M, Köhne C-H, Germing U, et al. TET2 mutations in acute myeloid leukemia (AML): results from a comprehensive genetic and clinical analysis of the AML study group. J Clin Oncol Off J Am Soc Clin Oncol. 2012; 30: 1350–1357. doi:10.1200/JCO.2011.39.2886 22. Schnittger S, Eder C, Jeromin S, Alpermann T, Fasan A, Grossmann V, et al. ASXL1 exon 12 mutations
are frequent in AML with intermediate risk karyotype and are independently associated with an adverse outcome. Leukemia. 2013; 27: 82–91. doi:10.1038/leu.2012.262PMID:23018865
23. Pratcorona M, Abbas S, Sanders MA, Koenders JE, Kavelaars FG, Erpelinck-Verschueren CAJ, et al. Acquired mutations in ASXL1 in acute myeloid leukemia: prevalence and prognostic value. Haematolo-gica. 2012; 97: 388–392. doi:10.3324/haematol.2011.051532PMID:22058207
24. Tang J-L, Hou H-A, Chen C-Y, Liu C-Y, Chou W-C, Tseng M-H, et al. AML1/RUNX1 mutations in 470 adult patients with de novo acute myeloid leukemia: prognostic implication and interaction with other gene alterations. Blood. 2009; 114: 5352–5361. doi:10.1182/blood-2009-05-223784PMID:19808697 25. Damm F, Oberacker T, Thol F, Surdziel E, Wagner K, Chaturvedi A, et al. Prognostic Importance of
His-tone Methyltransferase MLL5 Expression in Acute Myeloid Leukemia. J Clin Oncol. 2011; 29: 682–689. doi:10.1200/JCO.2010.31.1118PMID:21205756
26. Röllig C, Bornhäuser M, Kramer M, Thiede C, Ho AD, Krämer A, et al. Allogeneic stem-cell transplanta-tion in patients with NPM1-mutated acute myeloid leukemia: results from a prospective donor versus no-donor analysis of patients after upfront HLA typing within the SAL-AML 2003 trial. J Clin Oncol Off J Am Soc Clin Oncol. 2015; 33: 403–410. doi:10.1200/JCO.2013.54.4973
27. Luskin MR, Lee J-W, Fernandez HF, Lazarus HM, Rowe JM, Tallman MS, et al. High Dose Daunorubi-cin Improves Survival in AML up to Age 60, Across All Cytogenetic Risk Groups Including Patients with Unfavorable Cytogenetic Risk, and FLT3-ITD Mutant AML: Updated Analyses from Eastern Coopera-tive Oncology Trial E1900. Oral Presentation 373. San Francisco, CA; 2014.
28. Dohner K. Prognostic Significance of Partial Tandem Duplications of the MLL Gene in Adult Patients 16 to 60 Years Old With Acute Myeloid Leukemia and Normal Cytogenetics: A Study of the Acute Myeloid Leukemia Study Group Ulm. J Clin Oncol. 2002; 20: 3254–3261. doi:10.1200/JCO.2002.09.088PMID: 12149299