SED
7, 1517–1554, 2015Pinch and swell structures
R. Gardner et al.
Title Page
Abstract Introduction
Conclusions References
Tables Figures
◭ ◮
◭ ◮
Back Close
Full Screen / Esc
Printer-friendly Version Interactive Discussion
Discussion
P
a
per
|
Discussion
P
a
per
|
Discussion
P
a
per
|
Discussion
P
a
per
|
Solid Earth Discuss., 7, 1517–1554, 2015 www.solid-earth-discuss.net/7/1517/2015/ doi:10.5194/sed-7-1517-2015
© Author(s) 2015. CC Attribution 3.0 License.
This discussion paper is/has been under review for the journal Solid Earth (SE). Please refer to the corresponding final paper in SE if available.
Pinch and swell structures: evidence for
brittle-viscous behaviour in the middle
crust
R. Gardner, S. Piazolo, and N. Daczko
Australian Research Council Centre of Excellence for Core to Crust Fluid Systems/GEMOC, Department of Earth and Planetary Sciences, Macquarie University, Sydney, NSW 2109, Australia
Received: 25 March 2015 – Accepted: 27 March 2015 – Published: 24 April 2015
Correspondence to: R. Gardner ([email protected])
SED
7, 1517–1554, 2015Pinch and swell structures
R. Gardner et al.
Title Page
Abstract Introduction
Conclusions References
Tables Figures
◭ ◮
◭ ◮
Back Close
Full Screen / Esc
Printer-friendly Version Interactive Discussion
Discussion
P
a
per
|
Discussion
P
a
per
|
Discussion
P
a
per
|
Discussion
P
a
per
Abstract
The flow properties of middle to lower crustal rocks are commonly represented by viscous flow. However, examples of pinch and swell structures found in a mid-crustal high strain zone at St. Anne Point (Fiordland, New Zealand) suggest pinch and swell structures are initiated by brittle failure of the more competent layer in conjunction with 5
material softening. On this basis we develop a flexible numerical model using brittle-viscous flow where Mohr–Coulomb failure is utilised to initiate pinch and swell structure development. Results show that pinch and swell structures develop in a competent layer in both Newtonian and non-Newtonian flow provided the competent layer has enough viscosity contrast and initially fails brittlely. The degree of material softening 10
after initial failure is shown to impact pinch and swell characteristics with high rates of material softening causing the formation of thick necks between swells by limiting the successful localisation of strain. The flow regime and yielding characteristics of the matrix do not impact pinch and swell structure formation itself, so long as the matrix is less competent. To aid analysis of the structures and help derive the flow properties 15
of rocks in the field, we define three stages of pinch and swell development and offer suggestions for measurements to be made in the field.
Our study suggests that Mohr–Coulomb behaviour combined with viscous flow is an appropriate way to represent the heterogeneous rocks of the middle to lower crust. This type of mid-crustal rheological behaviour has significant influence on the localization of 20
strain at all scales. For example, inclusion of Mohr–Coulomb brittle failure with viscous flow in just some mid-crustal layers within a crustal scale model will result in strain localisation throughout the whole crustal section allowing the development of through-going high strain structures from the upper crust into the middle and lower crust. This localization then has a significant effect on developing near-surface structures.
SED
7, 1517–1554, 2015Pinch and swell structures
R. Gardner et al.
Title Page
Abstract Introduction
Conclusions References
Tables Figures
◭ ◮
◭ ◮
Back Close
Full Screen / Esc
Printer-friendly Version Interactive Discussion
Discussion
P
a
per
|
Discussion
P
a
per
|
Discussion
P
a
per
|
Discussion
P
a
per
|
1 Introduction
Rock deformation in the Earth’s crust is known to be highly heterogeneous (Rudnick and Gao, 2003; Taylor and McLennan, 1985) with localized domains of high strain seen in metamorphic zones from the upper to lower continental crust. For example, the proto-Darling Fault which defines the edge of the Yilgarn craton in Western Australia 5
has three structural zones and reaches to 40 km depth (Middleton et al., 1993). Crustal scale numerical models of tectonic processes using rheological flow properties have provided important insights into scenarios such as continental break-up and collision, and their surface expression in the current landscape. However, these models do not explain the occurrence of these deeply penetrating crustal scale zones of strain lo-10
calisation. While there is ongoing discussion of appropriate rheological models for the upper crust (e.g. Moresi and Mühlhaus, 2006), it is generally accepted that the most suitable rheological model for the middle to lower crust is thermally activated viscous flow (e.g. Molnar and Houseman, 2004). However, there is strong field evidence for brittle fracturing in the middle to lower continental crust (e.g. Brander et al., 2012; Fus-15
seis et al., 2006; Guermani and Pennacchioni, 1998; Mancktelow and Pennacchioni, 2005; Segall and Simpson, 1986, 1985) suggesting that this fundamental assumption may be flawed.
For decades geologists have used field evidence of different structures to derive the flow characteristics of middle to lower crustal rocks. For example, Treagus and Trea-20
gus (2002) used deformed pebbles, Ramsay (1980) used shear zones while boudins and mullions have been used in several studies (e.g. Kenis et al., 2004; Urai et al., 2001). Boudins (from Frenchboudin, “sausage”) are chains of rock fragments some-times joined by thin necks giving them the appearance of a string of sausages (Lohest et al., 1908; Ramsay, 1866). They form when a more competent layer is extended 25
SED
7, 1517–1554, 2015Pinch and swell structures
R. Gardner et al.
Title Page
Abstract Introduction
Conclusions References
Tables Figures
◭ ◮
◭ ◮
Back Close
Full Screen / Esc
Printer-friendly Version Interactive Discussion
Discussion
P
a
per
|
Discussion
P
a
per
|
Discussion
P
a
per
|
Discussion
P
a
per
and Urai, 2012; Arslan et al., 2008; Komoróczi et al., 2013; Marques et al., 2012; van der Molen, 1985). Pinch and swell structures, also called drawn or necked boudins, are a subset of boudins that retain continuity of the drawn layers (Fig. 1a and b). These pinch and swell structures have been reported from a large variety of tectonic settings and crustal levels (Arslan et al., 2008; Goscombe et al., 2004; Hobbs et al., 2010; Kenis 5
et al., 2004; Ponce et al., 2013; van der Molen, 1985).
Investigations of the flow properties related to pinch and swell formation have en-compassed three general areas: (i) theoretical analysis (Emerman and Turcotte, 1984; Smith, 1975, 1977) using pure viscous flow which suggests that non-Newtonian flow and material softening is required for pinch and swell formation, (ii) analogue mod-10
elling which generally confirmed the earlier theoretical concepts (Kobberger and Zu-lauf, 1995; Mengong and ZuZu-lauf, 2006; Neurath and Smith, 1982; Zulauf and ZuZu-lauf, 2005), and (iii) numerical modelling which has so far also concentrated on forming the pinch and swell structures in pure viscous flow, where an initial irregularity on the competent layer edge or within the layer is allowed to grow and dominate any other 15
irregularities to allow strain to localise, thereby causing the pinch and swell structure to initiate (e.g. Passchier et al., 2005; Schmalholz and Maeder, 2012; Smith, 1977). Abe and Urai (2012) and Komoróczi et al. (2013) have used a model where initial brittle de-formation caused by high fluid pressure is used to create 90◦fractures (mode I; Koehn et al., 2005; Pollard and Segall, 1987; Scholz, 2002) which initiate the boudin structure 20
followed by viscous flow to allow the structures to develop. This model readily creates torn boudins, a subset of boudins where the separated ends of the competent layer fragments are square.
Once initiated pinch and swell structure development is influenced by the flow prop-erties of all the layers (e.g. Schmalholz and Maeder, 2012; Smith, 1977). Viscous flow 25
is assumed and in its simplest form is described by:
˙
SED
7, 1517–1554, 2015Pinch and swell structures
R. Gardner et al.
Title Page
Abstract Introduction
Conclusions References
Tables Figures
◭ ◮
◭ ◮
Back Close
Full Screen / Esc
Printer-friendly Version Interactive Discussion
Discussion
P
a
per
|
Discussion
P
a
per
|
Discussion
P
a
per
|
Discussion
P
a
per
|
where ˙ǫ is the strain rate, σ is differential stress, n is the stress exponent and A is a constant which reflects the material properties at a specific temperature and pres-sure. Material softening, including processes such as grain size reduction, reactions producing softer minerals, influx of fluids and development of crystallographic preferred orientation (e.g. Passchier and Trouw, 2005) during strain localisation is also an impor-5
tant consideration (Hobbs et al., 2009; Neurath and Smith, 1982, 1977; van der Molen, 1985).
Here we examine field examples of several well exposed chains of pinch and swell structures to determine the prerequisites for a numerical model that allows realistic representation of the initiation and characteristics of pinch and swell structures. At the 10
same time, such a model should represent an appropriate alternative to the commonly used viscous flow model of middle to lower crustal rocks.
Here, we systematically test the impact of (i) stress exponent and brittle failure in the competent layer, (ii) initial viscosity ratio of the competent layer to matrix, (iii) layer dependent stress exponent and brittle behaviour, and (iv) material softening associated 15
with the brittle failure on the formation and evolution of pinch and swell structures. We use our models to derive a scheme of simple field measurements on a pinch and swell outcrop which can provide insights into relative rheological properties of the competent layer and the matrix.
The model is then extended to test the effect of the presence of brittle-viscous defor-20
mation in a subset of the middle to lower crust layers. We conduct exploratory tests on a crustal scale model with extension investigating the strain localisation throughout the model and the characteristics of the developing surface structures. Our results highlight the importance of including heterogeneity in terms of Mohr–Coulomb behaviour, mate-rial softening and viscosity differences on the dynamics of the developing structures at 25
SED
7, 1517–1554, 2015Pinch and swell structures
R. Gardner et al.
Title Page
Abstract Introduction
Conclusions References
Tables Figures
◭ ◮
◭ ◮
Back Close
Full Screen / Esc
Printer-friendly Version Interactive Discussion
Discussion
P
a
per
|
Discussion
P
a
per
|
Discussion
P
a
per
|
Discussion
P
a
per
2 Pinch and swell structures: field and thin section observations and initial interpretation
The rock platform at St. Anne Point, Fiordland, New Zealand (44◦34′19.9′′S 167◦46′55.3′′E) displays an extensive variety of mafic pinch and swell structures, many in long chains developed in a meta-sedimentary matrix (Fig. 1b). Parallel, 2 mm to 5
50 cm thick mafic layers run SW–NE across the rock platform, generally parallel to the overall steeply dipping foliation of the matrix sedimentary layers. Structures within the mafic layers are variable (Fig. 1), with some layers forming well defined pinch and swell chains (Fig. 1b) and others displaying only minor undulation of the mafic to felsic edge. Very narrow (Fig. 1a) to wide (Fig. 1b) neck thicknesses as well as short to long 10
swell separations are developed (Fig. 1a and b). Numerous examples can be seen of apparently brittle failure within the mafic layers (Fig. 1c), where pinch and swell struc-tures typically have residual evidence of conjugate sets of fracstruc-tures at 30 to 40◦to the foliation (Fig. 1) and general layer orientation. Within the swell structures the internal foliation has been variably deflected, deviating up to 15◦ from the orientation of the 15
general matrix foliation (Fig. 1c).
Pairs of samples were taken from the swell centre and edge of the mafic compe-tent layer in multiple pinch and swell chains. A summary of microstructural features is provided here (see Supplement for detailed thin section descriptions). The main diff er-ence between swell centre and swell edge samples is the relative proportion of phases. 20
The swell centre samples have more amphibole+ garnet but less biotite +quartz +
plagioclase compared to neck samples. In all samples amphibole grains are fractured, however, such fractures are much more common in swell edges. In all cases, the frac-tures are filled with quartz, biotite and/or plagioclase (Fig. 1d, e. red arrows). Strain shadows around garnet grains contain the same minerals and indicate fracturing and 25
SED
7, 1517–1554, 2015Pinch and swell structures
R. Gardner et al.
Title Page
Abstract Introduction
Conclusions References
Tables Figures
◭ ◮
◭ ◮
Back Close
Full Screen / Esc
Printer-friendly Version Interactive Discussion
Discussion
P
a
per
|
Discussion
P
a
per
|
Discussion
P
a
per
|
Discussion
P
a
per
|
Brittle fractures in the centre of the swell (Fig. 1d) are at right angles to the general foliation and are not associated with any shear bands. By contrast, similar to outcrop scale brittle features, shear bands and brittle deformation in swell edge samples are at 30–40◦angles to the general foliation, thus representing mode II fractures (Fig. 1e). The presence of numerous fractured grains in swell edges suggests that these fractures 5
may initiate and develop into a through-going shear band (Fig. 1e). These shear bands in turn, are inferred to potentially develop into outcrop scale failures.
The observed assemblage as well as the steeply dipping, SW–NE trending foliation indicate the deformation occurred during the regionalD3 dextral transpression event
(Klepeis et al., 1999). This event occurred at upper greenschist to amphibolite facies 10
conditions at∼8.7 kbar and∼585◦C (Klepeis et al., 1999). These conditions are
con-sistent with amphibole and garnet undergoing brittle deformation (Passchier and Trouw, 2005), while quartz and plagioclase deform in a generally ductile manner (Passchier and Trouw, 2005; Rybacki and Dresen, 2004). The spatial association of increased brit-tle deformation, presence of hydrous minerals and shear band formation at the swell 15
edge suggests the localisation of strain in the mafic layer occurred at swell necks and is associated with both mode II failure and fluid influx. The latter influx was aided by lo-cal porosity and permeability increase due to failure. Existing (quartz, plagioclase) and newly formed phases (quartz, biotite), that do not deform brittlely, undergo dislocation creep as evidenced by undulose extinction, subgrains and irregular boundaries (Stipp 20
et al., 2002). Hence, these phases display non-Newtonian flow (e.g. Ranalli, 1997).
3 Conceptual model based on field analysis
Ideally, in any model, the pinch and swell structures should initialise and develop with minimum manual specification of the initial location and orientation where strain con-centrates to form the necks. The St. Anne Point samples suggest that Mohr–Coulomb 25
SED
7, 1517–1554, 2015Pinch and swell structures
R. Gardner et al.
Title Page
Abstract Introduction
Conclusions References
Tables Figures
◭ ◮
◭ ◮
Back Close
Full Screen / Esc
Printer-friendly Version Interactive Discussion
Discussion
P
a
per
|
Discussion
P
a
per
|
Discussion
P
a
per
|
Discussion
P
a
per
planes seen in the field. At a shear stress defined by the Mohr envelope the material fails on a plane at an angle of±θ◦to the primary stress direction (Fig. 2a) determined
by:
tan(2θ)=1/µ, (2)
whereµ is the friction coefficient. Initial cohesion is the value of shear stress on the 5
Mohr envelope for that material where normal stress is zero and is related to the tensile strength of the material (Fig. 2a).
The observed association of (a) brittle failure and (b) shear band development asso-ciated with crystal plastic deformation of abundant “softer” phases (biotite, quartz and plagioclase) at swell edges suggest the edges transition from brittle to ductile defor-10
mation in agreement with Brander et al. (2012), Fusseis et al. (2006) and Mancktelow (2006). Therefore, material softening occurring after the initial brittle failure needs to be included in the model. This material softening should incorporate both lower viscosity simulating a higher percentage of “soft” phases and lower cohesion simulating a higher degree of fracturing (grey dashed lines, Fig. 2a).
15
In addition, the St. Anne Point samples display non-Newtonian flow, so both New-tonian and non-NewNew-tonian flow should be included in the model. Based on these ob-servations, conceptually, a numerical model to describe the growth of pinch and swell structures should encompass: (1) no specified geometric perturbation (e.g. sine waves or notches) in the competent layer, (2) ability to deform by brittle failure resulting in 20
SED
7, 1517–1554, 2015Pinch and swell structures
R. Gardner et al.
Title Page
Abstract Introduction
Conclusions References
Tables Figures
◭ ◮
◭ ◮
Back Close
Full Screen / Esc
Printer-friendly Version Interactive Discussion
Discussion
P
a
per
|
Discussion
P
a
per
|
Discussion
P
a
per
|
Discussion
P
a
per
|
4 Numerical implementation
4.1 General model set up
We used the numerical modelling platform Underworld (Moresi et al., 2003, 2007), a 2-D and 3-D simulation package using Langrangian particle-in-cell finite element methods for modelling large-scale geodynamic processes on geologic time scales to 5
investigate the initiation and evolution of pinch and swell structures.
We implement 2-D models with two different geometries: (i) a three layer model which is the simplest possible geometry, where the central layer (Fig. 2b, layer B) is more com-petent and (ii) a multi-layer model with a brittle upper layer i.e. upper crust and variably competent layers in the lower parts (layer B) of the model (Fig. 2d). Passive black 10
marker lines are included in each layer to show the movement of pre-existing planar features such as bedding or foliation as the simulation proceeds (Fig. 2b). All simula-tions use incompressible Uzawa Stokes Flow calculation on an initial 1×1 square that
is extended horizontally using a non-dimensional velocity of−0.5 on the left hand side
and+0.5 on the right hand side to simulate extension. Top and bottom boundaries are 15
fixed. In all experiments the models were run over 200 iterations or steps, to a stretch (s) of 3.2, with each step increasing the stretch as calculated from the elongation of the original 1×1 square based on:
s=L/Li, (3)
whereLis the length at that step andLiis the initial length (Twiss and Moores, 1992). 20
Non-Newtonian flow simulations use a stress exponent of three (n=3, Eq. 1) as we consider this to closely represent the flow of naturally occurring rocks (Table S1). All inputs into the models are non-dimensional. This allows for comparison of only relative properties between the layers and between models.
Each layer material has characteristics that combine to give the material constant (A, 25
SED
7, 1517–1554, 2015Pinch and swell structures
R. Gardner et al.
Title Page
Abstract Introduction
Conclusions References
Tables Figures
◭ ◮
◭ ◮
Back Close
Full Screen / Esc
Printer-friendly Version Interactive Discussion
Discussion
P
a
per
|
Discussion
P
a
per
|
Discussion
P
a
per
|
Discussion
P
a
per
and pressure, activation energy and volume, and the presence or absence of melt and/or water (Hirth and Kohlstedt, 2003). In our model, these variables have been incorporated into a single viscosity value (η): layer B is more competent than the matrix layers A. An initial viscosity ratio (RV) is calculated:
RV=ηBi/ηAi, (4)
5
whereηBiis the initial viscosity of the competent layer B andηAiis the initial viscosity of
the matrix layers A. The viscosities for both layers will change depending on the strain rate as the non-Newtonian flow simulations progress. By contrast, in the linear (n=1) Newtonian flow simulations the viscosities are constant (per Eq. 1).
Mohr–Coulomb behaviour was included to model brittle failure by using the Under-10
world implementation of Moresi and Mühlhaus (2006) which optionally incorporates material softening for the particles that have undergone yielding. This provides the capability of a layer behaving in a plastic manner by brittle fracturing then flowing as a viscous fluid. Pressure is not specifically reported here because in this implemen-tation it has an inverse relationship to viscosity (see Eq. (3) in Moresi and Mühlhaus, 15
2006). Theoretically, as stress is increased, the layers should undergo first, pure elas-tic deformation at very low strain (cross-hatched and dotted areas in Fig. 2c), followed by viscous deformation (Griggs and Handin, 1960). While elastic behaviour is very im-portant at very low strain of less than 1.03 stretch (e.g. Ranalli, 1997), we simplify the model by assuming a combination of Mohr–Coulomb and viscous behaviour without 20
explicit elastic behaviour at low strains as we are interested in behaviour at higher strain. Details on parameter values used in the 3-layer model are provided in Table 1.
Failure is critically dependent on the initial cohesion of the competent layer (Fig. 2a; ci). It is also necessary to define the cohesion of the layer after failure and softening
(cs). Here we define a cohesion ratio (RCo):
25
SED
7, 1517–1554, 2015Pinch and swell structures
R. Gardner et al.
Title Page
Abstract Introduction
Conclusions References
Tables Figures
◭ ◮
◭ ◮
Back Close
Full Screen / Esc
Printer-friendly Version Interactive Discussion
Discussion
P
a
per
|
Discussion
P
a
per
|
Discussion
P
a
per
|
Discussion
P
a
per
|
Both ci and cs values have no dimensions so provide relative rather than absolute
information (Fig. 2a). This ratio is kept constant in the models except where the impact ofcs is specifically tested in analysis IV.
4.2 Model analysis
Numerical results were extracted from the model at regular intervals throughout the 5
simulations. The results are plotted as spatial distributions of different particle proper-ties, for example, layer affinity, strain rate, stress and viscosity. Results are extracted at different stretch values and are used to represent the model evolution. In addition, model results were analysed using canny edge detection methods in the Image Pro-cessing ToolboxTM in Matlab® to determine swell and neck widths and tortuosity. Tor-10
tuosity is the ratio of the competent edge length to the straight line length. A tortuosity of>1.1 was taken to indicate probable formation of pinch and swell structures. An ad-ditional ratio of the minimum neck width (WN) to the maximum swell width (WS) was measured using:
RW=WN/WS. (6)
15
AnRWvalue<0.4 was taken to indicate successful pinch and swell initiation, a value<
0.2 indicates successful formation of the pinch and swell structures and a value<0.05 indicates attenuation of the neck. In addition, to monitor the behaviour of the system at a local scale, “tracer” particles on a 9×5 grid across the model were marked and their
evolution followed throughout each numerical simulation. Differential stress, strain rate 20
SED
7, 1517–1554, 2015Pinch and swell structures
R. Gardner et al.
Title Page
Abstract Introduction
Conclusions References
Tables Figures
◭ ◮
◭ ◮
Back Close
Full Screen / Esc
Printer-friendly Version Interactive Discussion
Discussion
P
a
per
|
Discussion
P
a
per
|
Discussion
P
a
per
|
Discussion
P
a
per
4.3 Three layer model
In order to evaluate the model behaviour and investigate the impact of flow property variations on pinch and swell structure characteristics, we systematically test their de-velopment:
Analysis I: Effect of mode II failure and stress exponent: To test if pinch and swell 5
structures could be initiated by mode II failure and could form irrespective of the stress exponent, simulations were completed where layer B (Fig. 2b) had brittle Mohr– Coulomb behaviour, and all layers had either Newtonian flow (n=1) or non-Newtonian flow (n=3).RV was set at 20 for this analysis. Other parameters in the models were
as specified in Table 1.RW was used to indicate successful pinch and swell initiation
10
and formation.
Analysis II: Impact of relative initial viscosity: To test the impact of the competent layer to matrix initial viscosity ratio (RV) on the formation of pinch and swell structures
we undertook additional simulations in non-Newtonian flow. RV was increased until
pinch and swell structures were successfully formed. Again,RW was used to indicate
15
successful pinch and swell initiation and formation.
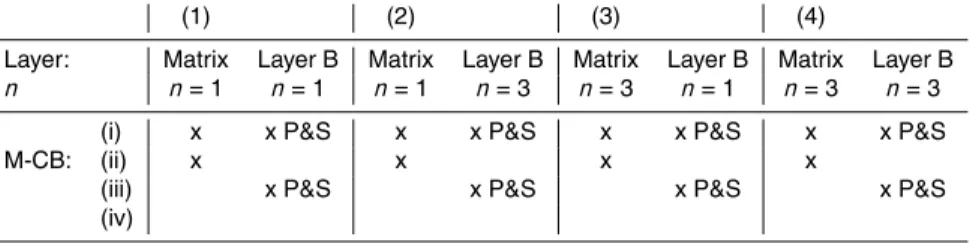
Analysis III: Impact of layer dependent flow properties: To test the impact of brit-tle behaviour and flow regime across the layers in the model, four separate series of simulations withRV set at 10 were undertaken (Table 2). We systematically varied the
stress exponent and brittle behaviour: (1) all layers were given Newtonian flow, (2) 20
matrix layers (A) were given Newtonian flow while layer B was given non-Newtonian flow (n=3), (3) layer B was given Newtonian flow while the matrix layers (A) were given non-Newtonian flow (n=3), (4) all layers were given non-Newtonian flow (n=3). Mohr–Coulomb behaviour was varied within each of these series (Table 1): (i) all layers were given Mohr–Coulomb behaviour; (ii) matrix layers (A) were given Mohr–Coulomb 25
SED
7, 1517–1554, 2015Pinch and swell structures
R. Gardner et al.
Title Page
Abstract Introduction
Conclusions References
Tables Figures
◭ ◮
◭ ◮
Back Close
Full Screen / Esc
Printer-friendly Version Interactive Discussion
Discussion
P
a
per
|
Discussion
P
a
per
|
Discussion
P
a
per
|
Discussion
P
a
per
|
Analysis IV: impact of cohesion and material softening: To test the impact of softening on the formation of pinch and swell structures a series of models with Newtonian flow (n=1), an RV of 20 and Mohr–Coulomb behaviour in only layer B was used. Initial
cohesion was not varied from the previous analyses and only the Underworld cohesion after softening (cs) parameter was varied giving RCo values which ranged from 100,
5
where there is a high degree of softening on those particles that yielded through 20, 10, 4, and 2, to 1 where there is no softening.
4.4 Multi-layer model
To explore the impact of brittle behaviour in the middle to lower crust on the pattern of strain localisation and near-surface structural development, a multi-layer model was 10
developed to represent a crustal scale extensional scenario. In this model, a compress-ible layer at the top (Fig. 2d layer D) allows topography to develop (Hetényi et al., 2011) and a brittle layer (Fig. 2d layer C, with Mohr–Coulomb behaviour) represents the upper continental crust reaching the surface. Five layers (Fig. 2d, A′ and B′ layers) of alter-nating material properties, similar to our 3-layer model, represent the middle to lower 15
continental crust. The relative widths and viscosity ratio (RV=20) of these A′ and B′
layers are the same as for the three layer model. We present results from two simula-tions where the rheological properties of the lower 5 layers (i.e. A′ and B′ layers) are varied. The model was run with non-Newtonian (n=3) flow. In model (a) layers A′and B′have purely viscous rheological properties with no brittle Mohr–Coulomb behaviour, 20
while in model (b) the B′ layers were given Mohr–Coulomb brittle behaviour.
5 Results
5.1 General model behaviour
Flow property testing of the Underworld stress exponent and yielding parameters on a single material 1×1 model ensured flow behaviour according to theoretical
SED
7, 1517–1554, 2015Pinch and swell structures
R. Gardner et al.
Title Page
Abstract Introduction
Conclusions References
Tables Figures
◭ ◮
◭ ◮
Back Close
Full Screen / Esc
Printer-friendly Version Interactive Discussion
Discussion
P
a
per
|
Discussion
P
a
per
|
Discussion
P
a
per
|
Discussion
P
a
per
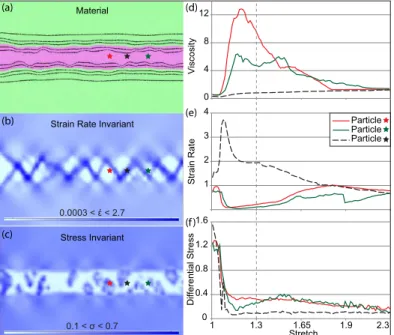
tions (Fig. S1). Model results (Fig. 3a) show the development of the pinch and swell structures and the movement of the planar features. The neck and swell development can be seen most clearly in the strain rate invariant results (Fig. 3b). The inverse re-lationship between strain rate and stress (per Eq. 1) can be seen in Fig. 3b and c. Where strain rate is high (Fig. 3b dark bands), the equivalent area in the stress results 5
has low stress values (Fig. 3c light areas) and the planar features in the material re-sults (Fig. 3a) become distorted. The viscosity, strain rate and differential stress values were plotted (Fig. 3d–f) for selected particles within the competent layer (Fig. 3a–c red, green and black star locations). The black particle has relatively higher strain rate and lower stress as it is in an area that subsequently develops into a neck. By contrast, the 10
red and green particles are in relatively low strain, higher stress areas that develop into swells. As the example shown has a stress exponent of three (n=3), there is also an inverse relationship between viscosity and strain rate (Fig. 3d and e). These graphs show the model is working as theoretically expected for a yielding material (compare Fig. 3f with Fig. 2c).
15
5.2 Analysis I: effect of mode II failure and stress exponent
The progressive development of the pinch and swell structure is shown in Fig. 4 at RV=20 for both Newtonian (Fig. 4a; Fig. 5a dashed black line) and non-Newtonian
(Fig. 4b; Fig. 5a solid black line) flow. Where the competent layer had no brittle be-haviour (Fig. 5a black dotted line), no change in the layer width was seen as the model 20
stretched and thinned, so RW remained at 1. The positions for the formation of the
necks are defined by the mode II brittle failure surfaces initiated at low stretch values, early in the simulations. These failure surfaces, where the strain localises to form local shear bands at∼40◦to the stretching direction, can be seen in the strain rate invariant
results at each stretch value (Fig. 4). As the stretch increases (Fig. 4), the layers are 25
SED
7, 1517–1554, 2015Pinch and swell structures
R. Gardner et al.
Title Page
Abstract Introduction
Conclusions References
Tables Figures
◭ ◮
◭ ◮
Back Close
Full Screen / Esc
Printer-friendly Version Interactive Discussion
Discussion
P
a
per
|
Discussion
P
a
per
|
Discussion
P
a
per
|
Discussion
P
a
per
|
and swell structures to be more obvious at higher stretch values (Figs. 4a and 5a black lines,n=1 dashed,n=3 solid).
Some swell structures display rotation of the passive marker beds as the strain lo-calisation is established (Figs. 4 and 5b to stretch 1.6). Where the strain lolo-calisation is regularly distributed (± ∼40◦ to vertical) this results in swells with the passive beds
5
rotating up to±5◦ (Fig. 4b). At higher stretch values these become curved parallel to
the edge of the swell to matrix interface. Where the strain localisation is not regularly distributed, that is, one direction dominates (e.g. Fig. 5b swell 1 and 2), this results in swells with the passive beds rotating up to±15◦.
Figure 4 shows the localisation of strain to just a few failure planes is more effective in 10
Newtonian (Fig. 4a) than non-Newtonian (Figs. 4b and 5a) flow regimes in this model. The increased number of brittle failure planes for our non-Newtonian flow model results in weaker isolation of the swell structures. At the same strain, the pinch and swell structures are more separated and defined in Newtonian flow than in non-Newtonian flow (for example, Fig. 4 stretch 1.6; Fig. 5a black dashed and solid lines).
15
5.3 Analysis II: effect of relative initial viscosity ratio (RV)
The viscosity of the matrix layers (A) was varied to see the impact ofRVon the forma-tion of pinch and swell structures (Fig. 5a). The ratio of the neck width to swell width (RW) for the series (Fig. 5a) shows thatRWdecreases asRVincreases, indicating better
formation of pinch and swell structures at higherRVvalues. For Newtonian flow, pinch
20
and swell structures were successfully initiated (i.e.RW<0.4) fromRV=10, while for
non-Newtonian flow this was not the case untilRV=125 (Fig. 5a).
5.4 Analysis III: effect of layer dependent flow property behaviour
A summary of results where the Newtonian and non-Newtonian flow and Mohr– Coulomb behaviour of the matrix layers (A) vs. competent layer (B layer) was sys-25
SED
7, 1517–1554, 2015Pinch and swell structures
R. Gardner et al.
Title Page
Abstract Introduction
Conclusions References
Tables Figures
◭ ◮
◭ ◮
Back Close
Full Screen / Esc
Printer-friendly Version Interactive Discussion
Discussion
P
a
per
|
Discussion
P
a
per
|
Discussion
P
a
per
|
Discussion
P
a
per
Pinch and swell structures form where layer B has Mohr–Coulomb brittle behaviour (Table 2, rows i and iii) and do not form where layer B does not have Mohr–Coulomb behaviour (Table 2 rows ii and iv). The results show that the Mohr–Coulomb behaviour of the matrix layers (A) does not impact the formation of pinch and swell structures. The results also show pinch and swell structures can form in both Newtonian and non-5
Newtonian flow in all flow regime combinations of matrix vs. competent layer (Table 2, rows i and iii) where at least layer B has Mohr–Coulomb behaviour.
5.5 Analysis IV: effect of cohesion and material softening
Good pinch and swell development is shown for all models whereRCo>1 (Fig. 6a–e
and h; RW<0.2). The average tortuosity of the two competent layer edges in each
10
model (plotted in Fig. 6 h) shows a gradual increase as RCo increases to RCo=10
where it plateaus. This corresponds to an increasing complexity of pinch and swell structures whereRCo>10 (Figs. 6a–c). Stretch to differential stress graphs of the
dif-ferent cohesion ratios (Fig. 6g) show a sharp drop in stress after the material has failed. Where the material is softer after fracturing (higher RCo values) the stress is lower,
15
though high levels of softening (RCo=20 and 100) show similar differential stress
lev-els. The softened material shows some variability immediately after yielding (as sug-gested by Griggs and Handin, 1960), but then stabilizes to constant stress at larger stretch values. High levels of material softening (RCo=100) also appear to impact
strain localisation, as an area of thick neck that has not formed a pinch and swell 20
structure can be seen (Fig. 6a, black arrow).
5.6 Multi-layer model: impact of brittle behaviour on surface topology
Model results at stretch 2.3 show the development of near surface structure, layer shape and the distribution of strain rate throughout the crustal scale model (Fig. 7). Where the lowest five layers, i.e. the middle to lower crust have non-brittle behaviour 25
SED
7, 1517–1554, 2015Pinch and swell structures
R. Gardner et al.
Title Page
Abstract Introduction
Conclusions References
Tables Figures
◭ ◮
◭ ◮
Back Close
Full Screen / Esc
Printer-friendly Version Interactive Discussion
Discussion
P
a
per
|
Discussion
P
a
per
|
Discussion
P
a
per
|
Discussion
P
a
per
|
areas of focused localisation. This causes very simple near surface faulting and a rel-atively lowRW value allowing the lower layers to be closer to the surface. Where some
of the middle to lower crustal layers (i.e. B′ layers), were given Mohr–Coulomb brittle behaviour (Fig. 7b) representing a heterogeneous rheological behaviour, strain locali-sation is strongest in the upper crust (blue layer), but occurs across all layers leading to 5
relatively dispersed strain localisation. This causes increased complexity of the near-surface faulting and a relatively higherRW value with the lower layers further from the surface. Significant rotation of the planar beds to±23◦ is seen in both models though
this is more prominent in model (a) as the strain is localised predominantly in a single direction. Surface tortuosity (Fig. 7c dashed lines) is very similar between the models 10
up to stretch∼2. As the stretch increases above 2, surface tortuosity decreases more
slowly in model (b) than in model (a) (Fig. 7b).
6 Discussion
6.1 Pinch and swell initiation by brittle deformation
Our model successfully initiates pinch and swell structures using mode II Mohr– 15
Coulomb brittle failure and allows the structures to develop in subsequent viscous flow. This indicates that combining brittle and viscous behaviour is a plausible rheo-logical model for producing pinch and swell structures. The main difference between our model and the model used by Abe and Urai (2012) and Komoróczi et al. (2013) is the type of brittle structures initiating pinch and swell structures; namely mode II vs. 20
mode I brittle deformation.
Our results support Mancktelow (2006) who concluded that ductile shear zones form after Mohr–Coulomb brittle failure at middle to lower continental crust depths. Mancktelow (2006) suggests that ductile flow with fluid influx requires ongoing pres-sure dependent brittle failures, including micro-cracking for fluid to continue to flow into 25
SED
7, 1517–1554, 2015Pinch and swell structures
R. Gardner et al.
Title Page
Abstract Introduction
Conclusions References
Tables Figures
◭ ◮
◭ ◮
Back Close
Full Screen / Esc
Printer-friendly Version Interactive Discussion
Discussion
P
a
per
|
Discussion
P
a
per
|
Discussion
P
a
per
|
Discussion
P
a
per
samples (Fig. 1d and e) are likely examples of the micro-cracking he invokes. This micro-cracking develops into through-going micro-shear bands (Fig. 1e, dashed line) which are then inferred to develop into outcrop scale shear bands. In material science, a shear band forms where strain induced softening factors (thermal and/or geomet-ric) dominate the strain and strain-rate hardening factors (Meyers, 1994). Where this 5
formation of shear bands by plastic deformation is followed by slow crack propagation it is called a “ductile fracture”, compared with a brittle fracture which has little plas-tic deformation and fast crack propagation (Meyers, 1994). Our numerical simulations reproduce these “ductile fractures” suggesting that pinch and swell structures can be formed through “ductile fracturing”.
10
6.2 Effect of stress exponent, brittle behavior,RvandRCofor the competent
layer and matrix
Analysis III shows that brittle failure of at least the competent layer is required for pinch and swell structures to form. Analysis I and II show that pinch and swell structures form readily in Newtonian flow (Fig. 4a) from viscosity ratios of∼10, but in non-Newtonian
15
flow (Figs. 4b and 5) they form only at much larger viscosity ratios of∼125. This result
contrasts with other researchers who suggest pinch and swell structures can only form where the stress exponent (n) >1 (Schmalholz and Maeder, 2012; Smith, 1977). It should be noted that our results are not directly comparable to these studies as their layers are purely viscous and the competent layer required an initial irregularity, or 20
instability to grow to initiate the pinch and swell structure. By contrast, we use brittle deformation for pinch and swell structure initiation and viscous flow for only post failure structure development. Nor are our results directly comparable to the experiments by (Abe and Urai, 2012; Komoróczi et al., 2013) as they have used mode I brittle fracture to initiate the structures while we have modelled mode II fracturing.
25
SED
7, 1517–1554, 2015Pinch and swell structures
R. Gardner et al.
Title Page
Abstract Introduction
Conclusions References
Tables Figures
◭ ◮
◭ ◮
Back Close
Full Screen / Esc
Printer-friendly Version Interactive Discussion
Discussion
P
a
per
|
Discussion
P
a
per
|
Discussion
P
a
per
|
Discussion
P
a
per
|
formed. Our model suggests this is possibly due to the impact of the viscosity ratio on the localisation of strain to form the brittle failures that initiate the structure formation.
Many authors have previously suggested material softening is required for pinch and swell formation (Hobbs et al., 2009; Neurath and Smith, 1982, 1977; van der Molen, 1985). Our results from analysis IV is in general agreement with the latter conclusions, 5
as the degree of softening after failure has a marked effect on the nature of the de-veloping pinch and swell structure (Fig. 6). At low levels of softening (lowRCo) simple symmetric pinch and swell structures are formed while at higher levels more complex structures develop (Fig. 6). These differences in behaviour, can be utilized in the in-terpretation of pinch and swell structures. For example, the presence of thick necks in 10
the pinch and swell chain indicates strong softening within a failure zone relative to its original strength.
In nature, material softening is caused by numerous processes such as grain size reduction and metamorphic reactions resulting in different assemblages. Grain size reduction may occur either by deformation (e.g. Bestmann and Prior, 2003; Fliervoet 15
et al., 1997; Herwegh et al., 2011; Krabbendam et al., 2003; Kruse and Stünitz, 1999) or reaction (e.g. Brodie and Rutter, 1985, 1987; Piazolo and Jaconelli, 2014; Rubie, 1990, 1983; Smith et al., 2015). Assemblage variation due to partial or complete meta-morphic reaction with “softer” phases have been reported to induce strain localization (Brodie and Rutter, 1985, 1987; de Ronde et al., 2005; Holyoke III and Tullis, 2006; 20
Newman et al., 1999; Rubie, 1990, 1983; Stünitz and Tullis, 2001; Watts and Williams, 1983). Material softening may occur to variable degrees even if the same process of softening is involved. For example, grain size reduction can cause limited softening when the new grain size is still dominantly in grain size insensitive, power law flow, however, a transition to grain size sensitive Newtonian flow regime through grain size 25
SED
7, 1517–1554, 2015Pinch and swell structures
R. Gardner et al.
Title Page
Abstract Introduction
Conclusions References
Tables Figures
◭ ◮
◭ ◮
Back Close
Full Screen / Esc
Printer-friendly Version Interactive Discussion
Discussion
P
a
per
|
Discussion
P
a
per
|
Discussion
P
a
per
|
Discussion
P
a
per
6.3 Application of the numerical model to field interpretation
Analysis I (Fig. 4) allows three stages of pinch and swell structure to be distinguished (Fig. 5a) as the structures develop with decreasingRW and increasing stretch:
Stage 1, where zones of localised strain are establishing and the structures have not started to form: 0.4< RW<0.75 (e.g. Fig. 4a stretch 1.2 to 1.6; Fig. 5a).
5
Stage 2, where the strain has localised and pinch and swell structures have success-fully been initiated and are starting to separate: 0.2< RW<0.4 (e.g. Fig. 4a stretch 1.6
to 2.5; Fig. 5a).
Stage 3, where the pinch and swell structures have successfully formed and are well defined and separated:RW<0.2 (e.g. Fig. 4a stretch 2.5 to 3.2; Fig. 5a). Attenuation
10
of the neck is developed whereRW<0.05.
The numerical model can also provide some additional insights into the processes forming the pinch and swell structures: (i) rotation>5◦ of once planar structures in the swell structures indicates uneven strain localisation on the brittle deformation conjugate sets, (ii) tortuosity of the competent layer edges>1.2 and/or complex pinch and swell 15
formations suggest significant material softening after brittle deformation of the compe-tent layer, (iii) the presence of a thick neck suggests very strong material softening after the initial brittle deformation, (iv) the ratio of neck width to swell width can be compared with the three stages of pinch and swell structure development (Fig. 5a) and a general idea of the relative layer viscosities can be deduced. However, for a more accurate 20
determination, both Newtonian vs. non-Newtonian flow and stretch should be indepen-dently validated by complementary methods (e.g. strain markers and microstructures). In the following, we show the applicability of our model result to nature by compar-ison with the field data from the pinch and swell structures observed on the St. Anne Point rock platform. Our model suggests brittle failure of at least the competent layer 25
is required for the St. Anne Point pinch and swell structures to form. The natural pinch and swell structures show both stage 2 development withRW<0.4 (Fig. 1c) and stage
SED
7, 1517–1554, 2015Pinch and swell structures
R. Gardner et al.
Title Page
Abstract Introduction
Conclusions References
Tables Figures
◭ ◮
◭ ◮
Back Close
Full Screen / Esc
Printer-friendly Version Interactive Discussion
Discussion
P
a
per
|
Discussion
P
a
per
|
Discussion
P
a
per
|
Discussion
P
a
per
|
can be seen in Fig. 1c, similar to that seen in the models where fracturing was domi-nated by one direction (Figs. 4a and 5b). This and the presence of both stage 2 and 3 development suggest strain localisation was spread unevenly across the rock platform. Thin section analysis showed the St. Anne Point samples display non-Newtonian flow. Therefore, comparison of model results (Fig. 5a) and nature (Fig. 1a and b) pre-5
dicts a high viscosity ratio (RV>125) between the mafic pinch and swell layer and the
surrounding paragneiss. At the same time, the St. Anne Point pinch and swell chain (Fig. 1a and b) has good separation of swell structures with attenuated necks (Fig. 1a and b black arrows) and shows locally, a thick neck (Fig. 1b black arrow). Accordingly, a high degree of softening i.e. largerRCo value (Fig. 6a, black arrow) is expected for 10
these rocks.
6.4 Implications of the presence of brittle-viscous behaviour in the middle to lower continental crust
Pinch and swell structures are commonly observed from amphibolite facies terranes (e.g. Goscombe et al., 2004; Hobbs et al., 2010; van der Molen, 1985), supporting the 15
interpretation that middle to lower crustal rocks are heterogeneous in terms of both viscous flow properties and brittle vs. ductile behaviour. This is consistent with the growing evidence that the flow behaviour of middle to lower continental crust should not be considered as exclusively viscous (e.g. Mancktelow, 2006).
Our crustal scale numerical model (Fig. 7) suggests large scale structures associ-20
ated with strain localization penetrating from the upper crust into the middle and lower crust can be explained by the presence of some rock units exhibiting brittle deformation in the middle and lower crust. If the middle to lower continental crust deforms by only viscous deformation (i.e. layers A′ and B′, Fig. 2d, are exclusively viscous), all layers except the brittle surface crust (layer C), are ductile and there is no significant locali-25
SED
7, 1517–1554, 2015Pinch and swell structures
R. Gardner et al.
Title Page
Abstract Introduction
Conclusions References
Tables Figures
◭ ◮
◭ ◮
Back Close
Full Screen / Esc
Printer-friendly Version Interactive Discussion
Discussion
P
a
per
|
Discussion
P
a
per
|
Discussion
P
a
per
|
Discussion
P
a
per
localisation zones to extend from the surface layer (Fig. 7 layer C) into the mid and lower crustal sections i.e. A′ and B′ layers. This continuous strain localization within the whole crustal section can, for example, explain geophysical data (e.g. Middleton et al., 1993) suggesting strain localization may indeed be continuous from upper to lower crustal levels. At the same time, such a pattern of strain localization will have 5
considerable impact on the pattern of near-surface structures (Fig. 7b). In summary, the pattern of strain localization is highly influenced by the presence or absence of brittle-viscous layers. Hence, surface features, fluid influx pathways and, therefore, ore genesis, are highly dependent on the heterogeneous nature of the middle and lower crust in terms of brittle-viscous vs. viscous behaviour.
10
The fact that pinch and swell structures are commonly observed at all crustal levels (Arslan et al., 2008; Goscombe et al., 2004; Hobbs et al., 2010; Kenis et al., 2004; Ponce et al., 2013; van der Molen, 1985) suggests that it is necessary to include brittle-viscous behaviour in both small- and crustal-scale models of deformation within the Earth’s crust.
15
7 Conclusion
Our numerical model, using brittle, mode II deformation to initiate pinch and swell struc-tures followed by viscous flow indicates: (i) these strucstruc-tures can form in either Newto-nian or non-NewtoNewto-nian flow contrary to previous conclusions where only viscous flow was used, (ii) higher viscosity ratios are required for pinch and swell formation in non-20
Newtonian regimes, (iii) material softening in the competent layer is needed for their development; and (iv) the matrix stress exponent and brittle behaviour have little influ-ence on pinch and swell formation itself.
We suggest that measuring planar bedding rotation, neck to swell thickness ratio (RW) and tortuosity on a pinch and swell structure can provide important insights into
25
SED
7, 1517–1554, 2015Pinch and swell structures
R. Gardner et al.
Title Page
Abstract Introduction
Conclusions References
Tables Figures
◭ ◮
◭ ◮
Back Close
Full Screen / Esc
Printer-friendly Version Interactive Discussion
Discussion
P
a
per
|
Discussion
P
a
per
|
Discussion
P
a
per
|
Discussion
P
a
per
|
Incorporation of brittle-viscous behaviour in some rock units at middle to lower crustal levels (i) has a significant impact on the pattern of strain localisation throughout the continental crust and the development of near surface structures and (ii) can explain the development of crustal scale structures observed in nature. Consequently, we suggest that the inclusion of Mohr Coulomb brittle fracturing and viscous flow is necessary 5
when developing crustal scale numerical models.
The Supplement related to this article is available online at doi:10.5194/sed-7-1517-2015-supplement.
Acknowledgements. Logistical and analytical funding was provided by an MQRes scholarship (RG), Discovery Project (DP120102060 to SP and NRD), Future Fellowship (FT1101100070
10
to SP) and internal funding from the Department of Earth and Planetary Sciences, Macquarie University. Code development in Underworld was supported by the Victorian Partnership for Advanced Computing and Monash University (Moresi et al., 2003, 2007). We thank the De-partment of Conservation in Te Anau for permission to visit and sample localities within St. Anne Point, Fiordland National Park and David Keith of the School of Environment and Rural
15
Science, University of New England for thin section preparation. The authors would also like to thank two anonymous reviewers for their careful and constructive reviews, and N. Mancktelow for editorial handling.
References
Abe, S. and Urai, J. L.: Discrete element modeling of boudinage: insights on rock
rhe-20
ology, matrix flow, and evolution of geometry, J. Geophys. Res.-Sol. Ea., 117, B01407, doi:10.1029/2011jb008555, 2012.
Arslan, A., Passchier, C. W., and Koehn, D.: Foliation boudinage, J. Struct. Geol., 30, 291–309, doi:10.1016/j.jsg.2007.11.004, 2008.
Bestmann, M. and Prior, D. J.: Intragranular dynamic recrystallization in naturally deformed
25
rota-SED
7, 1517–1554, 2015Pinch and swell structures
R. Gardner et al.
Title Page
Abstract Introduction
Conclusions References
Tables Figures
◭ ◮
◭ ◮
Back Close
Full Screen / Esc
Printer-friendly Version Interactive Discussion
Discussion
P
a
per
|
Discussion
P
a
per
|
Discussion
P
a
per
|
Discussion
P
a
per
tion recrystallization, J. Struct. Geol., 25, 1597–1613, doi:10.1016/S0191-8141(03)00006-3, 2003.
Brander, L., Svahnberg, H., and Piazolo, S.: Brittle-plastic deformation in initially dry rocks at fluid-present conditions: transient behaviour of feldspar at mid-crustal levels, Contrib. Min-eral. Petr., 163, 403–425, doi:10.1007/s00410-011-0677-5, 2012.
5
Brodie, K. H. and Rutter, E. H.: On the Relationship between Deformation and Metamorphism, with Special Reference to the Behavior of Basic Rocks, in: Metamorphic Reactions, Ad-vances in Physical Geochemistry, edited by: Thompson, A. and Rubie, D.,Springer-Verlag, Berlin, Heidelberg, New York, Tokyo, 138–179, 1985.
Brodie, K. H. and Rutter, E. H.: Deep crustal extensional faulting in the Ivrea Zone of Northern
10
Italy, Tectonophysics, 140, 193–212, doi:10.1016/0040-1951(87)90229-0, 1987.
de Ronde, A. A., Stünitz, H., Tullis, J., and Heilbronner, R.: Reaction-induced
weakening of plagioclase-olivine composites, Tectonophysics, 409, 85–106,
doi:10.1016/j.tecto.2005.08.008, 2005.
Emerman, S. H. and Turcotte, D. L.: A back-of-the-envelope approach to boudinage mechanics,
15
Tectonophysics, 110, 333–338, doi:10.1016/0040-1951(84)90267-1, 1984.
Fliervoet, T. F., White, S. H., and Drury, M. R.: Evidence for dominant grain-boundary sliding de-formation in greenschist- and amphibolite-grade polymineralic ultramylonites from the Red-bank Deformed Zone, Central Australia, J. Struct. Geol., 19, 1495–1520, doi:10.1016/S0191-8141(97)00076-X, 1997.
20
Fusseis, F., Handy, M. R., and Schrank, C.: Networking of shear zones at the brittle-to-viscous transition (Cap de Creus, NE Spain), J. Struct. Geol., 28, 1228–1243, doi:10.1016/j.jsg.2006.03.022, 2006.
Goldstein, A. G.: Factors affecting the kinematic interpretation of asymmetric boudinage in shear zones, J. Struct. Geol., 10, 707–715, doi:10.1016/0191-8141(88)90078-8, 1988.
25
Goscombe, B. D., Passchier, C. W., and Hand, M.: Boudinage classification: end-member boudin types and modified boudin structures, J. Struct. Geol., 26, 739–763, doi:10.1016/j.jsg.2003.08.015, 2004.
Griggs, D. and Handin, J.: Observations on fracture and a hypothesis of earthquakes, Geol. Soc. Am. Mem., 79, 347–364, 1960.
30
SED
7, 1517–1554, 2015Pinch and swell structures
R. Gardner et al.
Title Page
Abstract Introduction
Conclusions References
Tables Figures
◭ ◮
◭ ◮
Back Close
Full Screen / Esc
Printer-friendly Version Interactive Discussion
Discussion
P
a
per
|
Discussion
P
a
per
|
Discussion
P
a
per
|
Discussion
P
a
per
|
Herwegh, M., Linckens, J., Ebert, A., Berger, A., and Brodhag, S. H.: The role of second phases for controlling microstructural evolution in polymineralic rocks: a review, J. Struct. Geol., 33, 1728–1750, doi:10.1016/j.jsg.2011.08.011, 2011.
Hetényi, G., Godard, V., Cattin, R., and Connolly, J. A. D.: Incorporating metamorphism in geodynamic models: the mass conservation problem, Geophys. J. Int., 186, 6–10,
5
doi:10.1111/j.1365-246X.2011.05052.x, 2011.
Hirth, G. and Kohlstedt, D.: Rheology of the Upper Mantle and the mantle wedge: a view from the experimentalists, in: Inside the Subduction Factory, American Geophysical Union, 83– 105, 2003.
Hobbs, B. E., Regenauer-Lieb, K., and Ord, A.: Folding with thermal-mechanical feedback:
10
a reply, J. Struct. Geol., 31, 752–755, doi:10.1016/j.jsg.2009.03.014, 2009.
Hobbs, B. E., Ord, A., Spalla, M. I., Gosso, G., and Zucali, M.: The interaction of de-formation and metamorphic reactions, London, Geol. Soc. Spec. Publ., 332, 189–223, doi:10.1144/sp332.12, 2010.
Holyoke Iii, C. W. and Tullis, J.: Mechanisms of weak phase interconnection and the
ef-15
fects of phase strength contrast on fabric development, J. Struct. Geol., 28, 621–640, doi:10.1016/j.jsg.2006.01.008, 2006.
Kenis, I., Urai, J. L., van der Zee, W., and Sintubin, M.: Mullions in the High-Ardenne Slate Belt (Belgium): numerical model and parameter sensitivity analysis, J. Struct. Geol., 26, 1677– 1692, doi:10.1016/j.jsg.2004.02.001, 2004.
20
Klepeis, K. A., Daczko, N. R., and Clarke, G. L.: Kinematic vorticity and tectonic significance of superposed mylonites in a major lower crustal shear zone, northern Fiordland, New Zealand, J. Struct. Geol., 21, 1385–1405, doi:10.1016/S0191-8141(99)00091-7, 1999.
Kobberger, G. and Zulauf, G.: Experimental folding and boudinage under pure constrictional conditions, J. Struct. Geol., 17, 1055–1063, doi:10.1016/0191-8141(94)00130-R, 1995.
25
Koehn, D., Arnold, J., and Passchier, C. W.: Fracture and vein patterns as indicators of de-formation history: a numerical study, Geological Society, London, Special Publications, 243, 11–24, 2005.
Komoróczi, A., Abe, S., and Urai, J.: Meshless numerical modeling of brittle-viscous defor-mation: first results on boudinage and hydrofracturing using a coupling of discrete element
30
SED
7, 1517–1554, 2015Pinch and swell structures
R. Gardner et al.
Title Page
Abstract Introduction
Conclusions References
Tables Figures
◭ ◮
◭ ◮
Back Close
Full Screen / Esc
Printer-friendly Version Interactive Discussion
Discussion
P
a
per
|
Discussion
P
a
per
|
Discussion
P
a
per
|
Discussion
P
a
per
Krabbendam, M., Urai, J. L., and van Vliet, L. J.: Grain size stabilisation by dispersed graphite in a high-grade quartz mylonite: an example from Naxos (Greece), J. Struct. Geol., 25, 855– 866, doi:10.1016/S0191-8141(02)00086-X, 2003.
Kruse, R. and Stünitz, H.: Deformation mechanisms and phase distribution in mafic high-temperature mylonites from the Jotun Nappe, southern Norway, Tectonophysics, 303, 223–
5
249, doi:10.1016/S0040-1951(98)00255-8, 1999.
Lohest, M., Stainier, X., and Fourmarier, P.: Compte rendu de la session extraordinaire de la Société géologique de Belgique, tenue à Eupen et Bastogne les 29, 30 et 31 août et le 1,2 et 3 Septembre 1908, Annales de la Société géologique de Belgique, 36, 275–282, 1908. Mancktelow, N. S.: How ductile are ductile shear zones?, Geology, 34, 345–348,
10
doi:10.1130/g22260.1, 2006.
Mancktelow, N. S. and Pennacchioni, G.: The control of precursor brittle fracture and fluid–rock interaction on the development of single and paired ductile shear zones, J. Struct. Geol., 27, 645–661, doi:10.1016/j.jsg.2004.12.001, 2005.
Marques, F. O., Fonseca, P. D., Lechmann, S., Burg, J.-P., Marques, A. S., Andrade, A. J. M.,
15
and Alves, C.: Boudinage in nature and experiment, Tectonophysics, 526–529, 88–96, doi:10.1016/j.tecto.2011.08.017, 2012.
Mengong, M. E. and Zulauf, G.: Coeval folding and boudinage under plane strain with the axis of no change perpendicular to the layer, Int. J. Earth Sci., 95, 178–188, doi:10.1007/s00531-005-0032-z, 2006.
20
Meyers, M. A.: Dynamic Behavior of Materials, Wiley, New York, 668 pp., 1994.
Middleton, M., Wilde, S., Evans, B., Long, A., and Dentith, M.: A preliminary interpretation of deep seismic reflection and other geophysical data from the Darling Fault Zone, Western Australia, Explor. Geophys., 24, 711–718, 1993.
Molnar, P. and Houseman, G. A.: The effects of buoyant crust on the gravitational instability of
25
thickened mantle lithosphere at zones of intracontinental convergence, Geophys. J. Int., 158, 1134–1150, doi:10.1111/j.1365-246X.2004.02312.x, 2004.
Moresi, L. and Mühlhaus, H. B.: Anisotropic viscous models of large-deformation Mohr– Coulomb failure, Philos. Mag., 86, 3287–3305, doi:10.1080/14786430500255419, 2006. Moresi, L., Dufour, F., and Mühlhaus, H. B.: A. Lagrangian integration point finite element
30
SED
7, 1517–1554, 2015Pinch and swell structures
R. Gardner et al.
Title Page
Abstract Introduction
Conclusions References
Tables Figures
◭ ◮
◭ ◮
Back Close
Full Screen / Esc
Printer-friendly Version Interactive Discussion
Discussion
P
a
per
|
Discussion
P
a
per
|
Discussion
P
a
per
|
Discussion
P
a
per
|
Moresi, L., Quenette, S., Lemiale, V., Mériaux, C., Appelbe, B., and Mühlhaus, H. B.: Compu-tational approaches to studying non-linear dynamics of the crust and mantle, Phys. Earth Planet. In., 163, 69–82, doi:10.1016/j.pepi.2007.06.009, 2007.
Neurath, C. and Smith, R. B.: The effect of material properties on growth rates of folding and boudinage: experiments with wax models, J. Struct. Geol., 4, 215–229,
doi:10.1016/0191-5
8141(82)90028-1, 1982.
Newman, J., Lamb, W. M., Drury, M. R., and Vissers, R. L. M.: Deformation processes in a peri-dotite shear zone: reaction-softening by an H2O-deficient, continuous net transfer reaction, Tectonophysics, 303, 193–222, doi:10.1016/S0040-1951(98)00259-5, 1999.
Passchier, C. W. and Trouw, R. A. J.: Microtectonics, Springer-Verlag, Berlin, 289 pp., 2005.
10
Passchier, C. W., Mancktelow, N. S., and Grasemann, B.: Flow perturbations: a tool to study and characterize heterogeneous deformation, J. Struct. Geol., 27, 1011–1026, doi:10.1016/j.jsg.2005.01.016, 2005.
Piazolo, S. and Jaconelli, P.: Sillimanite deformation mechanisms within a Grt-Sil-Bt gneiss: ef-fect of pre-deformation grain orientations and characteristics on mechanism, slip-system
ac-15
tivation and rheology, London, Geol. Soc. Spec. Publ., 394, 189–213, doi:10.1144/sp394.10, 2014.
Pollard, D. and Segall, P.: Theoretical displacements and stresses near fractures in rock: with applications to faults, joints, veins, dikes, and solution surfaces, in: Fracture Mechanics of Rock, edited by: Atkinson, B., Academic Press, London, 277–349, 1987.
20
Ponce, C., Druguet, E., and Carreras, J.: Development of shear zone-related lozenges in foli-ated rocks, J. Struct. Geol., 50, 176–186, doi:10.1016/j.jsg.2012.04.001, 2013.
Ramsay, A.: The geology of North Wales, Memoirs of the Geological Survey of Great Britain, London, UK, 3, 1866.
Ramsay, J. G.: Shear zone geometry: a review, J. Struct. Geol., 2, 83–99,
doi:10.1016/0191-25
8141(80)90038-3, 1980.
Ranalli, G.: Rheology of the lithosphere in space and time, London, Geol. Soc. Spec. Publ., 121, 19–37, doi:10.1144/gsl.sp.1997.121.01.02, 1997.
Rubie, D.: Role of kinetics in the formation and preservation of eclogites, in: Eclogite Facies Rocks, edited by: Carswell, D., Blackie, Glasgow, 111–140, 1990.
30
SED
7, 1517–1554, 2015Pinch and swell structures
R. Gardner et al.
Title Page
Abstract Introduction
Conclusions References
Tables Figures
◭ ◮
◭ ◮
Back Close
Full Screen / Esc
Printer-friendly Version Interactive Discussion
Discussion
P
a
per
|
Discussion
P
a
per
|
Discussion
P
a
per
|
Discussion
P
a
per
Rudnick, R. and Gao, S.: Composition of the continental crust, Treatise on geochemistry, 3, 1–64, 2003.
Rybacki, E. and Dresen, G.: Deformation mechanism maps for feldspar rocks, Tectonophysics, 382, 173–187, 2004.
Schmalholz, S. M. and Maeder, X.: Pinch-and-swell structure and shear zones in viscoplastic
5
layers, J. Struct. Geol., 37, 75–88, doi:10.1016/j.jsg.2012.01.026, 2012.
Scholz, C. H.: The mechanics of earthquakes and faulting, 2nd ed., Cambridge University Press, Cambridge, 473 pp., 2002.
Segall, P. and Simpson, C.: Nucleation of ductile shear zones on dilatant fractures, Geology, 14, 56–59, doi:10.1130/0091-7613(1986)14<56:nodszo>2.0.co;2, 1986.
10
Simpson, C.: Deformation of granitic rocks across the brittle-ductile transition, J. Struct. Geol., 7, 503–511, doi:10.1016/0191-8141(85)90023-9, 1985.
Smith, J., Piazolo, S., Daczko, N., and Evans, L.: The effect of pre-tectonic reaction and anneal-ing extent on behaviour duranneal-ing subsequent deformation: insights from paired shear zones in the lower crust of Fiordland, New Zealand, J. Metamorph. Geol., doi:10.1111/jmg.12132,
15
online first, 2015.
Smith, R. B.: Unified theory of the onset of folding, boudinage, and mullion structure, Geol. Soc. Am. Bull., 86, 1601–1609, doi:10.1130/0016-7606(1975)86<1601:utotoo>2.0.co;2, 1975. Smith, R. B.: Formation of folds, boudinage, and mullions in non-Newtonian materials, Geol.
Soc. Am. Bull., 88, 312–320, doi:10.1130/0016-7606(1977)88<312:fofbam>2.0.co;2, 1977.
20
St-Onge, M. R., Van Gool, J. A. M., Garde, A. A., and Scott, D. J.: Correlation of Archaean and Palaeoproterozoic units between northeastern Canada and western Greenland: constraining the pre-collisional upper plate accretionary history of the Trans-Hudson orogen, London, Geol. Soc. Spec. Publ., 318, 193–235, doi:10.1144/sp318.7, 2009.
Stipp, M., Stünitz, H., Heilbronner, R., and Schmid, S. M.: The eastern Tonale fault zone: a
25
“natural laboratory” for crystal plastic deformation of quartz over a temperature range from 250 to 700, J. Struct. Geol., 24, 1861–1884, doi:10.1016/S0191-8141(02)00035-4, 2002. Stünitz, H., and Tullis, J.: Weakening and strain localization produced by syn-deformational
reaction of plagioclase, Int. J. Earth Sci., 90, 136–148, doi:10.1007/s005310000148, 2001. Taylor, S. R. and McLennan, S. M.: The Continental Crust: its Composition and Evolution,
30
Medium: X, Blackwell Scientific, Palo Alto, CA, USA, 328 pp., 1985.