Submitted25 May 2016
Accepted 27 September 2016
Published27 October 2016
Corresponding author
Alice C. McHardy,
[email protected], [email protected]
Academic editor
Elena Papaleo
Additional Information and Declarations can be found on page 18
DOI10.7717/peerj.2619
Copyright
2016 Kloetgen et al.
Distributed under
Creative Commons CC-BY 4.0
OPEN ACCESS
The PARA-suite: PAR-CLIP specific
sequence read simulation and processing
Andreas Kloetgen1,2,3, Arndt Borkhardt2, Jessica I. Hoell2,* and Alice C. McHardy1,3,*
1Department for Algorithmic Bioinformatics, Heinrich-Heine Universität Düsseldorf, Düsseldorf, Germany 2Department of Pediatric Oncology, Hematology and Clinical Immunology, Medical Faculty, Heinrich-Heine
Universität Düsseldorf, Düsseldorf, Germany
3Computational Biology of Infection Research, Helmholtz Center for Infection Research, Braunschweig, Germany
*These authors contributed equally to this work.
ABSTRACT
Background. Next-generation sequencing technologies have profoundly impacted biology over recent years. Experimental protocols, such as photoactivatable ribonucleoside-enhanced cross-linking and immunoprecipitation (PAR-CLIP), which identifies protein–RNA interactions on a genome-wide scale, commonly employ deep sequencing. With PAR-CLIP, the incorporation of photoactivatable nucleosides into nascent transcripts leads to high rates of specific nucleotide conversions during reverse transcription. So far, the specific properties of PAR-CLIP-derived sequencing reads have not been assessed in depth.
Methods. We here compared PAR-CLIP sequencing reads to regular transcriptome sequencing reads (RNA-Seq) to identify distinctive properties that are relevant for reference-based read alignment of PAR-CLIP datasets. We developed a set of freely available tools for PAR-CLIP data analysis, called the PAR-CLIP analyzer suite (PARA-suite). The PARA-suite includes error model inference, PAR-CLIP read simulation based on PAR-CLIP specific properties, a full read alignment pipeline with a modified Burrows–Wheeler Aligner algorithm and CLIP read clustering for binding site detec-tion.
Results. We show that differences in the error profiles of PAR-CLIP reads relative to regular transcriptome sequencing reads (RNA-Seq) make a distinct processing advantageous. We examine the alignment accuracy of commonly applied read aligners on 10 simulated PAR-CLIP datasets using different parameter settings and identified the most accurate setup among those read aligners. We demonstrate the performance of the PARA-suite in conjunction with different binding site detection algorithms on several real PAR-CLIP and HITS-CLIP datasets. Our processing pipeline allowed the improvement of both alignment and binding site detection accuracy.
Availability. The PARA-suite toolkit and the PARA-suite aligner are available at
https://github.com/akloetgen/PARA-suite and
https://github.com/akloetgen/PARA-suite_aligner, respectively, under the GNU GPLv3 license.
SubjectsBioinformatics, Computational Biology
BACKGROUND
RNAs play a crucial role in cell survival and viability. Coding messenger RNAs (mRNAs), which are translated into proteins, and many other RNA species, such as small and long non-coding RNAs, ribosomal RNAs and transfer RNAs, are essential for the survival and proper functioning of the cells (Eddy, 2001). Most RNAs maintain their function by working together with the so-called RNA-binding proteins (RBPs) (Glisovic et al., 2008). RBPs are involved in virtually all steps of the mRNA lifecycle, from polyadenylation, translocation and modification to translation (Hieronymus & Silver, 2004). Thus, it is not surprising that many RBPs that show aberrant functions or changes in expression patterns have been associated with disease progression or even with carcinogenesis (Lukong et al., 2008). For instance, theFET protein family, which consists of the three RBPsFUS,
EWSR1andTAF15, is ubiquitously expressed and widely conserved in mammals. Genomic rearrangements, leading to mutant forms of these RBPs in humans, have been described as key players in sarcomas and leukemia (Tan & Manley, 2009). More recently, two mutants ofFUScausing amyotrophic lateral sclerosis have shown different RNA-binding patterns compared to their wild-type counterparts, supporting the importance of the function of
FUSin mRNA processing (Hoell et al., 2011).
conversions do not seem to occur at a significant frequency (Zhang & Darnell, 2011; Sugimoto et al., 2012).
Current sequencing platforms allow for the sequencing of mammalian transcriptome libraries with high coverage. Nowadays, the most commonly used next-generation sequencing (NGS) platforms are 454, Illumina, IonTorrent and PacBio (Van Dijk et al., 2014). Depending on the sequencing platform and the sample type, sequencing errors vary in type and frequency. The errors that most commonly occur are substitution errors and indels of a few bases between the sequencing read and the reference sequence (large rearrangements, such as those leading to chimeras, are also possible errors but are not discussed here) (Laehnemann, Borkhardt & McHardy, 2015). In an RNA-Seq dataset, a single transcript will be covered by sequencing reads in all its expressed coding exons (apart from, for example, amplification errors or alternative splicing variants). For common sequencing data types, such as RNA-Seq and DNA-Seq, designated read aligners have recently been developed. These include short read aligners, such as BWA (Li & Durbin, 2009) or Bowtie (Langmead et al., 2009), and read aligners such as TopHat (Trapnell, Pachter & Salzberg, 2009), STAR (Dobin et al., 2013) or Subjunc (Liao, Smyth & Shi, 2013), which can also handle longer sequencing reads spanning exon–exon junctions. Specific software for the evaluation and analysis of the PAR- and HITS-CLIP sequencing data is needed to accommodate their unique error profiles (Kloetgen et al., 2015). For instance, the read aligner BWA PSSM (Kerpedjiev et al., 2014) makes use of a pre-defined position-specific scoring matrix to process the error-prone PAR-CLIP reads.
In general, the sequencing error profiles of RNA-Seq datasets, including PAR-CLIP data, can vary between different sequencing runs, depending on the sequencing machine, the experimental conditions and the biological properties of the sample (Laehnemann, Borkhardt & McHardy, 2015;Schirmer et al., 2015). Here, we describe the PAR-CLIP analyzer suite (PARA-suite), which includes a PAR-CLIP read simulator, an error estimation tool for CLIP datasets and an alignment pipeline based on a novel alignment algorithm performing on-the-fly dataset-specific error estimation. The alignment pipeline thus automatically adjusts to the quality and error profiles of individual sequencing datasets. We compare PAR-CLIP sequencing reads to regular transcriptome sequencing reads (RNA-Seq) to identify the distinctive properties that are relevant for reference-based read alignment and RBP binding site detection from PAR-CLIP datasets. Generation of simulated PAR-CLIP datasets can be performed with the PARA-suite’s read simulator. The PARA-suite toolkit is available at https://github.com/akloetgen/PARA-suite and
https://github.com/akloetgen/PARA-suite_aligner, implemented as an extension of BWA
(henceforth referred to as BWA PARA). It is licensed under GNU GPLv3, and can be implemented in the programming languages Java and C.
METHODS
Datasets and read aligners
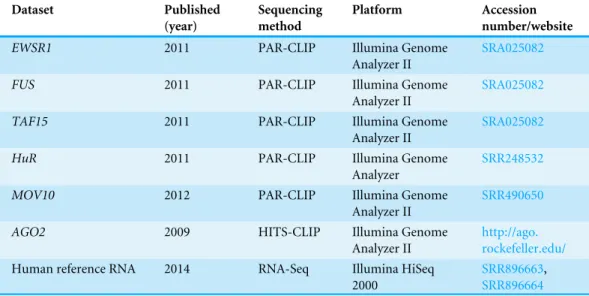
Table 1 Overview of the analyzed RNA-Seq and CLIP datasets.
Dataset Published
(year)
Sequencing method
Platform Accession
number/website
EWSR1 2011 PAR-CLIP Illumina Genome
Analyzer II
SRA025082
FUS 2011 PAR-CLIP Illumina Genome
Analyzer II
SRA025082
TAF15 2011 PAR-CLIP Illumina Genome
Analyzer II
SRA025082
HuR 2011 PAR-CLIP Illumina Genome
Analyzer
SRR248532
MOV10 2012 PAR-CLIP Illumina Genome
Analyzer II
SRR490650
AGO2 2009 HITS-CLIP Illumina Genome
Analyzer II
http://ago. rockefeller.edu/ Human reference RNA 2014 RNA-Seq Illumina HiSeq
2000
SRR896663, SRR896664
SRA025082(Hoell et al., 2011), theHuRdataset with the accession numberSRR248532,
theMOV10dataset with the accession numberSRR490650and the HITS-CLIP data on the Argonaute2 protein (AGO2) (Chi et al., 2009) fromhttp://ago.rockefeller.edu/. For estimating the error profiles of regular RNA-Seq runs, we downloaded two sequencing lanes from an NGS quality assessment study with the accession numbersSRR896663and
SRR896664(SEQC/MAQC-III-Consortium, 2014) from DRASearch and pooled the data.
An overview of the analyzed datasets can be found inTable 1.
We used the following read aligners and versions, shown in alphabetic order: Bowtie, version 0.12.7 (Langmead et al., 2009), Bowtie2, version 2.2.3 (Langmead & Salzberg, 2012), BWA, version 0.7.8 (Li & Durbin, 2009), BWA PSSM, initial release version (Kerpedjiev et al., 2014), MOSAIK, version 2.2.3 (Lee et al., 2014), STAR, version 2.3.0 (Dobin et al., 2013), Subjunc, version 1.4.2 (Liao, Smyth & Shi, 2013) and TopHat, version 2.0.13 (Trapnell, Pachter & Salzberg, 2009).
PAR-CLIP read simulator and hierarchical clustering
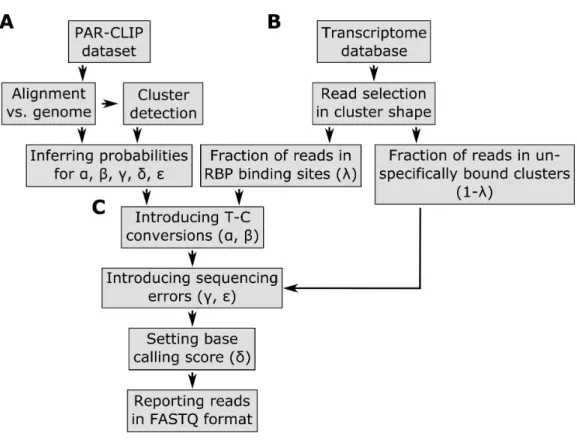
Figure 1 Pipeline of the PAR-CLIP read simulator implemented in the PARA-suite.Part A describes the process of generating the error profile and other parameters learned from a real PAR-CLIP dataset. Part B starts to generate reads mapping to RBP binding sites (clusters) on transcript regions from a given transcript database (e.g., Ensembl genes). In Part C, the pre-calculated profiles are used to introduce T–C conversions, sequencing errors, indels and base-calling quality scores to the defined reads.
Based on these alignments, the sequencing error profileεis estimated from the observed frequencies of all single nucleotide substitutions, except for T–C errors, as these include PAR-CLIP specific T–C conversions. Standard T–C sequencing errors are approximated by the average over all the other sequencing error frequencies. The probability vectors 00B5 andδ are also inferred from these alignments. Next, all aligned reads of the real dataset are clustered (stacked) using single-linkage hierarchical clustering based on their genomic mapping positions, using a 5-base overlap of the genomic mapping positions as the clustering threshold. To identify high confidence clusters (sometimes referred to as binding sites) as defined in the literature (Hafner et al., 2010), clusters that contain less than 10 reads, less than 25% T–C conversions per cluster, are longer than 75 bases and include only T–C conversion sites that are reported as single nucleotide polymorphism loci in the dbSNP database (version 142) (Sherry et al., 2001) are discarded. This implementation of hierarchical clustering is part of the PARA-suite and will later be used for binding site detection. For the subsequent simulation, the positions and frequencies of highly mutated T–C sites within reads are determined to estimate α andβ from the high confidence clusters (Figs. S1A–S1B).
(the number of clusters is randomly chosen from a uniform distribution) containing several reads are created for a selected transcript sequence. The starting positions of the clusters are randomly selected from a uniform distribution within the entire range of a transcript. The number of reads simulated for a single cluster is drawn from a normal distribution with a mean of 16 and a standard deviation of 10. This enables the simulation of a wide range of read coverages throughout the clusters. Furthermore, small shifts of the start and end site of each read leading to distinctive alignment position shifts in the shape of a cluster are randomly introduced at this step (normal distribution, standard deviation=1). A user-defined parameterλ∈[0,1] specifies the fraction of clusters that are considered to be binding-sites, whereas the remaining clusters mimic contaminations of unbound RNAs that occur in all PAR-CLIP experiments. We recommend values in the range of 0.5–0.7 (50–70%), as we observed this range of aligned sequencing reads stacking into clusters after hierarchical clustering and filtering (Table S1; similar values were previously reported byAscano et al. (2012a)). If more than one T–C site is simulated for a single cluster, a major T–C conversion site is selected according to the site-specific T–C conversion profileβ and T–C conversion probabilities are drawn fromα. Subsequently, background sequencing errors are introduced on the basis of the pre-computed probability matrixεand the frequency vectorµfor substitutions and indels, respectively. In the last step, every base receives a base-calling quality score, as specified by the position-specific quality score distributionδ. All generated reads are stored in the universal FASTQ format (Cock et al., 2010). The PAR-CLIP read simulator is available through the PARA-suite.
The PARA-suite: tools for error profile inference, read simulation, multiple database mapping and more
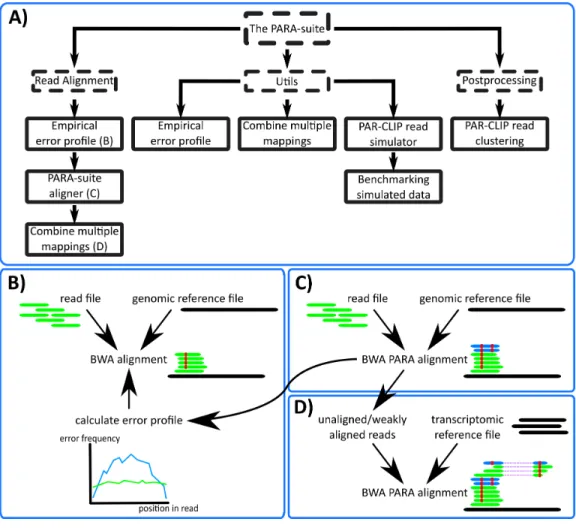
Figure 2 The PARA-suite.(A) The PARA-suite. Dashed boxes represent software packages; all other boxes represent executable programs. The Utils package includes tools for working with error-prone se-quencing data and the postprocessing package contains a tool for clustering an aligned PAR-CLIP dataset to identify RBP-bound genomic regions. (B) Read alignment by a fast read aligner is necessary to infer the error profile for a particular read dataset (we selected BWA). (C) BWA PARA is applied to the entire dataset to map error-prone reads, indicated here by the additional mapping of the two reads (shown in blue). (D) An optional alignment versus a transcriptome reference database can be executed using BWA PARA to identify previously unmapped reads.
be aligned with BWA PARA (‘Algorithm of the PARA-suite aligner BWA PARA’) against the reference sequence(s). All aligned reads are reported in a BAM file.
Algorithm of the PARA-suite aligner BWA PARA
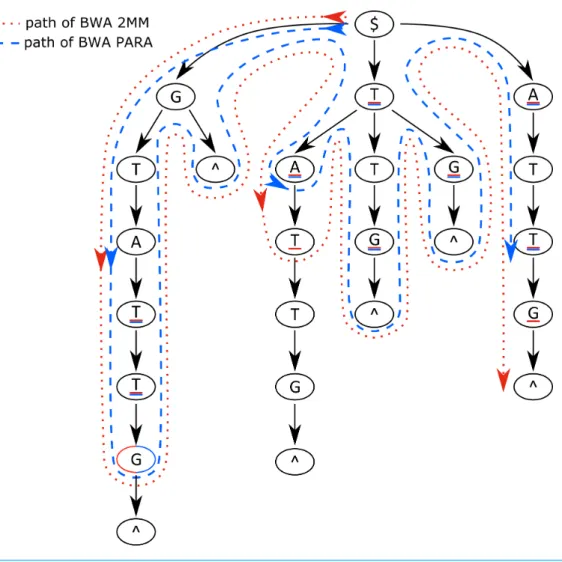
Figure 3 Suffix trie paths for the BWA and PARA-suite.Paths of the algorithms through the suffix trie aligning the read sequence GCCATG$ against the reference sequence GTTATG$ (where $ means the end of a sequence). The red dotted line represents the algorithm of the BWA aligner, allowing for two mis-matches; the blue dashed line indicates the BWA PARA algorithm. The underlined bases represent posi-tions where the respective aligner introduces a mismatch. The example shows that BWA PARA needs 14 comparisons but the basic BWA needs 16 comparisons. Indels are not shown for simplicity.
a pre-defined threshold of maximal mismatches is exceeded in a single path (Fig. 3, red dotted line).
The principal idea of BWA PARA is the introduction of a probability estimate for each comparison of the backward search. This enables mismatches to be weighted according to their probabilities that they occur in the analyzed dataset. A sequencing run is initially characterized according to its underlying error probabilities. This allows us to determine specific error-profiles for experimental techniques, such as the frequent T–C conversions in PAR-CLIP data, which are more common than sequencing errors. The error profile
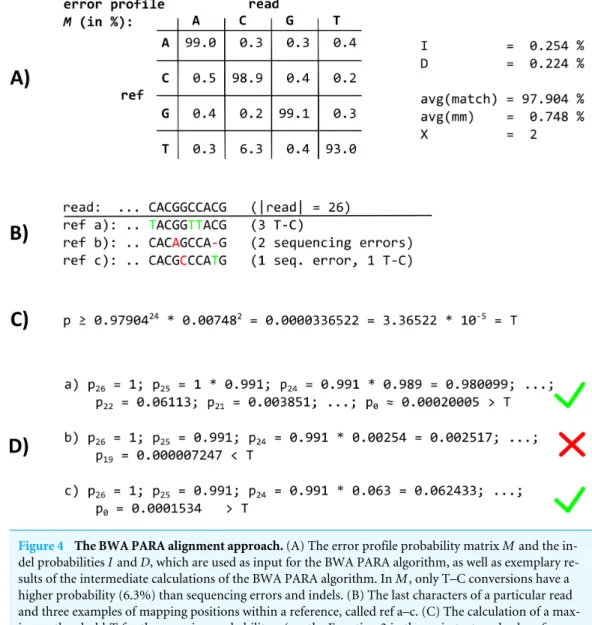
Figure 4 The BWA PARA alignment approach.(A) The error profile probability matrixMand the in-del probabilitiesIandD, which are used as input for the BWA PARA algorithm, as well as exemplary re-sults of the intermediate calculations of the BWA PARA algorithm. InM, only T–C conversions have a higher probability (6.3%) than sequencing errors and indels. (B) The last characters of a particular read and three examples of mapping positions within a reference, called ref a–c. (C) The calculation of a max-imum thresholdTfor the mapping probabilityp(see the Equation 2 in the main text, and values from (A) in this image). (D) The mapping probability calculation of the read when mapped to References a–c. The read fails to map against ref b with two sequencing errors, whereas ref a and ref c are suitable mapping positions, where the probabilitypis higher than the thresholdT. For implementation, we worked with the open-source read aligner BWA (version 0.7.8) to extend its algorithm for the alignment of short and error-prone reads.
For each comparison between a read base at read position i(read[i]) and a reference base at positionj(ref[j]) in the reference sequence, the algorithm recursively calculates a joint probability valuep, which is used to examine the chance of incorporating a matching base or a suitable error, including indels, at the respective read positions (Fig. 4D):
pi=
pi+1·D, if ref[j]is deleted
pi+1·I, if read[i]is inserted
withp|read|=1, starting withi= |read|–1 and decreasingiat each step, except in the case of a deletion (whereiis left unchanged), fori≥0.
Before the alignment of a particular read, a minimal thresholdT for the probabilitypis needed to decide whether a read is accepted as aligned or rejected. The calculation forT
depends on a parameterX for the average number of mismatches. Note that this is not a maximal threshold in terms of absolute mismatches, as the number of the more frequent errors per aligned read can exceedX. The parameterX can be pre-defined by the user or is by default estimated as the expected number of mismatches for different read lengths based on the error profileM for a sequencing run. Next, the minimal thresholdT is computed (Figs. 4Band4C):
T=avg(match)|read|−X·avg(mismatch)X,
where avg(match)= 15
h P
i∈{0..3}Mi,i+(1−(1+D))
i
and avg(mismatch)= 141
h P
i,j∈{0..3};i6=jMi,j+I+D
i
.
Bothavg(match) andavg(mismatch) are normalized by the number of elements (four matches plus one for no indel occurring, and 12 mismatches plus 2 for either a insertion or a deletion). Ifpfalls below the pre-calculated thresholdT during read alignment, the path within the suffix trie is assumed not to match the read and is rejected (Fig. 3, blue dashed line). The algorithm thus penalizes rare types of mismatches according to M, whereas frequent errors, such as T–C errors in PAR-CLIP reads, are the most favored substitutions in the alignment process (Figs. 4B–4D).
RESULTS
Properties of PAR-CLIP reads
To assess the most important properties of the PAR-CLIP sequencing reads for read alignment, we systematically compared PAR-CLIP datasets for the three RBPs EWSR1,
FUS andTAF15 (theFET protein family) (Hoell et al., 2011) to a recently published RNA-Seq run on human reference RNA (SEQC/MAQC-III-Consortium, 2014). The 10 outermost bases of the SEQC/MAQC reads showed error rates with peaks at 1.5 and 2.2 errors per 100 reads (EPR). In contrast, the middle read length range showed an average of about 0.3 EPR (Fig. S2A, red line). As the short reads of the FET PAR-CLIP datasets consisted only of these outermost bases, they exhibited a two- to threefold higher average sequencing error rate (about 0.7 EPR or even higher) than the SEQC/MAQC reads (Fig. S2B, green line). When considering the T–C conversions only, we observed 1.319 EPR for
EWSR1, 1.477 EPR forFUSand 1.051 EPR forTAF15on average. This is an approximately 20- to 30-fold increase in comparison to the SEQC/MAQC dataset with 0.051 EPR for T–C conversions on average (Fig. S2). Moreover, we analyzed data from two further PAR-CLIP studies performed on the RBPsHuR(Mukherjee et al., 2011) andMOV10 (Sievers et al., 2012), which showed similar error profiles and EPRs to the FET PAR-CLIPs for T–C conversions (Fig. S3).
Further analyses of the PAR-CLIP read datasets forEWSR1,FUS,TAF15,MOV10 and
stretches of an expressed gene rather than the entire expressed RNA (these stretches are henceforth called clusters), (c) to exhibit a specific nucleotide conversion pattern with a strong enrichment of T–C conversions, where (d) such conversions occur in specific ‘conversion sites’ in the clusters. The two properties (a) and (b) are determined by treating the cells with RNAse T1 or the lysate during the PAR-CLIP experimental protocol. As only short RNA fragments that are not digested by the endonuclease (these are probably protected by the binding pocket of the RBP) are sequenced, the lengths of those fragments are usually short. However, the nucleotide composition of those reads is strongly affected by the digestion enzyme and can vary among different digestion enzymes (Kishore et al., 2011). After quality trimming and adapter trimming of the five PAR-CLIP datasets, the average read lengths were 25.67 bases (EWSR1), 25.60 bases (FUS), 24.21 bases (TAF15), 25.20 bases (HuR) and 23.36 bases (MOV10). As the transcript regions outside the bound RNA fragment are digested by the endonuclease, these are removed during immunoprecipitation and not sequenced, except for additional binding sites on the same transcript further up-or downstream. Thus, the sequencing reads are stacked into shup-ort clusters covering shup-ort stretches of the gene and representing the RBP-bound regions of the transcripts (Fig. S4A).
The two properties (c) and (d) were determined by incorporating photoactivatable nucleosides into the nascent transcripts during transcription. In the case of 4-SU, T–C conversions occur in the sequencing reads at all cross-linked sites, where the 4-SU is incorporated instead of the native uridine. These conversions can reach high rates in specific conversion sites within a cluster (Hafner et al., 2010). In the analyzed datasets, we observed an average frequency of about 70% T–C conversions in the main T–C conversion site (Fig. S1A). This emphasizes that simulated read datasets with specific properties are necessary for the evaluation of common short read aligners for analyzing PAR-CLIP read data. However, this cannot be created by common sequencing read simulators, such as ART (Huang et al., 2012) or GemSIM (McElroy, Luciani & Thomas, 2012). These produce simulated reads with a continuous coverage over the entire transcript range and the introduced mutations are distributed randomly throughout the simulated reads. This is not the case for PAR-CLIP sequencing reads.
PAR-CLIP read simulation for performance evaluation
We simulated a total of 10 PAR-CLIP read datasets based on information learned from three previously published PAR-CLIP datasets of theFETprotein family (Hoell et al., 2011)
(Table S2). We imitated Illumina GenomeAnalyzer II sequence data according to the real
datasets used. The respective sequencing error and T–C conversion profiles were generated on the basis of alignments of all three datasets against the human reference genome sequence version 38 (GRCh38) (Lander et al., 2001). The error profile and additionally estimated distributions were similar to the ones from PAR-CLIP data on the two RBPs
showed high T–C conversion frequencies in different T–C conversion sites. The remaining 35% of the simulated sequencing reads were designated to represent non-specifically bound transcripts without an elevated T–C conversion rate, except for a few T–C sequencing errors. These reflected RNA contaminations that can occur during the PAR-CLIP experiment.
To assess the quality of the simulation, we then compared PAR-CLIP-specific properties between the 10 simulated datasets and theFETPAR-CLIP data. Within a cluster detected in a simulated dataset, shifts in the alignment positions of a few nucleotides at the beginning and the end of the simulated cluster could be seen between the reads (Fig. S4B). According to the position-wise T–C conversion profile used, a T–C conversion site with a high conversion rate, as well as a few sites with lower conversion rates, were usually present in the detected clusters (e.g., Fig. 1B). We compared the error profiles between one of the simulated datasets and the real datasets, and distinguished between T–C errors and all other errors; the latter represent all sequencing errors other than the T–C sequencing errors (Fig. S2C). Similar to the real data, the distribution of the sequencing errors in the simulated dataset peaked at the beginning of the reads and dropped to a mean error rate of 0.6 EPR in the middle read length range. Error rates were slightly underestimated in the simulated data compared to the real PAR-CLIP data, presumably because of a small percentage of multiple mutations that occurred at individual sites. Apart from this, the simulated datasets appeared to be representative of real PAR-CLIP data in the relevant aspects.
Accuracy of common read aligners and the PARA-suite on simulated PAR-CLIP data
Using the simulated PAR-CLIP datasets, we analyzed the accuracy of state-of-the-art read aligners and common binding site detection algorithms, and compared these to the PARA-suite alignment pipeline. The aligners BWA and Bowtie have often been used in CLIP studies (Lebedeva et al., 2011;Ascano et al., 2012b;Sievers et al., 2012). BWA PSSM was applied with the PSSM for PAR-CLIP provided by its authors because a PSSM estimated from the sequencing dataset revealed worse accuracy (data not shown). MOSAIK was executed, reporting only unique mappings, allowing for up to three mismatches between the read and the reference sequence, and using a Smith–Waterman bandwidth of 5. The read aligners were used to align the simulated datasets to the reference sequence
GRCh38. We also executed the PARA-suite on the Ensembl Genes transcriptome database (version 77) and combined the results with the genomic reference sequence alignments. These results are henceforth referred to as those of the ‘‘PARA-suite pipeline’’, whereas the results of the genomic alignment step using the PARA-suite only are referred to as those of ‘‘BWA PARA.’’ For BWA PARA, the sequencing error and T–C conversion profiles for the simulated datasets were obtained on the basis of the BWA alignments, allowing for two mismatches (BWA 2MMs) for each of the simulated datasets separately (execution commands are outlined in theSupplemental Information 1). For an overview of the performance, we estimated the average of the recall, precision and accuracy for each aligner over the 10 simulated datasets (our calculations are described in the
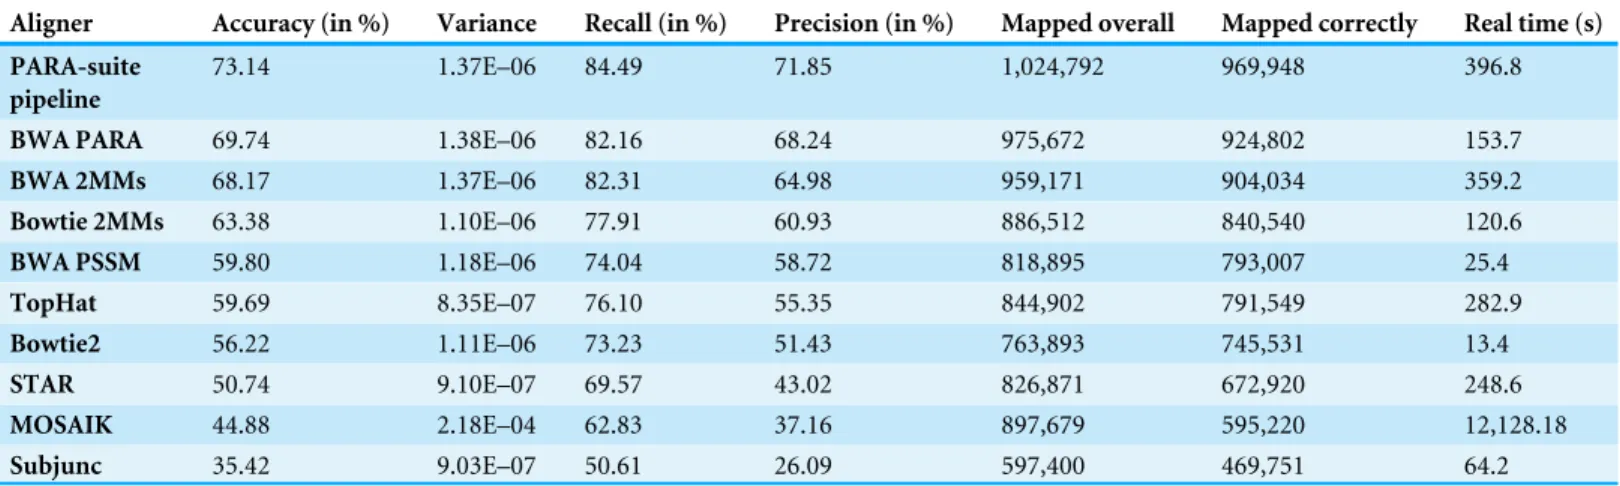
Table 2 Alignment accuracy on simulated PAR-CLIP data.The most accurate alignment results were obtained for different parameter settings for each read aligner on 10 simulated PAR-CLIP datasets. The results are averaged per read aligner over all 10 datasets and are sorted by accuracy.
Aligner Accuracy (in %) Variance Recall (in %) Precision (in %) Mapped overall Mapped correctly Real time (s)
PARA-suite pipeline
73.14 1.37E–06 84.49 71.85 1,024,792 969,948 396.8
BWA PARA 69.74 1.38E–06 82.16 68.24 975,672 924,802 153.7
BWA 2MMs 68.17 1.37E–06 82.31 64.98 959,171 904,034 359.2
Bowtie 2MMs 63.38 1.10E–06 77.91 60.93 886,512 840,540 120.6
BWA PSSM 59.80 1.18E–06 74.04 58.72 818,895 793,007 25.4
TopHat 59.69 8.35E–07 76.10 55.35 844,902 791,549 282.9
Bowtie2 56.22 1.11E–06 73.23 51.43 763,893 745,531 13.4
STAR 50.74 9.10E–07 69.57 43.02 826,871 672,920 248.6
MOSAIK 44.88 2.18E–04 62.83 37.16 897,679 595,220 12,128.18
Subjunc 35.42 9.03E–07 50.61 26.09 597,400 469,751 64.2
(contaminations) and thus we were able to neither calculate the recall nor the accuracy, but only the precision.
In terms of overall performance, the PARA-suite performed best, with an accuracy of 69.74% for BWA PARA and 73.14% for the entire pipeline, showing performance gains of 1.57% and 4.97% compared to the second-best aligner (BWA 2MM), respectively
(Table 2,Table S3). Many prominent PAR-CLIP studies have used Bowtie 1MM or BWA
2MM for the read alignment step (Lebedeva et al., 2011;Mukherjee et al., 2011;Ascano et al., 2012b;Sievers et al., 2012;Mukherjee et al., 2014). When we compared the PARA-suite pipeline with these two aligners, the PARA-suite pipeline showed an increase of 16.95% and 4.97% in the overall accuracy, respectively. Notably, 1.56% of the reads aligned by the PARA-suite pipeline on average spanned an exon–exon junction. These were not identified by the genomic reference mapping step but instead required alignment against the transcriptome reference sequences. Additionally, we compared the recall (the fraction of correctly aligned reads out of all simulated reads) and the precision (the fraction of correctly aligned reads out of all aligned reads) to assess the mapping ability of the read aligners (Table 2,Fig. S5). Here, the PARA-suite pipeline and BWA PARA were ranked first and third regarding recall, and first and second regarding precision, respectively, out of 10 analyzed alignment scenarios (Table 2). Hence, the PARA-suite pipeline and BWA PARA offer notable performance increases over commonly applied alignment setups.
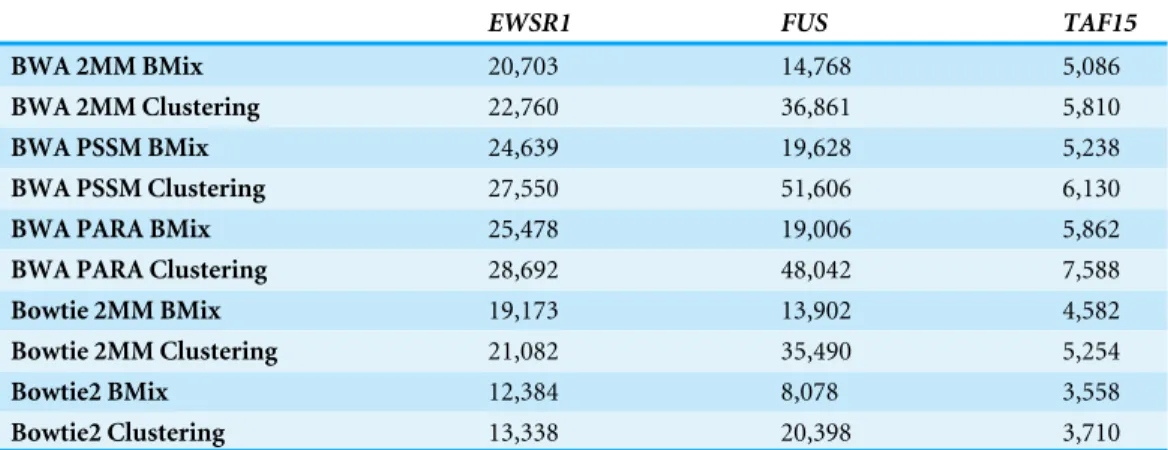
Table 3 Binding sites detected for theFETprotein family. The number of binding sites for theFET protein family identified by the aligners BWA 2MM, BWA PSSM, BWA PARA, Bowtie 2MM and Bowite2 in combination with BMix and the hierarchical clustering of the PARA-suite. Filters were applied accord-ing to ‘PAR-CLIP read simulator and hierarchical clusteraccord-ing.’
EWSR1 FUS TAF15
BWA 2MM BMix 20,703 14,768 5,086
BWA 2MM Clustering 22,760 36,861 5,810
BWA PSSM BMix 24,639 19,628 5,238
BWA PSSM Clustering 27,550 51,606 6,130
BWA PARA BMix 25,478 19,006 5,862
BWA PARA Clustering 28,692 48,042 7,588
Bowtie 2MM BMix 19,173 13,902 4,582
Bowtie 2MM Clustering 21,082 35,490 5,254
Bowtie2 BMix 12,384 8,078 3,558
Bowtie2 Clustering 13,338 20,398 3,710
correct binding sites than BWA PARA. Finally, the hierarchical clustering identified 7.52% more correct binding sites for BWA PARA than for BWA 2MM. Overall, the combination of BMix and BWA PARA provided the most accurate results on our simulated data.
Analysis of FET PAR-CLIP datasets
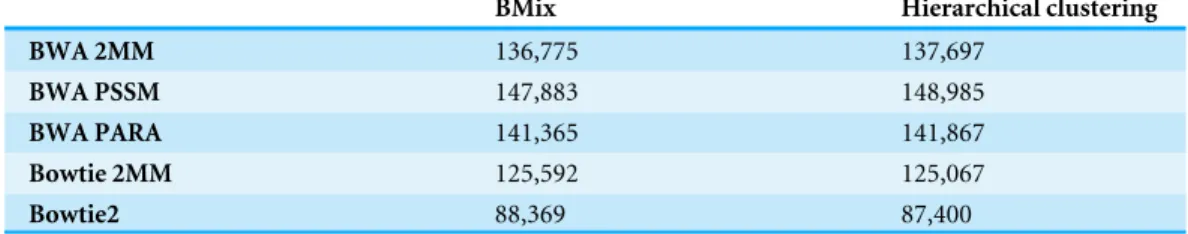
Table 4 Binding sites detected for HuR.Binding sites detected by BMix and the hierarchical clustering based on read alignments performed by BWA 2MM, BWA PSSM, BWA PARA, Bowtie 2MM and Bowtie2 on theHuRdataset.
BMix Hierarchical clustering
BWA 2MM 136,775 137,697
BWA PSSM 147,883 148,985
BWA PARA 141,365 141,867
Bowtie 2MM 125,592 125,067
Bowtie2 88,369 87,400
publication (7,771 genes in total). As expected for three RBPs from the same family, there was a substantial overlap in terms of the identified genes, with 2,702 genes targeted by all three RBPs (Fig. S6).
Analysis of PAR-CLIP data on HuR
We next applied the PARA-suite to a PAR-CLIP dataset on HuR, an RBP promoting RNA stabilization (Mukherjee et al., 2011). Adapters and low-quality ends within theHuR
dataset were trimmed using Cutadapt and reads shorter than 14 bases were discarded. The binding motif ofHuRis well-studied and is AU-rich, with a consensus motif described as AUUUA, AUUUUA or AUUUUUA (Nabors et al., 2003;Lebedeva et al., 2011), showing potentially more T–C conversions within each binding site than other RBPs. As the generated error profile of the dataset was similar to those of the FET PAR-CLIP data (‘Properties of PAR-CLIP reads’), the data quality seemed comparable. However, we noted a slight increase in T–C conversions (Fig. S3). The AU-rich binding motif might explain the higher T–C conversion rate of 1.684 EPR compared to the conversion rate of 1.477 EPR e.g., forFUS.
We used the same read aligners as described in the previous section (Bowtie2, Bowtie 2MM, BWA 2MM, BWA PSSM and BWA PARA) to align the pre-processed dataset against the human genome referenceGRCh38. We applied BMix and the hierarchical clustering of the PARA-suite to determine the binding sites ofHuRderived by using the different read aligners. BWA PSSM, in conjunction with BMix, identified the most RBP binding sites within the genome, which was 3.69% more than BWA PARA (Table 4). When we compared the binding sites detected by BMix and the PARA-suite hierarchical clustering for alignments created by BWA PARA (binding site positions overlapping by at least 13 bases), the difference was only marginal, with an overlap of more than 98.25% for the two methods. A recent study of this dataset reported binding sites using Bowtie 2MM for the alignment step and PARalyzer for the binding site detection. We found that the use of either BWA PSSM or BWA PARA in conjunction with either BMix or hierarchical clustering increased the number of binding sites detected by 2.87–7.84%.
with BMix found 42.53% of the binding sites that were most likely correct. Bowtie 2MM in combination with BMix had the lowest fraction of binding sites containing the reported binding motif (42.44%). We also compared the previously reportedHuRbinding sites to the binding sites determined by the full PARA-suite pipeline with BMix for clustering and detected 13 out of 15 sites, namely 3′UTRPTGS2, 3′ UTRCDKN1A, 3′UTRVEGFA, 3′ UTRTNF, 3′UTRSLC7A1, 3′UTRCCND1, 3′UTRMYC, 3′ UTRXIAP, 3′UTRCELF1, TTSCSF2, 3′ UTRCCNB1, intronNCLand 3′UTRKRAS. The binding information for this comparison was taken from the Ingenuity knowledge base (Calvano et al., 2005). The original study on theHuRdataset (Mukherjee et al., 2011) only reported 12 out of these 15 genes having confirmed binding site.
DISCUSSION
We provided a detailed characterization of the error profiles of PAR-CLIP reads and an in-depth performance assessment of short read aligners in combination with binding site detection tools. We characterized some of the unique properties of PAR-CLIP sequence datasets, including the preferred read positions for T–C conversion sites and their frequencies per read position. We observed higher frequencies of sequencing errors in PAR-CLIP data than in the human reference RNA-Seq data. A likely reason for this behavior could be that PAR-CLIP reads are much shorter than common RNA-Seq reads, which reach lengths of 200 bases and show high-quality regions in the middle read length range (Laehnemann, Borkhardt & McHardy, 2015;Schirmer et al., 2015). We used these observations for the design of a PAR-CLIP read simulator that embeds PAR-CLIP specific information within the simulation process and the PARA-suite pipeline for error-aware read alignment and processing. The read simulator mimics PAR-CLIP datasets with error profiles drawn from real PAR-CLIP datasets.
downstream. Importantly, unlike the error-aware short read aligner BWA PSSM, our short read alignment algorithm does not need the manual input of an error profile, which is instead inferredde novowithin individual sequencing runs. The aligner thus automatically adapts to varying qualities of individual (PAR-)CLIP sequencing runs and is specifically adjusted to each sequence dataset. To our knowledge, it is the first tool for simultaneous
de novoerror model inference and short read alignment based on the BWA algorithm. Another difference from the BWA PSSM algorithm is that the latter introduces mismatches while considering the base calling quality scores and a probabilistic background model for matching bases in addition to the input error profile. In contrast, the generic error profile estimation of the PARA-suite is not limited to any specific input profile. Further applications of our software could thus be used to analyze other types of error-prone sequencing data such as bisulphite sequencing data, which introduces a high amount of C–T mutations (Frommer et al., 1992) or data from low-quality ancient DNA samples (Briggs et al., 2007).
Common read simulators such as ART or GemSim do not allow simulating PAR-CLIP reads with their specific error profiles. When comparing the PAR-CLIP read simulator to the recently developed CSeq simulator for CLIP data (Kassuhn, Ohler & Drewe, 2016), both have different strengths. CSeq takes an exact binding motif and T–C conversion profile that is specific for the respective binding motif as input, thus restricting the reads’ base composition and T–C conversion sites. This allows to mimic PAR-CLIP reads for a specific RBP, but not to generalize evaluations on these datasets to all kinds of RBPs. In comparison, the PAR-CLIP reads simulated with the PARA-suite are based on data that have been inferred from three different PAR-CLIP datasets to simulate heterogenic reads, which represent a broader spectrum of RBP binding sites. In addition, the read selection is not restricted to sequences containing the actual RBP binding motif. Thus, CSeq and the PARA-suites’ read simulator have slightly different applications: CSeq allows one to simulate reads to optimize parameters for a specific dataset and the PARA-suite allows one to simulate reads for general tool evaluation and algorithmic improvements.
Our analysis of combinations of read aligners and binding site detection algorithms on simulated and real datasets indicated that no single software performed best in terms of detecting binding sites on the available PAR-CLIP datasets. This observation was recently also made on other datasets (Kassuhn, Ohler & Drewe, 2016). Our analysis of the HuRandFUS datasets revealed that U-rich binding sites tended to show higher rates of T–C conversions per read and were best aligned by BWA PSSM. RBPs with a more heterogeneous nucleotide distribution within the binding site (e.g., EWSR1
ACKNOWLEDGEMENTS
The authors thank Johannes Droege, David Laehnemann and Cristina della Beffa for their critical comments on the manuscript.
ADDITIONAL INFORMATION AND DECLARATIONS
Funding
This work was supported by the Düsseldorf School of Oncology (funded by the Comprehensive Cancer Center Düsseldorf/Deutsche Krebshilfe and the Medical Faculty HHU Düsseldorf). The authors additionally received funding from the Heinrich Heine University, the Elterninitiative Kinderkrebsklinik e.V. of Düsseldorf, and the Helmholtz Centre for Infection Research in Braunschweig. The funders had no role in study design, data collection and analysis, decision to publish, or preparation of the manuscript.
Grant Disclosures
The following grant information was disclosed by the authors:
Comprehensive Cancer Center Düsseldorf/Deutsche Krebshilfe and the Medical Faculty of Heinrich Heine University Düsseldorf.
Elterninitiative Kinderkrebsklinik e.V. of Düsseldorf. Helmholtz Centre for Infection Research Braunschweig.
Competing Interests
Alice C. McHardy is an Academic Editor for PeerJ.
Author Contributions
• Andreas Kloetgen conceived and designed the experiments, performed the experiments, analyzed the data, contributed reagents/materials/analysis tools, wrote the paper, prepared figures and/or tables, reviewed drafts of the paper.
• Arndt Borkhardt and Jessica I. Hoell analyzed the data, wrote the paper, reviewed drafts of the paper.
• Alice C. McHardy conceived and designed the experiments, analyzed the data, contributed reagents/materials/analysis tools, wrote the paper, reviewed drafts of the paper.
Data Availability
The following information was supplied regarding data availability:
Source code of the PARA-suite toolkit and the PARA-suite aligner (BWA PARA) are available athttps://github.com/akloetgen/PARA-suiteandhttps://github.com/akloetgen/
PARA-suite_aligner, respectively, under the GNU GPLv3 license.
Supplemental Information
Supplemental information for this article can be found online athttp://dx.doi.org/10.7717/
REFERENCES
Ascano M, Hafner M, Cekan P, Gerstberger S, Tuschl T. 2012a.Identification of RNA– protein interaction networks using PAR-CLIP.Wiley Interdisciplinary Reviews: RNA
3(2):159–177DOI 10.1002/wrna.1103.
Ascano M, Mukherjee N, Bandaru P, Miller JB, Nusbaum JD, Corcoran DL, Langlois C, Munschauer M, Dewell S, Hafner M. 2012b.FMRP targets distinct mRNA sequence elements to regulate protein expression.Nature492(7429):382–386
DOI 10.1038/nature11737.
Briggs AW, Stenzel U, Johnson PL, Green RE, Kelso J, Prüfer K, Meyer M, Krause J, Ronan MT, Lachmann M. 2007.Patterns of damage in genomic DNA sequences from a Neandertal.Proceedings of the National Academy of Sciences of the United States of America104(37):14616–14621DOI 10.1073/pnas.0704665104.
Burrows M, Wheeler DJ. 1994. A block-sorting lossless data compression algorithm. In:
(Technical Report 124). Palo Alto: Digital Equipment Corporation.
Calvano SE, Xiao W, Richards DR, Felciano RM, Baker HV, Cho RJ, Chen RO,
Brownstein BH, Cobb JP, Tschoeke SK. 2005.A network-based analysis of systemic inflammation in humans.Nature437(7061):1032–1037DOI 10.1038/nature03985. Chi SW, Zang JB, Mele A, Darnell RB. 2009.Argonaute HITS-CLIP decodes microRNA–
mRNA interaction maps.Nature460(7254):479–486 DOI 10.1038/nature08170. Cock PJ, Fields CJ, Goto N, Heuer ML, Rice PM. 2010.The Sanger FASTQ file format for
sequences with quality scores, and the Solexa/Illumina FASTQ variants.Nucleic Acids Research38(6):1767–1771DOI 10.1093/nar/gkp1137.
Cunningham F, Amode MR, Barrell D, Beal K, Billis K, Brent S, Carvalho-Silva D, Clapham P, Coates G, Fitzgerald S, Gil L, Giron CG, Gordon L, Hourlier T, Hunt SE, Janacek SH, Johnson N, Juettemann T, Kahari AK, Keenan S, Martin FJ, Maurel T, McLaren W, Murphy DN, Nag R, Overduin B, Parker A, Patricio M, Perry E, Pignatelli M, Riat HS, Sheppard D, Taylor K, Thormann A, Vullo A, Wilder SP, Zadissa A, Aken BL, Birney E, Harrow J, Kinsella R, Muffato M, Ruffier M, Searle SM, Spudich G, Trevanion SJ, Yates A, Zerbino DR, Flicek P. 2015.Ensembl 2015.Nucleic Acids Research43(Database issue):D662–D669
DOI 10.1093/nar/gku1010.
Danan C, Manickavel S, Hafner M. 2016.PAR-CLIP: a method for transcriptome-wide identification of RNA binding protein interaction sites.Methods in Molecular Biology
1358:153–173DOI 10.1007/978-1-4939-3067-8_10.
Dobin A, Davis CA, Schlesinger F, Drenkow J, Zaleski C, Jha S, Batut P, Chaisson M, Gingeras TR. 2013.STAR: ultrafast universal RNA-seq aligner.Bioinformatics
29(1):15–21DOI 10.1093/bioinformatics/bts635.
Eddy SR. 2001.Non-coding RNA genes and the modern RNA world.Nature Reviews. Genetics2(12):919–929DOI 10.1038/35103511.
Frommer M, McDonald LE, Millar DS, Collis CM, Watt F, Grigg GW, Molloy PL, Paul CL. 1992.A genomic sequencing protocol that yields a positive display of 5-methylcytosine residues in individual DNA strands.Proceedings of the National Academy of Sciences of the United States of America89(5):1827–1831
DOI 10.1073/pnas.89.5.1827.
Glisovic T, Bachorik JL, Yong J, Dreyfuss G. 2008.RNA-binding proteins and post-transcriptional gene regulation.FEBS Letters582(14):1977–1986
DOI 10.1016/j.febslet.2008.03.004.
Golumbeanu M, Mohammadi P, Beerenwinkel N. 2015.BMix: probabilistic modeling of occurring substitutions in PAR-CLIPdata.Bioinformatics32(7):976–983.
Hafner M, Landthaler M, Burger L, Khorshid M, Hausser J, Berninger P, Rothballer A, Ascano Jr M, Jungkamp AC, Munschauer M, Ulrich A, Wardle GS, Dewell S, Zavolan M, Tuschl T. 2010.Transcriptome-wide identification of RNA-binding protein and microRNA target sites by PAR-CLIP.Cell141(1):129–141
DOI 10.1016/j.cell.2010.03.009.
Hieronymus H, Silver PA. 2004.A systems view of mRNP biology.Genes and Develop-ment 18(23):2845–2860DOI 10.1101/gad.1256904.
Hoell JI, Hafner M, Landthaler M, Ascano M, Farazi TA, Wardle G, Nusbaum J, Cekan P, Khorshid M, Burger L. 2014. Transcriptome-Wide Identification of Protein Binding Sites on RNA by PAR-CLIP (Photoactivatable-Ribonucleoside-Enhanced Crosslinking and Immunoprecipitation). In: Hartmann ABRK, Schön A, Westhof E, eds.Handbook of RNA Biochemistry: Second, Completely Revised and Enlarged Edition, vol. II. Weinheim: Wiley-VCH Verlag GmbH & Co. KGaA, 877–898.
Hoell JI, Larsson E, Runge S, Nusbaum JD, Duggimpudi S, Farazi TA, Hafner M, Borkhardt A, Sander C, Tuschl T. 2011.RNA targets of wild-type and mutant FET family proteins.Nature Structural & Molecular Biology18(12):1428–1431
DOI 10.1038/nsmb.2163.
Huang W, Li L, Myers JR, Marth GT. 2012.ART: a next-generation sequencing read simulator.Bioinformatics28(4):593–594DOI 10.1093/bioinformatics/btr708. Kassuhn W, Ohler U, Drewe P. 2016. Cseq-simulator: a data simulator for CLIP-Seq
experiments. In:Pacific Symposium on Biocomputing.
Kerpedjiev P, Frellsen J, Lindgreen S, Krogh A. 2014.Adaptable probabilistic map-ping of short reads using position specific scoring matrices.BMC Bioinformatics
15(1):100DOI 10.1186/1471-2105-15-100.
Kishore S, Jaskiewicz L, Burger L, Hausser J, Khorshid M, Zavolan M. 2011.A quantita-tive analysis of CLIP methods for identifying binding sites of RNA-binding proteins.
Nature Methods8(7):559–564DOI 10.1038/nmeth.1608.
Kloetgen A, Münch PC, Borkhardt A, Hoell JI, McHardy AC. 2015.Biochemical and bioinformatic methods for elucidating the role of RNA-protein interactions in posttranscriptional regulation.Briefings in Functional Genomics14(2):102–114
DOI 10.1093/bfgp/elu020.
nucleotide resolution.Nature Structural & Molecular Biology17(7):909–915
DOI 10.1038/nsmb.1838.
Laehnemann D, Borkhardt A, McHardy AC. 2015.Denoising DNA deep sequencing data—high-throughput sequencing errors and their correction.Briefings in Bioinfor-matics17(1):154–179.
Lander ES, Linton LM, Birren B, Nusbaum C, Zody MC, Baldwin J, Devon K, Dewar K, Doyle M, FitzHugh W. 2001.Initial sequencing and analysis of the human genome.
Nature409(6822):860–921DOI 10.1038/35057062.
Langmead B, Salzberg SL. 2012.Fast gapped-read alignment with Bowtie 2.Nature Methods9(4):357–359DOI 10.1038/nmeth.1923.
Langmead B, Trapnell C, Pop M, Salzberg SL. 2009.Ultrafast and memory-efficient alignment of short DNA sequences to the human genome.Genome Biology10(3): Article R25 DOI 10.1186/gb-2009-10-3-r25.
Lebedeva S, Jens M, Theil K, Schwanhäusser B, Selbach M, Landthaler M, Rajewsky N. 2011.Transcriptome-wide analysis of regulatory interactions of the RNA-binding protein HuR.Molecular Cell43(3):340–352DOI 10.1016/j.molcel.2011.06.008. Lee W-P, Stromberg MP, Ward A, Stewart C, Garrison EP, Marth GT. 2014.MOSAIK: a
hash-based algorithm for accurate next-generation sequencing short-read mapping.
PLoS ONE9(3):e90581DOI 10.1371/journal.pone.0090581.
Li H, Durbin R. 2009.Fast and accurate short read alignment with Burrows-Wheeler transform.Bioinformatics25(14):1754–1760DOI 10.1093/bioinformatics/btp324. Liao Y, Smyth GK, Shi W. 2013.The Subread aligner: fast, accurate and
scal-able read mapping by seed-and-vote.Nucleic Acids Research41(10):e108
DOI 10.1093/nar/gkt214.
Lukong KE, Chang K-W, Khandjian EW, Richard S. 2008.RNA-binding proteins in hu-man genetic disease.Trends in Genetics24(8):416–425DOI 10.1016/j.tig.2008.05.004. Martin M. 2011.Cutadapt removes adapter sequences from high-throughput sequencing
reads.EMBnet.journal17(1):10–12DOI 10.14806/ej.17.1.200.
McElroy KE, Luciani F, Thomas T. 2012.GemSIM: general, error-model based simulator of next-generation sequencing data.BMC Genomics13(1):74
DOI 10.1186/1471-2164-13-74.
Mukherjee N, Corcoran DL, Nusbaum JD, Reid DW, Georgiev S, Hafner M, Ascano M, Tuschl T, Ohler U, Keene JD. 2011.Integrative regulatory mapping indicates that the RNA-binding protein HuR couples pre-mRNA processing and mRNA stability.
Molecular Cell43(3):327–339 DOI 10.1016/j.molcel.2011.06.007.
Mukherjee N, Jacobs NC, Hafner M, Kennington EA, Nusbaum JD, Tuschl T, Blackshear PJ, Ohler U. 2014.Global target mRNA specification and regula-tion by the RNA-binding protein ZFP36.Genome Biology15(1): Article R12
DOI 10.1186/gb-2014-15-1-r12.
Schirmer M, Ijaz UZ, D’Amore R, Hall N, Sloan WT, Quince C. 2015.Insight into biases and sequencing errors for amplicon sequencing with the Illumina MiSeq platform.
Nucleic Acids Research43(6):e37.
SEQC/MAQC-III-Consortium. 2014.A comprehensive assessment of RNA-seq accuracy, reproducibility and information content by the Sequencing Quality Control
Consortium.Nature Biotechnology32(9):903–914 DOI 10.1038/nbt.2957. Sherry ST, Ward MH, Kholodov M, Baker J, Phan L, Smigielski EM, Sirotkin K.
2001.dbSNP: the NCBI database of genetic variation.Nucleic Acids Research
29(1):308–311DOI 10.1093/nar/29.1.308.
Sievers C, Schlumpf T, Sawarkar R, Comoglio F, Paro R. 2012.Mixture models and wavelet transforms reveal high confidence RNA-protein interaction sites in MOV10 PAR-CLIP data.Nucleic Acids Research40(20):e160DOI 10.1093/nar/gks697. Sugimoto Y, König J, Hussain S, Zupan B, Curk T, Frye M, Ule J. 2012.Analysis
of CLIPand iCLIP methods for nucleotide-resolution studies of protein-RNA interactions.Genome Biology13(8): Article R67DOI 10.1186/gb-2012-13-8-r67. Tan AY, Manley JL. 2009.The TET family of proteins: functions and roles in disease.
Journal of Molecular Cell Biology1(2):82–92DOI 10.1093/jmcb/mjp025. Trapnell C, Pachter L, Salzberg SL. 2009.TopHat: discovering splice junctions with
RNA-Seq.Bioinformatics25(9):1105–1111DOI 10.1093/bioinformatics/btp120. Van Dijk EL, Auger H, Jaszczyszyn Y, Thermes C. 2014.Ten years of next-generation
se-quencing technology.Trends in Genetics30(9):418–426DOI 10.1016/j.tig.2014.07.001. Wang T, Xiao G, Chu Y, Zhang MQ, Corey DR, Xie Y. 2015.Design and
bioin-formatics analysis of genome-wide CLIP experiments.Nucleic Acids Research
43(11):5263–5274DOI 10.1093/nar/gkv439.
Zhang C, Darnell RB. 2011.Mappingin vivoprotein-RNA interactions at single-nucleotide resolution from HITS-CLIP data.Nature Biotechnology29(7):607–614