www.nat-hazards-earth-syst-sci.net/12/2019/2012/ doi:10.5194/nhess-12-2019-2012
© Author(s) 2012. CC Attribution 3.0 License.
and Earth
System Sciences
Estimation of seismic ground motions using deterministic approach
for major cities of Gujarat
J. Shukla and D. Choudhury
Department of Civil Engineering, Indian Institute of Technology Bombay, Powai, Mumbai, 400076, India
Correspondence to:D. Choudhury ([email protected])
Received: 10 January 2011 – Revised: 30 March 2011 – Accepted: 16 May 2011 – Published: 26 June 2012
Abstract. A deterministic seismic hazard analysis has been carried out for various sites of the major cities (Ahmedabad, Surat, Bhuj, Jamnagar and Junagadh) of the Gujarat region in India to compute the seismic hazard exceeding a certain level in terms of peak ground acceleration (PGA) and to estimate maximum possible PGA at each site at bed rock level. The seismic sources in Gujarat are very uncertain and recurrence intervals of regional large earthquakes are not well defined. Because the instrumental records of India specifically in the Gujarat region are far from being satisfactory for modeling the seismic hazard using the probabilistic approach, an at-tempt has been made in this study to accomplish it through the deterministic approach. In this regard, all small and large faults of the Gujarat region were evaluated to obtain ma-jor fault systems. The empirical relations suggested by ear-lier researchers for the estimation of maximum magnitude of earthquake motion with various properties of faults like length, surface area, slip rate, etc. have been applied to those faults to obtain the maximum earthquake magnitude. For the analysis, seven different ground motion attenuation rela-tions (GMARs) of strong ground motion have been utilized to calculate the maximum horizontal ground accelerations for each major city of Gujarat. Epistemic uncertainties in the hazard computations are accounted for within a logic-tree framework by considering the controlling parameters likeb -value, maximum magnitude and ground motion attenuation relations (GMARs). The corresponding deterministic spectra have been prepared for each major city for the 50th and 84th percentiles of ground motion occurrence. These determin-istic spectra are further compared with the specified spectra of Indian design code IS:1893-Part I (2002) to validate them for further practical use. Close examination of the developed spectra reveals that the expected ground motion values be-come high for the Kachchh region i.e. Bhuj city and moderate in the Mainland Gujarat, i.e. cities of Surat and Ahmedabad. The seismic ground motion level in the Saurashtra is moder-ate but marginally differs from that as presently specified in
IS:1893-Part I (2002). Based on the present study, the recom-mended PGA values for the cities studied are 0.13 g, 0.15 g, 0.64 g, 0.14 g and 0.2 g for Ahmedabad city, Surat City, Bhuj City, Jamnagar City and Junagadh city, respectively. The pre-pared spectra can be further used for seismic resistant design of structures within the above major city boundaries of Gu-jarat to quantify seismic loading on structures.
1 Introduction
Proper determination of the peak horizontal ground accel-eration for designing the earthquake-resistant structures in earthquake-prone regions is essential. In country like In-dia with huge populations, the utmost care must be taken for such estimation of seismic ground motion for seismically active regions like the Himalayian belt, the Kachchh region, etc. The current practice in India for assigning the earthquake load for the design of structures is to utilize the seismic haz-ard zonation map given in the Indian standhaz-ard design code IS:1893-Part I (2002), in which India is divided into four subclasses of seismic zones. The assigned peak ground ac-celeration (PGA) values on that map are 0.08 g, 0.16 g, 0.24 g and 0.32 g for Zones, II, III, IV and V respectively. The seis-mic zonation map for the Gujarat region is shown in Fig. 1. In the seismic zonation map, the transition from one seis-mic zone to the adjacent one is rather drastic; it is created by either dropping or increasing the ground acceleration by 0.08 g. Also, the estimation for seismic ground motions in various major cities of Gujarat is still not consistent with the tectonic framework for Gujarat. Hence, in this paper an at-tempt has been made to estimate the seismic ground motions for the entire region of Gujarat including some typical major cities representing all seismic zones.
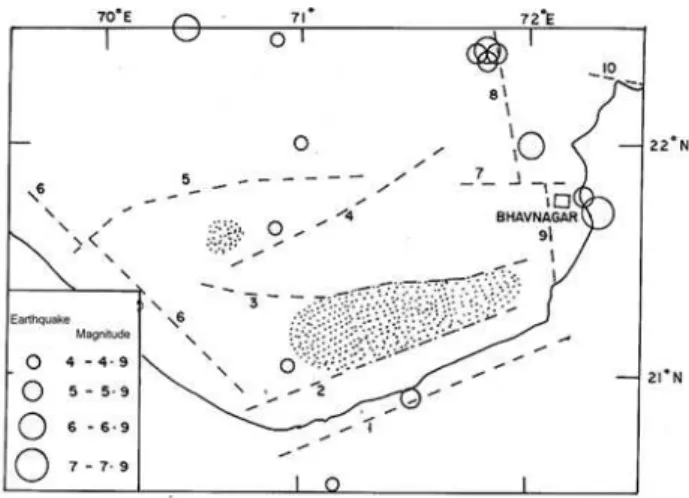
several damaging moderate-sized earthquakes with moment magnitudes between 5 and 6 (Bendick et al., 2001, Petersen et al., 2004, Choudhury and Shukla, 2011). Nine of these moderate earthquakes have occurred during the past 155 yr in this region with an average of about one event every 17 yr. Large and moderate earthquakes are likely to repeat in the future and it is essential to assess the hazard in order to aid engineers and public officials in making decisions that will influence economic and life safety policies for the Gujarat region (Petersen et al., 2004). During the year 2008, 1842 shocks of moment magnitude of 0.5 to 4.4 were recorded in Gujarat. Figure 2 illustrates the locations of epicenters for various earthquakes recorded during 2008 through the Gu-jarat State Seismic Network (GS-Net), recently established by the Institute of Seismological Research (ISR), Gujarat.
The present study aims to carry out deterministic seismic hazard analysis for a few major cities of Gujarat. Typical five major city locations viz. Ahmedabad, Surat, Jamnagar, Bhuj and Junagadh have been selected for the present study. The selection of these five sites is primarily based on the fact that all these sites represent all the three parts of the inves-tigated area, i.e. Kachchh, Saurashtra and the Mainland re-gion of Gujarat and within that particular area, they are also the hubs of commercial/administrative activities. Moreover, these locations also represent the different earthquake zona-tions given in IS: 1893 – Part I (2002) which will facilitate the comparison of the outcome of this study with provisions of the code. The outcome of the present study consists of de-terministic response spectra of the horizontal component of ground motion for different natural periods of structures for the particular city for the reference 50 percentile (median) and 84 percentile of earthquake occurrence, respectively.
2 Methodology
Following Yadav et al. (2008), in the present study, the entire Gujarat region is divided into three seismogenic regions on the basis of seismicity, tectonics and geomorphology, namely Saurashtra, Mainland Gujarat and Kachchh. Available seis-motectonic and geological criteria are combined to prepare a possible fault map which is then put together with the avail-able earthquake catalogue to obtain fault recurrence relations from regional earthquake recurrence relations. The max-imum magnitude associated with fault can be determined either from the observed maximum earthquake in a nearby area from the earthquake catalogue data or can be calculated through empirical correlations between key fault parameters (fault rupture length, fault displacement and fault area) and magnitude. The available relationships given by different re-searchers, such as Bonilla et al. (1984), Nowroozi (1985), Slemmons et al. (1989), and Wells and Coppersmith (1994) have been used for the present study in order to decide the maximum magnitude for particular fault. These parameters are finally combined with seven Ground Motion
Attenua-tion RelaAttenua-tions (GMARs) within a probabilistic framework to identify the most probable deterministic ground motion val-ues at a given site. The Epistemic uncertainty in the present analysis has been tackled within a logic-tree framework con-sidering a few controlling parameters like region specific b-value, maximum magnitude of earthquake, and ground mo-tion attenuamo-tion relamo-tions (GMARs).
3 Seismotectonic settings
The collision process of the Indian plate with the Eurasian plate is still underway at a rate of 45 mm year−1,
induc-ing an anticlockwise rotation of the plate (Bilham, 2004). Apart from the active seismic sources at the plate bound-ary (i.e. Himalayan arc), most of Peninsular India (PI) has been considered as a low seismic zone until the oc-currence of some surprising and damaging earthquakes in the recent past (e.g. Koyna, 1967; Latur, 1993; Jabalpur, 1997, and Bhuj, 2001). From the point of view of phys-iography, the Gujarat region of India is comprised of three distinct zones: Kachchh, Saurashtra, and Mainland Gujarat (Chopra et al., 2010). The region is a junction of three tec-tonic rifts: Kachchh, Cambay and Narmada with several ac-tive faults (Biswas 1987, 2005; Talwani and Gangopadhayay, 2001). The seismicity of the Gujarat state is characterized by a relatively high frequency of large earthquakes but a rela-tively low frequency of moderate earthquakes, particuarly in the Kachchh region. The seismic characteristics of the Gu-jarat state has been divided into three regions (e.g. Kachchh, Saurashtra and Mainland Gujarat) to study the seismicity within the regions.
3.1 Kachchh
The Kachchh basin is a western margin pericratonic rift basin of India (Biswas 1987, 2005). The Kachchh region is considered to be bound between the two extensional faults, namely the south-dipping Nagar Parkar Fault (along the Pak-istan border) in the North and the north-dipping Kathiawar Fault in the South (Rastogi, 2004). Several researchers has described the seismotectonic of Kachchh mainly, Biswas and Deshpande (1970), Biswas (1987, 2005), Sukhtankar et al. (1993), Malik et al. (1999), Rastogi et al. (2001), Thakur and Wesnousky (2002), Bodin and Horton (2004), Mandal et al. (2008), Chopra et al. (2010). The Kachchh region has a history of active seismicity with several large dam-aging earthquakes in the magnitude of 6 to 7 ranging over the last several hundred years (Quittmeyer and Jacob, 1979, Rajendran and Rajendran, 2001). The occurrence of the
Mw= 7.6 Bhuj 2001earthquake less than two centuries after
Fig. 1. Geographical location of the Gujarat region in India (highlighed in inset) and seismic zonation map for the Gujarat region (cities under consideration in present study highlighted by red enclosed region). (Ref figure from ISR web site-www.isr.gujarat.gov.in, last accessed on 10 October 2010.)
consistent with the return period of 180 yr in the region or 800 yr on individual faults (Rajendran et al., 2001; Rajen-dran and RajenRajen-dran, 2001). The major faults of the Kutch region are trending E–W that include Allah Bund Fault, Is-land Belt Fault, Kutch MainIs-land fault (KMF) and Katrol Hill fault. The north- dipping Allah Bund fault was associated with the 1819 earthquake. The Island Belt Fault, along which there are situated several uplifts seen as islands in the Great Rann of Kutch, is associated with some magnitude 5 earth-quakes. The KMF extending for 125 km is a reverse fault and has a structural displacement of 2–3 km. The 2001 earth-quake occurred along a hidden fault named the North Wagad fault (Rastogi, 2001), situated about 25 km north of KMF and alongside which the Banni Plains area is inferred to be uplifting. Petersen et al. (2004) tested the sensitivity of seis-mic hazard to three fault source models for the Kachchh re-gion and observed the recurrence intervals of 266–533 yr on one of these faults. Yadav et al. (2008) and Tripathi (2006) worked out a probabilistic hazard assessment for this region
based on the earthquake recurrence modeling using various probability distributions.
3.2 Saurashtra
Fig. 2.Epicenters of earthquakes recorded by the ISR (Institute of Seismological Research) in the year 2008. (Reference from Annual report of ISR 08-09, available online on www.isr.gujarat.gov.in).
Fig. 3. Location of past earthquakes of magnitude 4 and above.
(Note: Dotted areas are dyke zones of swarms. Faults are shown by dashed lines. 1, South Saurashtra fault; 2, Rajula fault; 3, Saverkun-dala fault; 4, South Junagadh fault; 5, North Junagadh fault; 6, Um-rethi fault; 7, Shihor fault; 8, West Cambay basin fault; 9, Eastward offsetted West Cam- bay basin fault, and 10, Camay–Dabhoi fault.) (Bhattacharya et al., 2004).
by major faults namely, the North Kathiawar Fault (NKF) to the north, the extension of the Son–Narmada fault to the south, the WNW–ESE trending West Coast fault system to the west in the Arabian Sea, and the extension of the West Cambay fault to the east (Biswas, 1987, 2005). However, according to past history, only the West Cambay fault in the East near Bhavnagar accommodates moderate seismicity in the last 200 yr, while the other faults exhibit weak earth-quake activity and were inactive until the recent earthearth-quakes
in another region have shown considerable seismicity in the Saurashtra region (Fig. 2), (Yadav et al., 2010).
One strong earthquake Mw=5.0 occurring in 1940 in
Dwarka (intensity VI) was reported by several researchers (Tandon, 1959; Chandra, 1977; Guha and Basu, 1993). The Junagadh region experienced a shock of Mw=4.3 on 3
September 1985 and recently Yadav et al. (2010) has de-scribed the recent activities in this region. An offshore earth-quake withMw=5.0 was also reported on 24 August 1993
near Rajula. On 3 August 2000, the region of Girnar Hills near Una experienced an earthquake ofMw=4.3, which was
strongly felt up to Jamnagar. This earthquake activity was associated with two perpendicular faults passing through the epicentral region, namely, the West Cambay and the Shihor faults (Bhattacharya et al., 2004).
3.3 Mainland Gujarat
Mainland Gujarat has experienced moderate seismicity cov-ering two rift zones, namely the Narmada rift zone and the Cambay rift zone (Kaila et al., 1980; Biswas, 1987). Presently, the Narmada rift zone is more active than the Cam-bay rift zone. A total of nine earthquakes ofMw≥5.0 have
occurred in this region. The important earthquakes in this region are Mount Abu (1848, Mw=6.0; 1969,Mw=5.5),
Surat (1856, Mw=5.7; 1871, Mw=5.0 and 1935, Mw=
5.7), Ahmedabad (1864, Mw=5.0), Satpura (1938, Mw=
6.0) and Bharuch (1970,Mw=5.4) (Yadav et al., 2008). The
Broach Earthquake of March 23, 1970 was one of the major intraplate earthquake associated with paleorift zones in the stable continental region of Peninsular India (Chung, 1993). The valleys of the Narmada – Son (NSL) river in India are considered as a major tectonic boundary – a geofracture di-viding the Indian shield into a southern peninsular block and a northern foreland block (Biswas, 1982). The NSL has ex-perienced more than 30 earthquakes in the magnitude range of 3.0–6.5 on the Richter scale (Gupta et al., 1997).
4 Earthquake catalogue
Various researchers have prepared the earthquake catalogue for the Indian subcontinents (Oldham, 1983; Tandon and Srivastava, 1974; Chandra, 1977; Quittmeyer and Jacob, 1979; Guha and Basu, 1993; Iyengar et al., 1999, Malik et al., 1999, Jaiswal and Sinha, 2007, Yadav et al., 2008) by considering historical and modern earthquakes. The Insti-tute of Seismological Research-Gujarat (ISR) has prepared a compiled earthquake catalogue of the Kachchh, Saurasthra and Mainland Gujarat, bounded by 20–25.5 N and 68–75 E from the earliest times to March 2008 for all magnitude ranges and has made this available on their web portal (Ref. www.isr.gujarat.gov.in). In the present study, the earthquake catalogue of magnitudeMw≥4 available on the Institute of
Fig. 4. Catalogue completeness by Cumulative Visual (CUVI)
method for Gujarat by using the earthquake catalogue (Mw≥4)
available on ISR-Gujarat web site (www.isr.gujarat.gov.in)
find out three parameters: the activity rate, theb-value of the Gutenberg-Richter (G-R) relationship, and the observed maximum magnitude of earthquake near the fault. The cat-alogue was further analyzed for declustering using the static windowing technique (constant spatiotemporal window of 30 days and 30 km). After analyzing the earthquake cata-logue for declustering, an earthquake catacata-logue spanning a time period of 1820–2008 for earthquake magnitudeM≥4 was prepared for use in the present study. As seismic in-strumentation has been just been initialized in the Gujarat by GS-Net under the umbrella of the Institute of Seismological Research, most of the catalogue events in the prepared cat-alogue have been taken from historic records only. Histori-cal earthquake records are usually more complete for larger earthquakes than for smaller ones. In the present analysis, the minimum threshold magnitude is assumed asMw=4,
and generally events withMw≥4 may not remain unnoticed
as far as historic data is concerned. Based on this argument, it is reasonable to assume that the earthquake catalogue pre-pared forMw≥4 is complete for its further use for
prelim-inary seismic hazard computations. For checking the com-pleteness correctly, a sufficient number of samples should be available at all possible magnitudes. In the present study, the availability of the data in the Gujarat region is low (after re-moving the clustered events only ,95 events ofMw≥4 were
available). However, the Cumulative Visual (CUVI) method (Tinti and Mulargia, 1985) was used to check the complete-ness of the catalogue with these limited data. The CUVI method is based on the visual method for assessing catalogue completeness, based on the plot of the cumulative number of events, which is very easy to apply efficiently for limited event data. Figure 4 represents the cumulative earthquake oc-currence in time and space for checking the catalogue com-pleteness. As per Fig. 4, the seismicity rate is uniform from
Table 1.Earthquakes recorded in the year 2008 in the three regions
of Gujarat by GS-Net (Ref. Annual Report ISR-Gujarat, 08-09, available online www.isr.gujarat.gov.in).
Region Mw≥4 Mw Mw Mw Total
(3 to 3.9) (2 to 2.9) (1 to 3.9)
Kachchh 5 52 343 493 893
Saurashtra 2 12 221 424 659
Mainland – 3 17 26 46
Total 7 67 581 943 1598
1820 to 1960 but from 1961 to 2008, the seismicity rate in-creased. However, the seismicity rate for larger earthquakes in the present study is assumed to be uniform and catalogue is assumed to be complete during the period 1820 to 2008. This is also justified for historic earthquakes where the recorded seismicity differs from the true seismicity. Furthermore, his-toric earthquake records are usually more complete for larger earthquakes than for smaller ones, which further suggests that the catalogue can be assumed to be complete forMw≥4.
The earthquake activities are significant in Gujarat for the recent years and these may be attributed to recent activ-ity along Bhavnagar swarms (2000), Bhuj Earthquake se-quence (2001–2008), Jamnagar swarms (2006–2008) and Talala earthquakes (2006–2010) (Table 1). After 2001, seis-micity has occurred at several new places in the Saurashtra region, specially in Jamnagar, Surendranagar, and the Ta-lala area of Junagadh which has remained stable within the Saurashtra region.
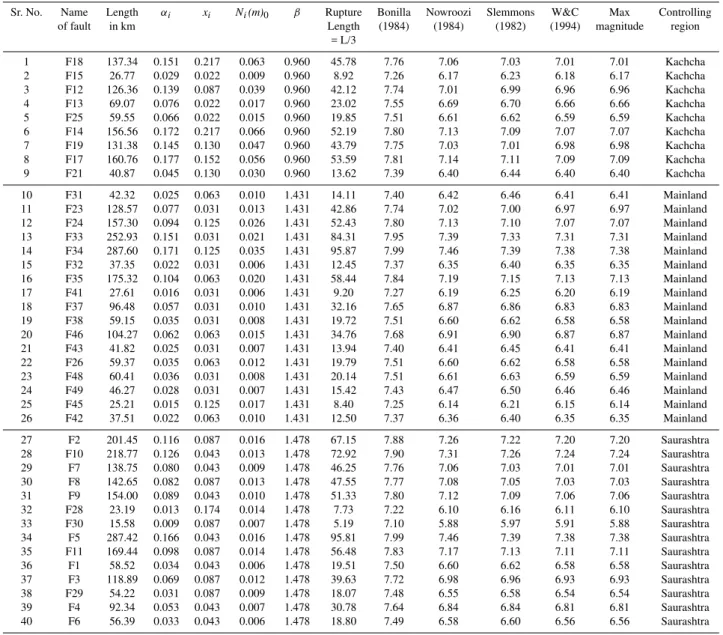
In the present study, five cities were selected as the tar-get and considering the city as centre, a control region with a radius of 250 km around the city is taken into account for fur-ther seismic hazard computations. From the seismotectonic study and published literature, a possible fault map of this en-tire Gujarat region has been prepared. Since earthquakes oc-curring at epicentral distances (i.e. distance between the city and epicenter of earthquake) greater than 250 km do not gen-erally cause structural damage, the faults located at a maxi-mum distance of 250 km from a particular site have been not considered as the tectonic features in the present study. A total of 40 major faults, along with major earthquake events which influence seismic hazard at Gujarat, habe been con-sidered in the present study (Fig. 5). A list of these faults is given in Table 2, describing the length of the faults and the controlling region assigned to them for seismic hazard com-putations.
5 Maximum magnitude determination
Table 2.Fault characteristics, weighting functions and maximum magnitude for faults used in Seismic Hazard Calculations.
Sr. No. Name Length αi xi Ni(m)0 β Rupture Bonilla Nowroozi Slemmons W&C Max Controlling
of fault in km Length (1984) (1984) (1982) (1994) magnitude region
= L/3
1 F18 137.34 0.151 0.217 0.063 0.960 45.78 7.76 7.06 7.03 7.01 7.01 Kachcha
2 F15 26.77 0.029 0.022 0.009 0.960 8.92 7.26 6.17 6.23 6.18 6.17 Kachcha
3 F12 126.36 0.139 0.087 0.039 0.960 42.12 7.74 7.01 6.99 6.96 6.96 Kachcha
4 F13 69.07 0.076 0.022 0.017 0.960 23.02 7.55 6.69 6.70 6.66 6.66 Kachcha
5 F25 59.55 0.066 0.022 0.015 0.960 19.85 7.51 6.61 6.62 6.59 6.59 Kachcha
6 F14 156.56 0.172 0.217 0.066 0.960 52.19 7.80 7.13 7.09 7.07 7.07 Kachcha
7 F19 131.38 0.145 0.130 0.047 0.960 43.79 7.75 7.03 7.01 6.98 6.98 Kachcha
8 F17 160.76 0.177 0.152 0.056 0.960 53.59 7.81 7.14 7.11 7.09 7.09 Kachcha
9 F21 40.87 0.045 0.130 0.030 0.960 13.62 7.39 6.40 6.44 6.40 6.40 Kachcha
10 F31 42.32 0.025 0.063 0.010 1.431 14.11 7.40 6.42 6.46 6.41 6.41 Mainland
11 F23 128.57 0.077 0.031 0.013 1.431 42.86 7.74 7.02 7.00 6.97 6.97 Mainland
12 F24 157.30 0.094 0.125 0.026 1.431 52.43 7.80 7.13 7.10 7.07 7.07 Mainland
13 F33 252.93 0.151 0.031 0.021 1.431 84.31 7.95 7.39 7.33 7.31 7.31 Mainland
14 F34 287.60 0.171 0.125 0.035 1.431 95.87 7.99 7.46 7.39 7.38 7.38 Mainland
15 F32 37.35 0.022 0.031 0.006 1.431 12.45 7.37 6.35 6.40 6.35 6.35 Mainland
16 F35 175.32 0.104 0.063 0.020 1.431 58.44 7.84 7.19 7.15 7.13 7.13 Mainland
17 F41 27.61 0.016 0.031 0.006 1.431 9.20 7.27 6.19 6.25 6.20 6.19 Mainland
18 F37 96.48 0.057 0.031 0.010 1.431 32.16 7.65 6.87 6.86 6.83 6.83 Mainland
19 F38 59.15 0.035 0.031 0.008 1.431 19.72 7.51 6.60 6.62 6.58 6.58 Mainland
20 F46 104.27 0.062 0.063 0.015 1.431 34.76 7.68 6.91 6.90 6.87 6.87 Mainland
21 F43 41.82 0.025 0.031 0.007 1.431 13.94 7.40 6.41 6.45 6.41 6.41 Mainland
22 F26 59.37 0.035 0.063 0.012 1.431 19.79 7.51 6.60 6.62 6.58 6.58 Mainland
23 F48 60.41 0.036 0.031 0.008 1.431 20.14 7.51 6.61 6.63 6.59 6.59 Mainland
24 F49 46.27 0.028 0.031 0.007 1.431 15.42 7.43 6.47 6.50 6.46 6.46 Mainland
25 F45 25.21 0.015 0.125 0.017 1.431 8.40 7.25 6.14 6.21 6.15 6.14 Mainland
26 F42 37.51 0.022 0.063 0.010 1.431 12.50 7.37 6.36 6.40 6.35 6.35 Mainland
27 F2 201.45 0.116 0.087 0.016 1.478 67.15 7.88 7.26 7.22 7.20 7.20 Saurashtra
28 F10 218.77 0.126 0.043 0.013 1.478 72.92 7.90 7.31 7.26 7.24 7.24 Saurashtra
29 F7 138.75 0.080 0.043 0.009 1.478 46.25 7.76 7.06 7.03 7.01 7.01 Saurashtra
30 F8 142.65 0.082 0.087 0.013 1.478 47.55 7.77 7.08 7.05 7.03 7.03 Saurashtra
31 F9 154.00 0.089 0.043 0.010 1.478 51.33 7.80 7.12 7.09 7.06 7.06 Saurashtra
32 F28 23.19 0.013 0.174 0.014 1.478 7.73 7.22 6.10 6.16 6.11 6.10 Saurashtra
33 F30 15.58 0.009 0.087 0.007 1.478 5.19 7.10 5.88 5.97 5.91 5.88 Saurashtra
34 F5 287.42 0.166 0.043 0.016 1.478 95.81 7.99 7.46 7.39 7.38 7.38 Saurashtra
35 F11 169.44 0.098 0.087 0.014 1.478 56.48 7.83 7.17 7.13 7.11 7.11 Saurashtra
36 F1 58.52 0.034 0.043 0.006 1.478 19.51 7.50 6.60 6.62 6.58 6.58 Saurashtra
37 F3 118.89 0.069 0.087 0.012 1.478 39.63 7.72 6.98 6.96 6.93 6.93 Saurashtra
38 F29 54.22 0.031 0.087 0.009 1.478 18.07 7.48 6.55 6.58 6.54 6.54 Saurashtra
39 F4 92.34 0.053 0.043 0.007 1.478 30.78 7.64 6.84 6.84 6.81 6.81 Saurashtra
40 F6 56.39 0.033 0.043 0.006 1.478 18.80 7.49 6.58 6.60 6.56 6.56 Saurashtra
Abbreviation: Wells and Coppersmith (1994) – W&C (1994).
each seismic zone. In this regard, there are two alternatives to choose from. One is the maximum historical earthquake procedure. In the standard rule-of-thumb practice, the max-imum historical earthquake is increased by half a magnitude unit or, through a recurrence relationship, is taken to yield the maximum magnitude (Nuttli, 1979). Nevertheless, this alternative is not applicable to all seismic source zones deter-mined in this study for the reasons: (a) all the faults mapped or determined as “active” in present study did not show any predominant activity during the past history; (b) those show-ing the seismic activity are very poorly known and far away from providing a reliable maximum magnitude earthquake determination because of uncertainties attributed to both in-strumental and historical records; (c) the accurate amount of
slip and slip rate or the fault rupture could not be obtained due to lack of historic instrumentations.
Fig. 5.The Fault map used in the present study.
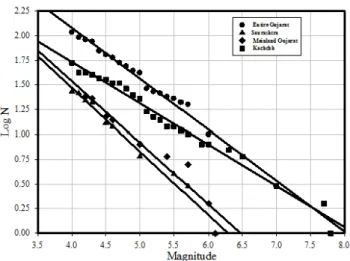
Fig. 6. Gutenberg-Richter frequency magnitude recurrence
rela-tionship for Kachchh, Saurashtra, Mainland regions and the entire region of Gujarat.
rupture length and using the relationship given by Bonilla et al. (1984), Nowroozi (1985), Slemmons et al. (1989) and Wells and Coppersmith (1984); the results are presented in Table 2. The minimum out of the estimated maximum mag-nitude is finally assigned to the particular fault as the maxi-mum magnitude for seismic hazard calculations.
6 Recurrence relations
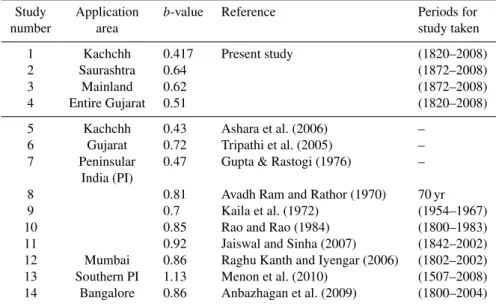
Using the prepared earthquake catalogue, the estimated Gutenberg-Richter (G-R) magnitude-frequency recurrence relationship for the three study areas is plotted in Fig. 6. In comparison to other studies on the seismic hazard for the Indian Peninsular shield (Table 3), the estimatedb-value is low in the present study. There are large variations in the
b-value reported by various researchers for peninsular India and the Gujarat region. It is very difficult to achieve agree-ment on one single value for the study. Tectonic earthquakes are characterized by theb-value from 0.5 to 1.5 and are more frequently around 1.0. In the present study, earthquakes less than Mw=4 are not included. Eliminating the big class
of the small earthquakes while fitting the Gutenberg-Richter (G-R) line may tend to flatten the line. As a result, the actual mean rate of small earthquakes will be underestimated and the mean rate of large earthquakes will be overestimated. A lowerb-value for Kachchh region may be due to the predom-inance of a few big earthquakes in the region and a higher
b-value for other region may be due to lack of significant numbers of big earthquakes. The uncertainty in theb-value is dealt with in the present study using the logic tree ap-proach with the selection of correspondingb-value and its weightage. In the present analysis, twob-values are selected, i.e. one corresponds to the study area obtained using the present study and the second one using the regionalb-value as reported by Jaiswal and Sinha (2007).
Furthermore, the occurrence of an earthquake in a seismic source is assumed to follow a Poisson’s distribution. The probability of the ground motion parameter (horizontal com-ponent of peak ground acceleration in present study) at a given site,Z to exceed a specified level, z, during a speci-fied time,T, is represented by the expression:
P (Z > z)=1−e−v(z)T≤v(z)T (1)
Where,v(z) is the mean annual rate of exceedance of ground motion parameter, Z with respect to z. Assuming that the Ni(m0)is the frequency of an earthquake on seismic source
i, having a magnitude higher than a minimum magnitude of m0(in present study it is taken as 4.0). The recurrence
rela-tion for each seismic source capable of producing an earth-quake magnitude in the range of m0(minimum magnitude) to
mmax(maximum magnitude assigned) was calculated using
the truncated exponential recurrence model (McGuire and Arabaz, 1990), given by the following expression
N (m0)=e
−β(m−m0)−e−β(mmax−m0)
1−e−β(mmax−m0) π
f orm0≤m≤mmax
(2)
Whereβ=Log10(b-value) (b-value is Gutenberg–Ritcher
pa-rameter, see Table 3).
6.1 Fault recurrence relations
Table 3.Comparison ofb-value for the Gujarat region to values reported by various researchers.
Study Application b-value Reference Periods for
number area study taken
1 Kachchh 0.417 Present study (1820–2008)
2 Saurashtra 0.64 (1872–2008)
3 Mainland 0.62 (1872–2008)
4 Entire Gujarat 0.51 (1820–2008)
5 Kachchh 0.43 Ashara et al. (2006) –
6 Gujarat 0.72 Tripathi et al. (2005) –
7 Peninsular 0.47 Gupta & Rastogi (1976) –
India (PI)
8 0.81 Avadh Ram and Rathor (1970) 70 yr
9 0.7 Kaila et al. (1972) (1954–1967)
10 0.85 Rao and Rao (1984) (1800–1983)
11 0.92 Jaiswal and Sinha (2007) (1842–2002)
12 Mumbai 0.86 Raghu Kanth and Iyengar (2006) (1802–2002)
13 Southern PI 1.13 Menon et al. (2010) (1507–2008)
14 Bangalore 0.86 Anbazhagan et al. (2009) (1800–2004)
Note: PI – Peninsular India
surface expression of faults and hence, reliable estimation of slip rates in order to model earthquake recurrence alterna-tively has also not been possible. In such situations, theb -value to the particular fault is empirically fixed considering the conservation of seismic activity in that particular region. Followed by Iyengar and Ghosh (2004), Raghu Kanth and Iyengar (2006), Anbazhagan et al. (2009) and Vipin et al. (2009), the regional recurrence relations are scaled down to fault recurrence relations by introducing a weighting fac-tor as given below:
Ni(m0)=Fi(m0)πe
−β(m−m0)−e−β(mmax−m0)
1−e−β(mmax−m0)
f orm0≤m≤mmax
(3) In whichFi(m0)is the weighting factor as given below:
Fi(m0)=0.5(αi+xi) (4)
Where αi and xi are the weighting factors for length and earthquake event, respectively, which are given as below. Considering the fact that a longer fault can produce a greater number of small events of magnitude m0than a shorter fault,
fault recurrence may be taken as being proportional to the length of the fault, leading to a simple weight factorαi as given below:
αi= Li 6Li
(5) WhereLi is the length of the fault i and6Li is the total fault length within the region under consideration. Further, the regional seismicity measured in terms of the number of earthquakes per year with m≥m0, should be equal to the
sum of such events the sum of such events occurring on indi-vidual faults for particular area under consideration. It is also
obvious that future activity will continue at seismic sources, at least in the short run, similar to past activity. Hence, ir-respective of its length, seismic activity of a fault should be related to the number of past events associated with it in the catalogue and it is given by
xi=
Number of earthquakes close to the fault
Total number of earthquakes in the region (6) Since the Gujarat region is divided into three control regions, it would be appropriate to use the control region specificb -value for individual faults. The above argument provides a basis for decomposing the regional hazard into fault rence relations. The weight factors and obtained fault recur-rence relation Ni(m0)are presented in Table 2. Based on the
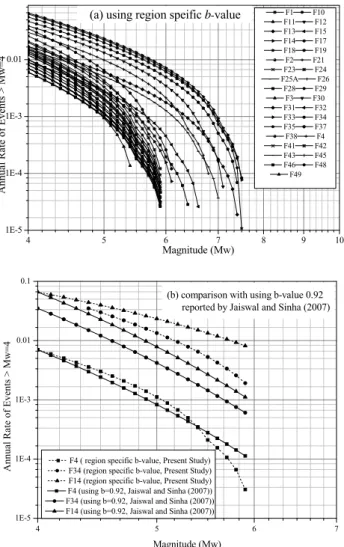
calculated parameters from Table 2, Fig. 6 and above dis-cussion, the fault recurrence relations using b-value calcu-lated in present study andb-value reported by Jaiswal and Sinha (2007), are calculated and graphically presented in Fig. 7.
7 Ground Motion Attenuation Relations (GMARs)
4 5 6 7 8 9 10 1E-5 1E-4 1E-3 0.01 A n n u al R ate of E v en
ts > Mw
=4
Magnitude (Mw)
F1 F10 F11 F12 F13 F15 F14 F17 F18 F19 F2 F21 F23 F24 F25A F26 F28 F29 F3 F30 F31 F32 F33 F34 F35 F37 F38 F4 F41 F42 F43 F45 F46 F48
F49
(a) using region speific b-value
)
4 5 6 7
1E-5 1E-4 1E-3 0.01 0.1 A nnual Ra te of Eve n ts > Mw=4 Magnitude (Mw)
F4 ( region specific b-value, Present Study) F34 (region specific b-value, Present Study) F14 (region specific b-value, Present Study) F4 (using b=0.92, Jaiswal and Sinha (2007)) F34 (using b=0.92, Jaiswal and Sinha (2007)) F14 (using b=0.92, Jaiswal and Sinha (2007))
(b) comparison with using b-value 0.92 reported by Jaiswal and Sinha (2007)
Fig. 7. Fault recurrence relations(a)usingb-value calculated in
present study(b)comparison with usingb-value 0.92 reported by
Jaiswal and Sinha (2007) for some selected faults.
relationships, several other approaches were also employed to have a chance for comparison. For shallow crustal earth-quakes, GMAR proposed by Abrahamson and Silva (1997) is applicable and used in the present study. The comparison made by Petersen et al. (2004) has revealed that the crustal intraplate relation of Frankel et al. (1996) yields ground mo-tions similar to the strong ground motion data recorded from the 2001 earthquake at large distances (Cramer and Wheeler, 2001). In the present study, we have also included the crustal intraplate GMARs given by Toro et al. (1997) and Frankel et al. (1996). The equations by Boore-Joyner-Fumal (1997), Campbell (1997) and Sadigh et al. (1997) representing the GMAR were also selected for comparison.
8 Uncertainty in Seismic Hazard
Epistemic uncertainties in the hazard computations have been accounted for within a logic-tree framework by
con-sidering the following controlling parameters: (1) assign-ing region specific the b-value based on the present study and based on reported by researchers, (2) the maximum cut-off magnitude in hazard computations, and (3) the GMARs. Within the hazard analysis, assignedb-value maximum cut-off magnitudes and GMARs have been assigned different weights, which are presented in logic tree form in Fig. 8.
The b-value assigned in hazard computation is selected based on the present study and the value reported by Jaiswal and Sinha (2007) with equal weightage. Owing to the recent study made and the time period used in the study carried out,
b-value = 0.92 given by Jaiswal and Sinha (2007) has been selected for the hazard computations. There are significant variations in reportedb-value (Table 3) and it is very difficult to assign different weightage for one over the other. Hence, equal weightage has been assigned to both the hazard com-putation framework, i.e.b-value calculated in present study andb-value = 0.92. It may be noted that the variation inb -value obtained in the present study based on the study area of the Gujarat region only is due to the difference in study area asb-value reported by Jaiswal and Sinha (2007) was for the whole of Peninsular India.
In the present study, the maximum cutoff magnitude is cal-culated based on empirical correlation using key fault param-eters (Fault length). As an alternative, each fault is assigned as the observed magnitude based on the past historic event within the nearby area. Equal weights have been assigned to the two different maximum magnitudes, as there is clearly no ground for choosing one alternative over the other. This is also in agreement that the present study is based on the fault map prepared, from which some of the faults may not be active and the maximum observed magnitude may give a reasonable idea about the current seismic activity in the re-gion.
Fig. 8.Logic Tree used in seismic hazard computations (figures in the bracket show the weightage assigned in seismic hazard computations) (Abbreviations: Raghu Kanth and Iyengar (2007) – RI07, Abrahamson and Silva (1997)– AS97, Frankel (1996) – F96, Toro et al. (1997) – T97, Boore-Joyner and Fumel (1997) – BJF97, Campbell (1997) – C97, Sadigh et al. (1997)– S97).
9 Deterministic seismic hazard computation
Seismic hazard analysis has been carried out using a deter-ministic approach. In the present deterdeter-ministic hazard calcu-lation, the seismic activity of seismic sources (fault sources) is specified by a recurrence relationship calculated, defining the cumulative number of events per year versus their mag-nitude. The distribution of earthquakes is assumed to be uni-form within the source zone and independent of time (Cor-nell, 1968). Each Fault source is characterized by the seis-micity parameters in terms of minimum and maximum mag-nitude and G-R earthquake recurrence rates as calculated in previous sections. Deterministic seismic hazard assessments carried out to identify maximum credible earthquake (MCE) and safe shutdown earthquake (SSE) that will affect a site. The shortest distance from vulnerable sources identified (Ta-ble 2) for the cities under consideration has been measured from the seismotectonic map. With these distances, maxi-mum moment magnitude assigned and uncertainty as per the logic tree, using GMARs, the horizontal component of peak ground acceleration has been calculated at bed rock level by assuming a focal depth of the earthquake of about 10 km from the surface.
Assuming the maximum credible earthquake (MCE) is the earthquake which imposes the most severe kind of loading the structure ever likely experience (design life of structure i.e. 50 yr), the probability of this level of earthquake at the site is low. The deterministic analysis pertaining to the 50th percentile ground motion is thought to represent MCE in the present study. The Safe Shutdown Earthquake, on the other hand, is thought to represent the severest earthquake in terms of magnitude at the site. An earthquake of this magnitude may not have occurred in the past, but this value is arrived at after investigation of past earthquakes, local geology (fault structure, distance from the fault etc.), and local underlying soil characteristics. The 84th percentile deterministic ground motion calculated represents the SSE in the present study.
10 Results and discussions
10.1 Deterministic scenarios and hazard computations
1E-4 1E-3 0.01 0.1 1 10 100 1E-13 1E-12 1E-11 1E-10 1E-9 1E-8 1E-7 1E-6 1E-5 1E-4 1E-3 0.01 0.1 1 10 Annua l Fr eq ue nc y of E x ce ed en ce
Peak Ground Acceleration (g)
Total Hazard F12 F13 F14 F17 F18 F19 F21 F23 F24 F26 F28 F31 F32 F33 F34 F35 F49 All Other Sources Spectral Response @ 5% Damping - Average Horizontal Component
Period = PGA
1
Fig. 9. Total hazard for the city of Ahmedabad obtained from the
contribution of fault sources.
1E-3 0.01 0.1 1 10 1E-13 1E-12 1E-11 1E-10 1E-9 1E-8 1E-7 1E-6 1E-5 1E-4 1E-3 0.01 0.1 1 A nnua l Fre que nc
y of Exc
ee
d
en
ce
Peak Ground Acceleration (g)
Total of mean hazard for each source Sources using Abra.-Silva (1997) Rock Sources using Boore-Joyner-Fumal (1997) Sources using Campbell (1997) Sources using Sadigh (1997) Rock Sources using Frankel (1996) Sources using Toro (1997)
Sources using Raghu Kanth & Iyengar (2007)
Period = PGA, Ahmedabad
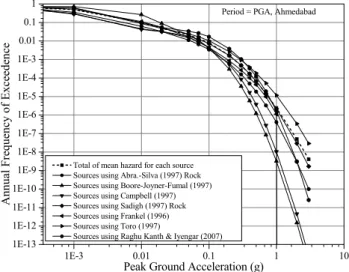
Fig. 10. Comparison of ground motion attenuation relations
(GMARs) computed using various models for total hazard for the city of Ahmedabad.
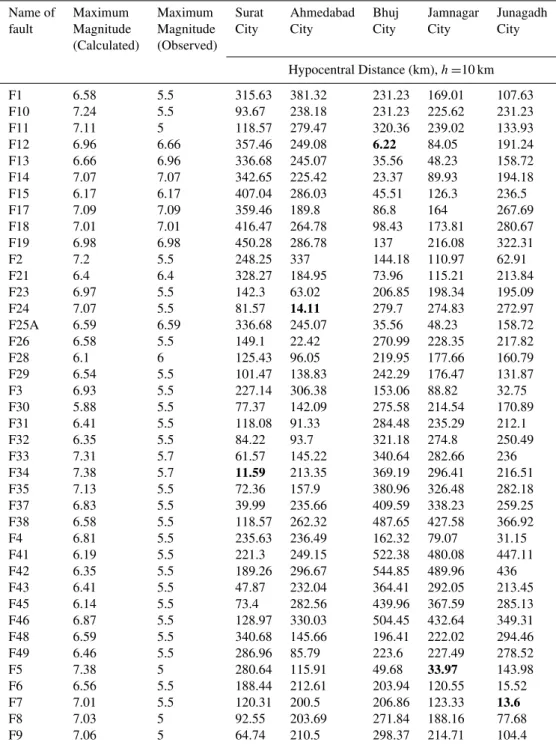
Credible Earthquake (MCE) is the largest earthquake that can be reasonably expected to occur with in the design life of a structure (based on geological evidence and earthquake history), this does not necessarily imply that it would also be the worst. The maximum earthquake magnitude calcu-lated and assigned earthquake to the faults as observed in the past history are also mentioned in Table 1. From Table 4 it is easy to pick the MCE and SSE for each site consider-ing the nearest fault producconsider-ing the largest ground motions. From the deterministic analysis it is found that for the cities of Surat, Ahmedabad, Bhuj, Jamnagar and Junagadh, fault numbers F34, F24, F12, F5 and F7 are the controlling faults,
respectively, owing to the shortest distance criteria. However in practice, structures are designed for ground motions, not earthquakes, so obtained deterministic scenario earthquakes should be obtained in the form of worst-case ground motion and not just a maximum magnitude-distance pair. In order to estimate reliable ground motions, a probabilistic framework is further used to compute the hazard contribution exceeding a certain level offered by each fault due to all possible future activities on the faults as visualized by the typical hazard sce-nario presented for Ahmedabad city in Fig. 9. From Fig. 9, it is clear that hazard contributions from fault numbers F26, F24 and F13 are maximum compared to the other faults for Ahmedabad city. In order to compare all the GMARs used in estimating the ground motions at site, a typical compari-son for the city of Ahmedabad is presented in Fig. 10. From Fig. 10 it can be observed that the GMAR given by Camp-bell (1997) gives the highest hazard for Ahmedabad com-pared to all other GMARs used. However, all the GMARs are comparable and no significant variations in the estimated hazard have been observed as shown in Fig. 10.
The total hazard obtained from all the sources for a par-ticular site is typically presented in Fig. 11. It is quite clear that out of the five cities studied, Bhuj has the highest hazard compared to all the others. Surat has higher hazard com-pared to Ahmedabad, being very close to the Narmada Son Lineaments. Although the hazard for the cities of Jamna-gar and Junagadh are more or less the same, JamnaJamna-gar city has the lowest seismic hazard compared to all other cities. The finally-computed deterministic seismic scenarios for the cities are presented in terms of magnitude and distance pairs in Table 5. It is notable that these deterministic scenarios are not fact or do not belong to any particular fault, but ground motion computed using these scenarios can produce the same level of ground motion which can be expected at a given site.
10.2 Development of deterministic hazard spectra
Table 4. Deterministic scenarios for various cities under consideration in the present study.
Name of Maximum Maximum Surat Ahmedabad Bhuj Jamnagar Junagadh
fault Magnitude Magnitude City City City City City
(Calculated) (Observed)
Hypocentral Distance (km),h=10 km
F1 6.58 5.5 315.63 381.32 231.23 169.01 107.63
F10 7.24 5.5 93.67 238.18 231.23 225.62 231.23
F11 7.11 5 118.57 279.47 320.36 239.02 133.93
F12 6.96 6.66 357.46 249.08 6.22 84.05 191.24
F13 6.66 6.96 336.68 245.07 35.56 48.23 158.72
F14 7.07 7.07 342.65 225.42 23.37 89.93 194.18
F15 6.17 6.17 407.04 286.03 45.51 126.3 236.5
F17 7.09 7.09 359.46 189.8 86.8 164 267.69
F18 7.01 7.01 416.47 264.78 98.43 173.81 280.67
F19 6.98 6.98 450.28 286.78 137 216.08 322.31
F2 7.2 5.5 248.25 337 144.18 110.97 62.91
F21 6.4 6.4 328.27 184.95 73.96 115.21 213.84
F23 6.97 5.5 142.3 63.02 206.85 198.34 195.09
F24 7.07 5.5 81.57 14.11 279.7 274.83 272.97
F25A 6.59 6.59 336.68 245.07 35.56 48.23 158.72
F26 6.58 5.5 149.1 22.42 270.99 228.35 217.82
F28 6.1 6 125.43 96.05 219.95 177.66 160.79
F29 6.54 5.5 101.47 138.83 242.29 176.47 131.87
F3 6.93 5.5 227.14 306.38 153.06 88.82 32.75
F30 5.88 5.5 77.37 142.09 275.58 214.54 170.89
F31 6.41 5.5 118.08 91.33 284.48 235.29 212.1
F32 6.35 5.5 84.22 93.7 321.18 274.8 250.49
F33 7.31 5.7 61.57 145.22 340.64 282.66 236
F34 7.38 5.7 11.59 213.35 369.19 296.41 216.51
F35 7.13 5.5 72.36 157.9 380.96 326.48 282.18
F37 6.83 5.5 39.99 235.66 409.59 338.23 259.25
F38 6.58 5.5 118.57 262.32 487.65 427.58 366.92
F4 6.81 5.5 235.63 236.49 162.32 79.07 31.15
F41 6.19 5.5 221.3 249.15 522.38 480.08 447.11
F42 6.35 5.5 189.26 296.67 544.85 489.96 436
F43 6.41 5.5 47.87 232.04 364.41 292.05 213.45
F45 6.14 5.5 73.4 282.56 439.96 367.59 285.13
F46 6.87 5.5 128.97 330.03 504.45 432.64 349.31
F48 6.59 5.5 340.68 145.66 196.41 222.02 294.46
F49 6.46 5.5 286.96 85.79 223.6 227.49 278.52
F5 7.38 5 280.64 115.91 49.68 33.97 143.98
F6 6.56 5.5 188.44 212.61 203.94 120.55 15.52
F7 7.01 5.5 120.31 200.5 206.86 123.33 13.6
F8 7.03 5 92.55 203.69 271.84 188.16 77.68
F9 7.06 5 64.74 210.5 298.37 214.71 104.4
damping is specifically selected to compare the results of the present study with the provisions made in IS:1893- Part I (2002). The comparison of the obtained spectra for b -value obtained from the present study andb-value reported by Jaiswal and Sinha (2007), are presented in Fig. 12. The comparisons confirm that the higher ground motions are pro-duced for theb-value = 0.92 whereas spectra corresponds to theb-value from the present study gives comparatively lesser ground motions. The difference is very less for Bhuj city and
observed to be highest for Ahmedabad city compared to all other cities studied. A significant difference is observed in the PGA value obtained by both theb-value approach. The calculated ground motions in terms of the horizontal compo-nent for spectral response at 5 % damping for the few periods are tabulated in Table 6.
1E-4 1E-3 0.01 0.1 1 10 1E-7
1E-6 1E-5 1E-4 1E-3 0.01 0.1 1
Spectral response @ 5% damping-average horizontal component
An
n
u
al Fr
eq
u
en
cy o
f Ex
ceed
en
ce
Peak Ground Acceleration (g) Ahmedabad
Surat Bhuj Jamnagar Junagadh
Fig. 11. Total Hazard calculated for various cities at zero spectral period i.e. PGA.
Junagadh being higher than Jamnagar. This is also consis-tent with recent activities as described by Yadav et al. (2010) in the Talala region very close to Junagadh. In the same way, Surat and Ahmedabad cities are sharing same tectonic con-trol region as per the present study, but the calculated PGA for Surat city is slightly higher than for Ahmedabad. This is possibly due to the proximity of Surat city to the Narmada Son lineaments, considered to be a controlling fault for the city of Surat.
It is interesting to note that for the Bhuj region, the esti-mated PGA are in order of 0.64 to 1.04 g corresponding to
b-value studied. Parvez et al. (2003) and Hough et al. (2002) has predicted near field ground motion of approximately 0.8 g for the Kachchh areas for the Bhuj 2001 earthquake which compared well with our present results. During the re-cent excavations at Bet Dwarka, in the Gulf of Kachchh, Ra-jendran et al. (2003) identified a seismically generated sand blow that has disrupted an ancient cultural horizon. The age data suggested that the causative earthquake may have oc-curred about 2000 years ago. While the source of this earth-quake remains constrained, its timing seems to be singular; studies elsewhere in Kachchh have not disclosed any feature of a comparable age as yet. Their study opens the possibility for another surprise source, and may be adding a new dimen-sion to the seismic hazard of the entire Gujarat region.
10.3 Comparison with IS: 1893 – Part I (2002) spectra
Several researchers had carried out studies on seismic zoning of India even before the publication of the first zoning map by the Bureau of Indian Standards in 1962. The early seis-mic maps were qualitative in nature and demarcated the ar-eas of severe, moderate, light etc. damages (Krishna, 1959). The later studies quantified the seismic zones on the basis of
Modified Mercalli Intensity levels, similar to the IS code zon-ing (Guha, 1962). Updatzon-ing has been marginally done only after the occurrence of large and damaging earthquakes (e.g.,
Mw=6.3 Koyna;Mw=7.7 Bhuj, 2001). It is observed that
the zoning prescribes a lower hazard for the regions without significant records of historical earthquakes and revisiting af-ter the occurrence of damaging earthquakes. In addition, this map does not portray the seismic hazard at different loca-tions and suffers from the weakness of assessing the return periods of postulated design seismic coefficients for various zones. Large magnitude earthquake may be expected in the region where not many earthquakes have occurred and seis-mic hazard at a site is controlled by all earthquakes expected to occur (including future) during the life of a structure in the area surrounding the site, and not only by the largest magni-tude earthquake. In this paper, a comparison has been made between the compared spectra obtained in the present study with the IS: 1893-Part I (2002)-specified spectra for the cities studied. The PGA specified by IS:1893-Part I (2002) is com-pared with the obtained PGA value for the 50th percentile and 84th percentile as shown in Fig. 13.
Table 5.Deterministic magnitude-distance pair for hazard-producing ground motion exceeding 0.2 g.
City Model Hazard (producing Mean magnitude Distance
ground motion (Mw) (km)
exceeding 0.2 g)
Ahmedabad b-value (present study) 0.00164 5.11 15.88
b-value = 0.92 0.00152 5.29 15.70
Surat b-value (present study) 0.00356 5.05 11.81
b-value = 0.92 0.00293 5.04 12.45
Bhuj b-value (present study) 0.02230 5.52 12.56
b-value = 0.92 0.01240 4.81 8.33
Jamnagar b-value (present study) 0.00069 6.57 69.27
b-value = 0.92 0.000173 6.17 51.83
Junagadh b-value (present study) 0.00075 5.04 22.87
b-value = 0.92 0.00088 5.33 18.89
Table 6.Deterministic seismic 1 spectral ordinates for few reference periods.
Location b-value Deterministic Period (s)
Percentile
PGA 0.20 0.50 1.00
Ahmedabad
0.62* (50-percentile) 0.13 0.22 0.09 0.04
0.92# 0.48 0.86 0.58 0.36
0.62* (84-percentile) 0.23 0.39 0.17 0.07
0.92 0.78 1.41 0.96 0.58
Surat
0.62* (50-percentile) 0.15 0.26 0.11 0.04
0.92 0.35 0.61 0.35 0.18
0.62* (84-percentile) 0.26 0.45 0.20 0.08
0.92 0.57 1.02 0.59 0.31
Bhuj
0.417* (50-percentile) 0.64 1.09 0.61 0.31
0.92 0.75 1.46 1.02 0.61
0.417* (84-percentile) 1.08 1.85 1.04 0.54
0.92 1.26 2.44 1.69 1.00
Jamnag
ar 0.64*0.92 (50-percentile) 0.140.27 0.260.52 0.180.40 0.110.28
0.64* (84-percentile) 0.24 0.45 0.31 0.19
0.92 0.45 0.88 0.66 0.46
Junag
adh
0.64* (50-percentile) 0.20 0.34 0.17 0.08
0.92 0.45 0.81 0.54 0.33
0.64* (84-percentile) 0.34 0.59 0.30 0.14
0.92 0.73 1.32 0.89 0.53
0.01 0.1 1 10
Se
pe
ctral Acc
elera
tion (g)
(50-percentile) -b-value present study (84-percentile) -b-value present study (50-percentile) -b-value=0.92 (84-percentile) -b-value=0.92 Ahmedabad
Spectral response @ 5% damping
0.01 0.1 1 10
Se
pe
ctral Acc
elera
tion (g)
Spectral response @ 5% damping
Surat
0.01 0.1 1 10
Bhuj
Se
pec
tra
l Ac
ce
le
ration
(g)
Spectral response @ 5% damping
0.01 0.1 1 10 0.01
0.1 1 10
Jamnagar
S
ep
ec
tra
l A
cce
le
rat
ion (
g
)
Period (s) Spectral response @ 5% damping
0.01 0.1 1 10
Junagadh
Sepe
ctral Acc
elera
tion (g)
Period (s) Spectral response @ 5% damping
Fig. 12.Deterministic spectra obtained for various cities with differentb-values. The ground accelerations are plotted in unit of 5 % damped
acceleration response spectrum as a function of period for differentb-values at particular site location.
11 Conclusions
In order to be consistent with the other seismic codes world-wide and to cater to performance based seismic design approaches, it is necessary to develop regional seismic haz-ard maps/scenarios consistent with the local seismotectonic setting. The present study is the first step towards developing a state-of-the-art seismic hazard map for one of the most ac-tive regions of Peninsular India and forms a sound basis for future extension of the site-specific studies of the control-ling regions. To estimate seismic ground motions for the few commercial hubs of the state of Gujarat, India, the
0.01 0.1 1 10
Sep
ect
ra
l A
ccel
er
at
io
n
(
g
)
(50-percentile) (84-percentile) IS:1893 (2002)
Spectral response @ 5% damping
Ahmedabad
0.01 0.1 1 10
Surat
Spectral response @ 5% damping
S
ep
ec
tr
al Acceleratio
n
(
g
)
0.01 0.1 1 10
Bhuj
Spectral response @ 5% damping
S
epe
ct
ra
l A
cc
ele
ra
tion
(g)
0.01 0.1 1 10
0.01 0.1 1 10
Jamnagar
Spectral response @ 5% damping
S
ep
ect
ra
l Acceler
a
tio
n
(
g
)
Period (s)
0.01 0.1 1 10
0.01 0.1 1 10
Junagadh
Spectral response @ 5% damping
Sep
ect
ra
l A
cce
le
ra
ti
o
n
(
g
)
Period (s)
Fig. 13. 50th percentile deterministic hazard spectra for five cities in Gujarat, India. The ground accelerations are plotted in unit of 5 %
damped acceleration response spectrum as a function of period and its comparison with IS:1893-Part I (2002) specified spectra for seismic design of structures at particular site location.
comparatively lower for the Saurashtra and Mainland regions of Gujarat State. The most vulnerable site is Bhuj city as it is very close to the most active faults in the state of Gujarat. It has also been observed that the calculated hazard is sensitive to theb-value. The variation in hazard computed with respect tob-value is highest for Ahmedabad city and lowest for Bhuj city. Based on the present study, the recommended PGA val-ues for the cities studied are 0.13 g, 0.15 g, 0.64 g, 0.14 g and 0.2 g for Ahmedabad city, Surat city, Bhuj city, Jamnagar city and Junagadh city, respectively. Deterministic spectra have been prepared for each major city for the 50th and 84th percentiles of ground motion occurrence in order to aid the
The proposed spectra for the various major cities offer practical value to the engineers for seismic design of struc-tures. The users of the proposed spectra should be cau-tious that the spectra presented in the present study are for the bedrock level. It is necessary to carry out site response analysis for the sites underlain by soil to compute the maxi-mum horizontal ground acceleration required for the design of earthquake- resistant structures. It is also noteworthy that earthquake return periods are not presently addressed in this study and that the fault recurrence relations are obtained em-pirically from the regional recurrence further calculated from the earthquake catalogue for Mw≥4. Furthermore, it is
planned to develop probabilistic seismic hazard maps for the Gujarat region and site-specific spectra for a few critical lo-cations to help safe and economical planning.
Acknowledgements. Authors are grateful to two anonymous
reviewers for the constructive comments that enhanced the quality of the paper.
Edited by: M. E. Contadakis
Reviewed by: two anonymous referees
References
Abrahamson N. A. and Silva W. J.: Empirical Response Spectral Attenuation Relations for Shallow Crustal Earthquakes, Seismol. Res. Lett., 68, 1, 94–127, 1997.
Anbazhagan P., Vinod, J. S., and Sitharam, T. G.: Probabilistic seis-mic hazard analysis for Bangalore, Nat. Hazards, 48, 2, 145–166, 2009.
Ashara L. V., Patel J. N., Abdul Hamid, Srivastava, S., and Ku-mar, S.: Broadband seismic network for Gujarat, Proc. of 13th Symposium on Earthquake Engineering, IIT Roorkee, 1, 52–57, 2006.
Avadh Ram and Rathor, H. S.: On Frequency Magnitude and En-ergy of Significant Indian Earthquakes, Pure Appl. Geophys., 79, 26–32, 1970.
Bapat, A., Deshpande N. V., Das P. B., and Bhavnarayana, V.:Pre-impoundment seismicity studies around Sardar Sarovar Site, CBIP 55, R&D Session, 1989.
Bendick, R., Bilham, R., Fielding, E., Gaur, V.K., Hough, S.E.,Kier, G., Kulkarni, M.N., Martin, S., Mueller, K., and Mukul, M.: The January 26, 2001 Republic Day Earthquake, India, Seismol. Res. Lett., 72, 328–335, 2001.
Bhatia, S. C., Kumar, R., and Gupta, H. K.: A probabilistic seis-mic hazard map of India and adjoining regions, Ann. Geofis., 42, 1153–1164, 1999.
Bhattacharya, S. N., Karanth, R. V., Dattatryam, R. S., and Sohoni, P. S.: Earthquake sequence in and around Bhavnagar, Saurash-tra, western India during August-December 2000 and associated tectonic features, Curr. Sci. India, 86, 25, 2004.
Bilham R., Gaur V. K., and Molnar, P.: Himalayan seismic risk, Science, 293, 1442–1444, 2001.
Bilham, R.: Earthquakes in India and the Himalaya: tectonics, geodesy and history, Ann. Geophys., 47, 2/3, 2004,
http://www.ann-geophys.net/47/2/2004/.
Biswas, S. K. and Deshpande, S. V. :Geological and tectonic maps of Kutch, ONGC Bull., 1970, 7, 115–116, 1970.
Biswas, S. K.: Rift basins in western margin of India and their hy-drocarbon prospects with special reference to Kutch basin, Am. Assoc. Petr. Geol. B., 66, 1, 497–1,513, 1982.
Biswas S. K.: Regional tectonic framework, structure and evolution of the western marginal basins of India, Tectonophysics, 135, 307–327, 1987.
Biswas, S. K.: A review of structure and tectonics of Kutch basin, western India, with special reference to earthquakes, Current Since, 88, 10 1592–1600, 2005.
Bonilla, M. G., Mark, R. K., and Lienkaemper, J. J.: Statistical relations among earthquake magnitude, surface rupture length and surface fault displacement, Bull. Seism. Soc. Am, 74, 2379– 2411, 1984.
Boore, D. M., Joyner, W. B. and Fumal, T. E.: Equations from esti-mating horizontal response spectra and peak acceleration from Western North American earthquakes: a summary of recent work, Seismol. Res. Lett., 68, 128–153, 1997.
Campbell, K. W.: Empirical Near-Source Attenuation Relation-ships for Horizontal and Vertical Components of Peak Ground Acceleration, Peak Ground Velocity, and Pseudo-Absolute Ac-celeration Response Spectra, Seismol. Res. Lett., 68, 1, 154–179, 1997.
Cramer, C. H. and Wheeler, R. L.: The 2001 Gujarat, India earth-quake and seismic hazard in Central and Eastern North America, Abstr. Seismol. Res. Lett., 72, 396, 2001.
Chandra, U.: Earthquakes of peninsular India-A seismotectonic study, Bull. Seismol. Soc. Am., 67, 1387–1413, 1977.
Chopra Sumer, Dinesh Kumar., and Rastogi, B. K. : Estimation of
strong ground motions for 2001 Bhuj (Mw=7.6), India
earth-quake, Pure Appl. Geophys. Earth and Env. Sci., 167, 1317– 1330, 2010.
Choudhury, D. and Shukla, J.: Probability of occurrence and study of earthquake recurrence models for Gujarat state in India, Dis. Adv., 4, 47–59, 2011.
Chung, W. Y.: Source parameters of two rif-associated intraplate earthquakes in peninsular India: the Bhadrachalam earthuake of April 13, 1969 and the Broach earthquake of March 23, 1970, Tectonophysics, 225, 219–230, 1993.
Chung, W. Y. and Gao, H.: Source parameter of the Anjar earth-quake of July 21, 1956, India, and its seismotectonic implications for the Kutch rift basin, Tectonophysics, 242, 281–292, 1995. Cornell, C. A.: Engineering Seismic Risk Analysis, Bull. Seism.
Soc. Am., 58, 5, 1583–1606, 1968.
Frankel, A., Mueller, C., Barnhard, T., Perkins, D., Leyendecker, E. V., Dickman, N., Hanson, S., Hopper, M., :National seismic haz-ard maps: documentation June 1996,. Open-File Report (United States Geological Survey), 96-532, 41, 1996.
Gaur, V. K. and Chauhan, R. K. S.: Quantitative measures of seis-micity applied to Indian regions, Bull Indian, Soc. Earth. Tech., 5, 63–78, 1968.
Guha S. K. and Basu, P. C.: Catalogue of earthquake (M>3) in Peninsular India, Atomic Energy Regaulatory Board, Tech Doc-ument No. TD/CES-1, 1–70, 1993.
Gupta, H. K. and Rastogi, B. K.: Dams and Earthquakes, Elsevier, Amsterdam, 229, 1976.
Gutenberg B. and Richter, C. F.: Frequency of earthquakes in Cali-fornia, Bull. Seism. Soc. Am., 34, 185–188, 1944.
GSI: Seismotectonic Atlas of India and its Environs, Geological Survey of India, Spec. Publ. No., 59, Kolkatta, 2000.
Hough, S. E., Martin, S., Bilham, R., and Atkinson, G. M.: The 26 January 2001, M 7.6 Bhuj, India, earthquake: observed and pre-dicted ground motions, Bull. Seism. Soc. Am., 92, 2061–2079, 2002.
IS:1893-Part-I, Criteria for Earthquake Resistant Design of Struc-tures, Bureau of Indian Standard, New Delhi, India, 2002. Iyengar, R. N., Sharma, D., and Siddiqui, J. M.: Earthquake history
of India in medieval times, Indian J. Hist. Sci., 3, 181–237, 1999. Iyengar, R. N. and Ghosh, S.: Microzonation of earthquake hazard in greater Delhi area, Current Sci. India, 87, 1193–1202, 2004. Iyengar, R. N. and Rghu Kanth, S. T. G.:Attenuation of ground
mo-tion in Peninsular India, Seismol. Res. Lett., 79, 67–81, 2004. Jaiswal, K. and Sinha, R.: Probabilistic seismic-hazard estimation
for peninsular India, Bull. Seismol. Soc. Am., 1, 318–330, 2007. Johnston, A. C. and Kanter, L. R.: Earthquakes in stable continental
crust, Sci. Am., 262, 69–75, 1990.
Johnston, A. C.: Compression tectonics in failed continental rifts: the India Republic Day and 7 February 1812 New Madrid earth-quakes, Abstr. Seismol. Res. Lett., 72, 398, 2001.
Kaila, K. L., Gaur, V. K., and Hari Narain: Quantitative seismicity maps of India, B. Seismol. Soc. Am., 62(5), 1119–1132, 1972. Kaila, K. L., Krishna V. G., and Mall, D. M.:Crustal structures
along Mehmadabad – Billimora profile in the Cambay basin, In-dia, from deep seismic soundings, Tectonophysics, 76, 99–130, 1980.
Karanth ,R. V. and Sant, D. A.: Lineaments and dyke swarms of lower Narmada Valley and southern Saurashtra, western India, J. Geol. Soc. India, 33, 425–434, 1995.
Khattri, K. N., Rogers, A. M., Perkins, D. M., and Algermissen, S. T.: A Seismic Hazard Map of India and Adjacent Areas, Tectoni-physics, 108, 93–134, 1984.
Krinitzsky, E. L.: How to obtain earthquake ground motions for engineering design, Engrg. Geol., 65, 1–16, 2002.
Krinitzsky, E. L.: Deterministic versus probabilistic seismic hazard analysis for critical structures, Internat. J. Eng. Geol., 40, 1–7, 1995.
Lettis, W. R. and Hengesh, J. V.: Preliminary observation on the ori-gin and effects of the January 26, 2001 Republic Day earthquake, India 2001, Seismol. Res. Lett. 72, 396, 2001.
Malik, J. N., Sohoni, P. S., Karanth, R. V., and Merh, S. S.:Modern and Historic Seismicity of KachchhPeninsula, Western India, J. Geol. Soc. India, 54 545–550, 1999.
Mark, R. K.: Application of linear statistical model of earthquake magnitude versus fault length in estimating maximum expectable earthquakes, Geology, 5, 464–466, 1977.
Menon, A., Ornthammarath, T., Corigliano, M., and Lai, C. G. : Probabilistic seismic hazard macrozonation of Tamil Nadu in Southern India,BSSA, 100, 3, 1320–1341, 2010.
Nowroozi, A. A.: Emperical relations between magnitudes and fault parameters for earthquakes in Iran,Bull. Seism. Soc. Amer., 75, 1327–1338, 1985.
Nuttli, O. W.: Seismicity of the central United States, Geological Society of America, Rev. Eng. Geol., 4, 67–93, 1979.
Oldham, T. :A catalogue of Indian earthquakes from the earliest time to the end of A.D. 1869, Mem Geol. Surv. India 19, 53,
1883.
Parvez, A. I., Franco Vaccari, and Panza, G. F.: A deterministic seismic hazard map of India and adjacent areas, Geophys. J. In-ternat., 155, 489–508, 2003.
Petersen, M. D., Rastogi, B. K., Schweig, G. E.S., Harmsen, S. C., and Gomberg, J. S.: Sensitivity analysis of seismic hazard for the northwestern portion of the state of Gujarat, India, Tectono-physics, 390, 105–115, 2004.
Quittmeyer, R. C. and Jacob, K. H.: Historical and modern seismic-ity of Pakistan, Afghanistan, northwestern India, and southeast-ern Iran, Bull. Seismol. Soc. Am. 69 (3), 773–823, 1979. Rajendran, C. P. and Rajendran, K.: Characteristics of
deforma-tion and past seismicity associated with the 1819 Kutch earth-quake, Northwestern India, Bull. Seismol. Soc. Am., 91, 407– 426, 2001.
Rajendran, K., Rajendran, C. P., Thakkar, M., and Tuttle, M.: The 2001 Kutch (Bhuj) earthquake: Coseis- mic surface features and their significance, Curr. Sci. India, 80, 1397–1405, 2001. Rajendran, C. P., Rajendran, K., Vora, K. H., and Gaur, A. S.: The
odds of a seismic source near Dwarka, NW Gujarat: An evalua-tion based on proxies, Current Sci. India, 84, 5, 695–701, 2003. Rao, B. R. and Rao, P. S.: Historical seismicity of peninsular India,
B. Seismol. Soc. Am., 74, 2519–2533, 1984.
Rastogi, B. K.: Ground deformation study of Mw7.7 Bhuj
earth-quake of 2001, Episode, 24 (3), 160–165, 2001.
Rastogi, B. K.: Damage due to the Mw7.7 Kutch, India earthquake
of 2001, Tectonophysics, 390, 85–103, 2004.
Raghu Kanth, S. T. G., and Iyengar, R. N.: Seismic hazard estima-tion for Mumbai city, Curr. Sci. India, 11, 1486–1494, 2006. Raghu Kanth, S. T. G. and Iyengar, R. N.: Estimation of seismic
spectral acceleration in peninsular India, J. Earth Sys. Sci., 3, 199–214, 2007.
Rao, Buddha Ramalineswara: Historical seismicity and deforma-tion rates in the Indian Peninsular Shild, J. Seismology, 4, 247– 258, 2000.
Ravi Kumar, M. and Bhatia, S. C.: A new seismic hazard map for the Indian plate region under the global seismic hazard assess-ment programme, Current Sci. India, 77 (3), 447–453, 1999. Schweig, III, E., Gomberg, J., Petersen, M., Ellis, M., Bodin, P.,
Mayrose, L., and Rastogi, B. K.: The M 7.7 Bhuj earthquake: global lessons for earthquake hazard in intra-plate regions, J. Geol. Soc. India, 61, 277–282, 2003.
Sadigh, K., Chang, C. Y., Egan, J. A., Makdisi, F., and Youngs, R. R.: Attenuation relations for shallow crustal earthquakes based on California strong motion data, Sesmol. Res. Lett. I(68), 180– 189, 1997.
Seed, H. B.: The selection of design earthquake for critical struc-tures, Bull. Seism. Soc. Am., 72, 74–89, 1982.
Sitharam, T. G. and Anbazhagan, P.: Seismic Hazard Analysis for the Bangalore Region, Nat. Hazards, 40, 261–278, 2007. Slemmon, D. B.: Determination of earthquake size from surface
faulting events, Proc. Inter. Seminar on Seismic Zoning, China, 1989.
Sukhtankar, R. K., Pandian, R. S., and Guha, S. K.: Seismotec-tonic studies of coastal areas of Inida, Pakistan, Bangladesh and Burma, Nat. Hazards, 7, 201–210, 1993.
Tandon, A. N. and Srivasta, H. N.: Earthquake occurrences in India, Earthquake Engineering, Jai Krishna Volume, Sarita Prakashan (publ.), 1–48, 1974.
Tandon, A. N.: The rann of Kutch earthquake of 21st July 1956, Indian J. Met. Geophys., 10, 137–146, 1959.
Thakur, V. C. and Wesnousky, S. G.: Seismotectonics of 26 January 2001 Bhuj earthquake affected region, Current Sci. India, 82, 4, 396–399, 2002.
Tripathi, J. N.: Probabilistic assessment of earthquake recurrence in the January 26, 2001 earthquake region of Gujarat, India, J. Seismol., 10, 119–130, 2006.
Toro, G. R. Abrahamson, N. A., and Schneider, J. F.: Model of strong ground motions from earthquakes in central and eastern North America: best estimates and uncertainties, Seismol. Res. Lett., 68, 41–58, 1997.
Tinti, S. and Mulargia, F.: Completeness analysis of a seismic cata-log, Ann. Geophys., 407–414, 1985.
Vipin, K. S., Anbazhagan, P., and Sitharam, T. G.: Estimation of peak ground acceleration and spectral acceleration for South In-dia with local site effects: probabilistic approach, Nat. Hazards Earth Syst. Sci., 9, 865–878, 2009,
http://www.nat-hazards-earth-syst-sci.net/9/865/2009/.
Yadav, R. B. S., Tripathi, J. N., Rastogi, B. K., and Chopra, S.: Probabilistic Assessment of Earthquake Hazard in Gujarat and Adjoining Regions of India, Pure Appl. Geophys., 165, 1813– 1833, 2008.
Yadav, R. B. S., Papadimitriou, E. E., Karakostas, V. G., Shanker, D., Rastogi, B. K., Chopra, S., Singh, A. P., and Kumar, Santosh: The 2007 Talala, Saurashtra, western India earthquake sequence: Tectonic implications and seismicity triggering”, J. Asian Earth Sci., 2010.