www.nat-hazards-earth-syst-sci.net/6/927/2006/ © Author(s) 2006. This work is licensed under a Creative Commons License.
and Earth
System Sciences
Use of remote sensing and seismotectonic parameters for seismic
hazard analysis of Bangalore
T. G. Sitharam1, P. Anbazhagan1, and K. Ganesha Raj2
1Department of Civil Engineering, Indian Institute of Science, Bangalore – 560012, India 2NNRMS/EOS, ISRO Hq, Antariksh Bhavan, New BEL Road, Bangalore – 560094, India
Received: 9 June 2006 – Revised: 23 October 2006 – Accepted: 23 October 2006 – Published: 26 October 2006
Abstract. Deterministic Seismic Hazard Analysis (DSHA) for the Bangalore, India has been carried out by consider-ing the past earthquakes, assumed subsurface fault rupture lengths and point source synthetic ground motion model. The sources have been identified using satellite remote sens-ing images and seismotectonic atlas map of India and rel-evant field studies. Maximum Credible Earthquake (MCE) has been determined by considering the regional seismotec-tonic activity in about 350 km radius around Bangalore. The seismotectonic map has been prepared by considering the faults, lineaments, shear zones in the area and past mod-erate earthquakes of more than 470 events having the mo-ment magnitude of 3.5 and above. In addition, 1300 num-ber of earthquake tremors having moment magnitude of less than 3.5 has been considered for the study. Shortest distance from the Bangalore to the different sources is measured and then Peak Horizontal Acceleration (PHA) is calculated for the different sources and moment magnitude of events us-ing regional attenuation relation for peninsular India. Based on Wells and Coppersmith (1994) relationship, subsurface fault rupture length of about 3.8% of total length of the fault shown to be matching with past earthquake events in the area. To simulate synthetic ground motions, Boore (1983, 2003) SMSIM programs have been used and the PHA for the dif-ferent locations is evaluated. From the above approaches, the PHA of 0.15 g was established. This value was obtained for a maximum credible earthquake having a moment magnitude of 5.1 for a source Mandya-Channapatna-Bangalore linea-ment. This particular source has been identified as a vulner-able source for Bangalore. From this study, it is very clear that Bangalore area can be described as seismically mod-erately active region. It is also recommended that southern part of Karnataka in particular Bangalore, Mandya and Ko-lar, need to be upgraded from current Indian Seismic Zone II
Correspondence to:T. G. Sitharam ([email protected])
to Seismic Zone III. Acceleration time history (ground mo-tion) has been generated using synthetic earthquake model by considering the revised regional seismotectonic parameters. The rock level PHA map for Bangalore has been prepared and these maps are useful for the purpose of seismic micro-zonation, ground response analysis and design of important structures.
1 Introduction
VIDHANA SAUDHA
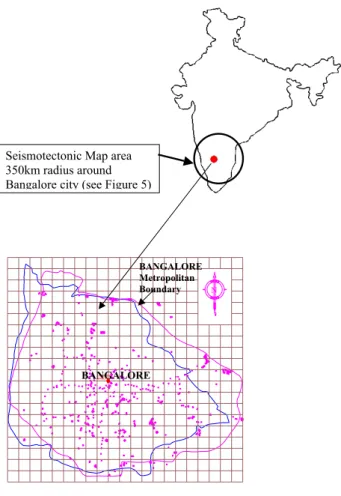
Seismotectonic Map area 350km radius around Bangalore city (see Figure 5)
BANGALORE
BANGALORE Metropolitan Boundary
Fig. 1.Study area and Bangalore in the India map.
source by using remote sensing data in conjunction with col-lateral data like seismotectonic atlas of India, drainage pat-terns using TOPO sheets of the area and Google earth im-ages etc. From these identified sources, Maximum Credi-ble Earthquake has been evaluated by three methods. Fur-ther synthetic ground motion is generated for MCE using re-gional seismotectonic parameters to full fill the requirements of ground motion data for future study.
To evaluate seismic hazards for a particular site or region, all possible sources of seismic activity must be identified and their potential for generating future strong ground mo-tion should be evaluated. Analysis of lineaments and faults helps in understanding the regional seismotectonic activity of the area. Lineaments are linear features seen on the sur-face of earth which represents faults, fractures, shear zones, joints, litho contacts, dykes, etc; and are of great relevance to geoscientists. Scientists believe that a lineament is a deep crustal, ancient, episodically reactivated linear feature that exerts control on the make up of the crust and associated distribution of ore and hydrocarbons (O’ Leary et al., 1976; Ganesha Raj and Nijagunappa, 2004). The study has been carried out for an area of about 350 km radius around Ban-galore as per the guideline available in Regulatory Guide
of U.S. Nuclear Regulatory Commission (1997). The re-cent seismic activity of Bangalore has been studied based on the seismic sources and earthquake events in the area. A new seismotectonic map has been prepared by consider-ing all the earthquake sources such as faults, lineaments, and shear zones. The past earthquake events (of more than 470 moderate events from 3.5 to 6.2 in moment magnitude and 1300 small tremors<3.5 moment magnitude) are superim-posed on this map with available latitude and longitude de-tails. The peak horizontal accelerations at rock level have been calculated by considering the regional attenuation re-lation from all the possible sources, through which vulner-able source has been identified. Maximum credible earth-quake for the city has also been determined using Wells and Coppersmith (1994) relation. For the purpose of future site response studies the synthetic ground motion has been gen-erated considering regional seismotectonic parameters using the synthetic ground motion model. A detailed seismic haz-ard analysis and synthetic ground motion generated for Ban-galore is presented in this paper.
2 Study area and seismicity
Bangalore covers an area of over 220 square kilometres and is at an average altitude of around 910 m above mean sea level (see Fig. 1.). It is situated on a latitude of 12◦
58′′
North and longitude of 77◦
36′′
Sreenivas (1977) have used field studies of borewell yield data and discussed the reactivation of dormant or inactive lineaments inducing seismicity in relative stable terrains of the continents. Purnachandra Rao (1999) highlighted the oc-currence of earthquakes in last few decades due to enhanced seismic activity in the interior of the Indian Plate which re-sults from reactivation of pre-existing faults under the in-fluence of the ambient stress field due to the India-Eurasia plate collision forces, oriented NS to NNE. Ramalingeswara Rao (2000) carried out strain rate and heat flow study in the southern India and characterized as medium to low seismic-ity region. Subrahmanya (2002 and 1996) highlights that the entire study area becoming seismically active due to the up-warping of Mulki-Pulicat Lake (MPL) axis which connects 13◦N in west to 13.4◦N in east. He concludes that there
is lot seismic activity around this Mulki-Pulicat Lake axis and in particular he highlights that micro to meso-seimicity to the south and mega seismicity to the north of the MLP axis. Recenly, Sridevi Jade (2004) has estimated the plate velocity and crustal deformation in the Indian subcontinent using GPS measurements. The author concludes that south-ern peninsular India consists of large zones of complex fold-ing, major and minor faults and granulite exposures, and this region cannot be classified as an area of low seismic activity. The seismic history of the area shows that many earth-quakes have been reported in this region and the first reported seismic activity in the study area had an intensity of VI oc-curred on 10th December 1807. About 1419 earthquake have been collated and their magnitudes were converted as mo-ment magnitude scale for the study. The data set contains 394 events which are less than 3, 790 events from 3 to 3.9, 203 events from 4 to 4.9, 29 events from 5 to 5.9 and 3 events which are more then 6. Maximum earthquake magnitude out of about 1400 events reported in the study area is 6.2. On 29 January 2001, earthquake of magnitude 4.3 in Richter scale hit the Mandya area, its epicentre was about 65 km southwest of Bangalore. More than 50 buildings reported to be dam-aged at Harohalli/Kanakapura. Widespread panic in Banga-lore and schools were closed. Minor damages are reported at Austin town and airport road in Bangalore. Even the Killari earthquake of 30th September 1993 was felt in Bangalore. Sumatra earthquake of 2004 had triggered tremors of inten-sity IV in Bangalore. As part of this work in the year 2005, five strong motion accelerographs and two borehole sensors have been installed at different locations in Bangalore.
3 Lineament studies using remote sensing data
It is observed that seismicity is associated with major lin-eaments; hence analysis of lineaments is useful for under-standing the seismic status of a terrain. Remote sensing data due to its synoptic nature is found to be very useful in map-ping lineaments. Images taken in the Near Infra Red (NIR) region (0.7–1.1µm) depicts clearly more lineaments than
other bands. Radar data also provides information on lin-eaments due to its oblique look angles. Thermal Infra Red (TIR) data is found to be useful in delineating wet linea-ments with moisture/water. Linealinea-ments present in the for-est areas, soil covered areas are also clearly visible on im-ages thus enabling us to delineate better structural features. In fact one of the major applications of remote sensing is in the area of lineament mapping. Lineaments are useful in groundwater, mineral, oil explorations, seismic studies and in engineering geological applications. Lineaments, which represent faults, fractures etc. have been mapped under the National Drinking Water Mission on 1:250,000 scale for In-dia during 1986–1990 (Department of Space, 1990). In this project an atlas of hydro-geomorphological map of India has been prepared. These maps helped in locating bore well sites for providing potable water to villages (Department of Space, 1990). Large numbers of studies have been carried out wherein lineaments were mapped using satellite images and Aerial photos (Srinivasan and Sreenivas, 1977; National Remote Sensing Agency, 1981; Drury, 1983; Department of Space, 1990; Ganesha Raj, 2001; Naganna and Lingaraju, 1990; Project Vasundhara, 1991; Nijagunappa et al., 1999). Large scale data are useful for mapping minor and micro lin-eaments whereas small scale data is needed to map major lineaments and to map mega lineaments normally mosaics of images are needed. Aerial photographs are extensively used for mapping of lineaments earlier to the launch of Remote Sensing Satellites. Aerial photographs with the very high spatial resolution and stereo-view are found useful in delin-eating lineaments. With the advent of satellite era, aerial pho-tos are being used only whenever very detailed information is required. Mapping of minor/micro-lineaments are better done using aerial photographs/high resolution satellite/large scale data, whereas satellite data (on smaller scale) are more useful for mapping medium/major/mega lineaments. Nor-mally, it is difficult to decide whether the mapped lineament is a fault or not from the image itself, but if there is a clear displacement/offset of associated features then the lineament can be identified as a fault. Integration of the lineament map with the available structural and geological information of the terrain, drainage pattern of the terrain and relevant field-work helps to decide the nature of the lineament.
In the present study an attempt has been made to map the major lineaments and assess their significance with respect to seismicity. The satellite images and other data used in the study are as follows:
– Indian Remote Sensing Satellite (IRS) – 1-D Wide Field Sensor (WiFS) data (False Colour Composite – FCC) on 1:1 000 000 scale.
– Geological and Mineral Map on 1:500 000 scale. – Earthquake data (epicenter with latitude and longitude,
year of occurrence and magnitude). – TOPO sheets of the area on 1:50 000 scale.
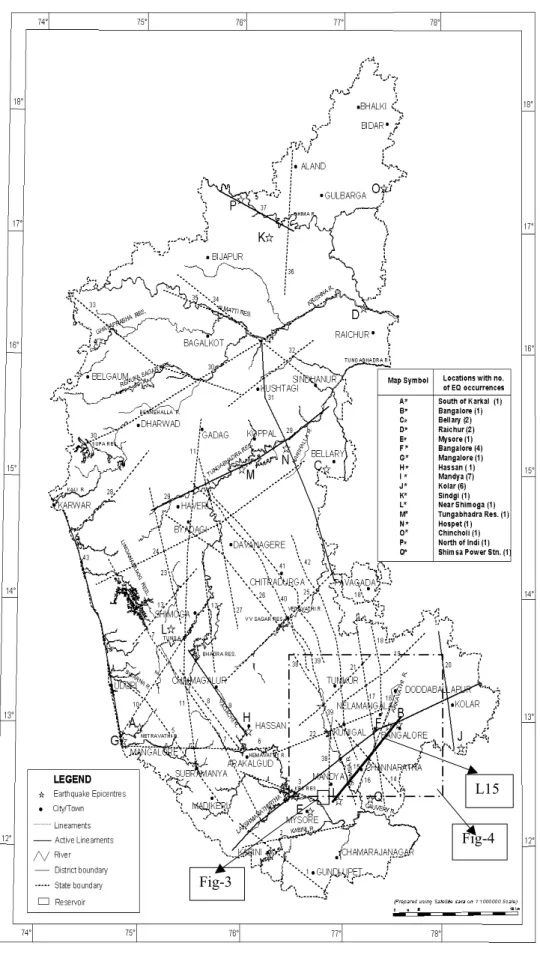
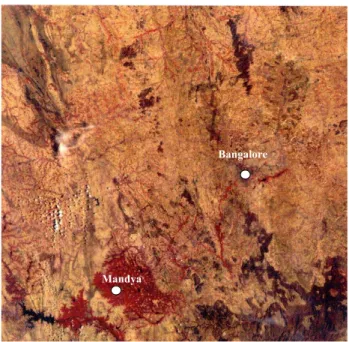
Lineaments with length more than 100 km, i.e., major lin-eaments were mapped first from individual scenes of Landsat data (MSS/TM) on 1:1 000 000 scale, these were transferred to a base map on 1:1 000 000 scale to make a single mosaic map. This map was superimposed on physical/road network map to eliminate any cultural lineament (road/railway etc). IRS – 1-D WiFS FCC on 1:1million scale was used further to map/refine the lineaments. Lineaments were numbered and their length and direction were measured. This linea-ment map was compared with the maps prepared earlier by Srinivasan and Sreenivas (1977), National Drinking Water Mission (NDWM) (Department of Space, 1990), Project Va-sundhara (1991), and Ganesha Raj (2001). Figure 2 show the lineaments identified in Karnataka. From Fig. 2 it is observed that there is a good match between the lineaments mapped in the seismotectonic atlas (Ganesha Raj, 2001) and the present study. And also major lineaments has been cross checked with field studies (Ganesha Raj, 2001) it shows that the po-sition in the satellite images matches with ground which is shown in Fig. 3. Figure 3 shows the Satellite image (IRS LISS-II) of part of Cauvery River (seen in the south west-ern side), controlled by Cauvery Lineament. Very close view of the satellite image in Mandya – Bangalore region shows that number of major lineaments like Lakshamana Thirtha-KRS-Bangalore lineament, Arkavathi-Madhugiri lineament, and Mandya-Channapatna-Bangalore lineament appearing in the region, which is shown in Fig. 4.
4 Preparation of seismotectonic map of Bangalore
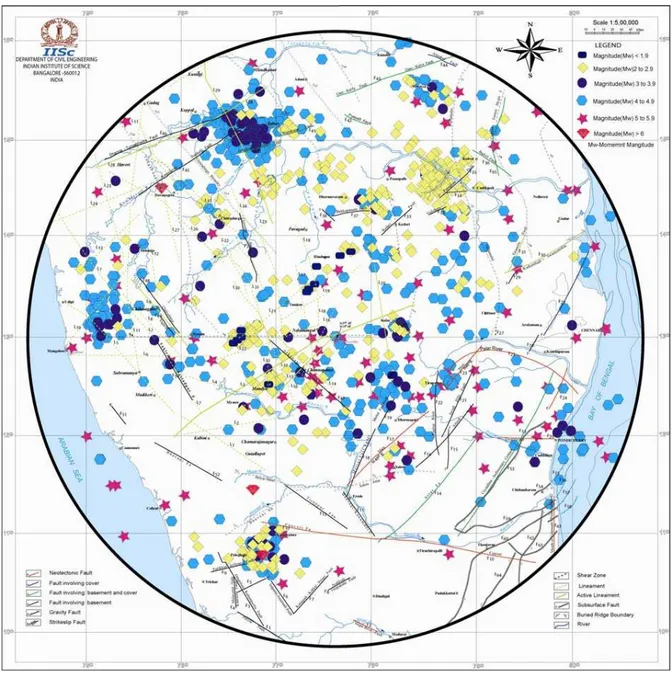
Seismotectonic map showing the geology, geomorphology, water features, faults, lineaments, shear zone and past earth-quake events has been prepared for Bangalore which is as shown in Fig. 5. Seismotectonic details of study area have been collected in about 350 km radius around Bangalore. The sources identified from Seismotectonic Atlas (2000) and remote sensing studies are compiled and a map has been pre-pared using Adobe Illustrator version 9.0. The seismotec-tonic map contains 65 numbers of faults with length vary-ing from 9.73 km to 323.5 km, 34 lineaments and 14 shear zones. The map identifies rock types in different colours, faults, lineaments and shear zones are also given in differ-ent colours. Earthquake data collected from various agencies [United State Geological Survey (USGS), Indian Metrologi-cal Department (IMD), GeologiMetrologi-cal Survey of India (GSI) and Amateur Seismic Centre (ASC)] contain information about the earthquake size in different scales such as intensity, lo-cal magnitude or Richter magnitude and body wave
nitudes. These magnitudes are converted to moment mag-nitudes (Mw) by using magnitude relations given by Idriss (1985). The earthquake events collated and converted has been super imposed on base map with available latitudes and longitudes. The earthquake events collated are about 1419 with minimum moment magnitude of 1.0 and a maximum of 6.2 and earthquake magnitudes are shown as circles with different diameters and colours. Sitharam and Anbazhagan (2006) have studied these aspects based on seismotectonic atlas of India. Further to this study of the authors, new seis-motectonic map which show a closer view of surroundings of Bangalore has been developed and is shown in Fig. 6. Max-imum source magnitude is assigned based on the maxMax-imum size of the earthquake in each of the sources.
5 Geotechnical data
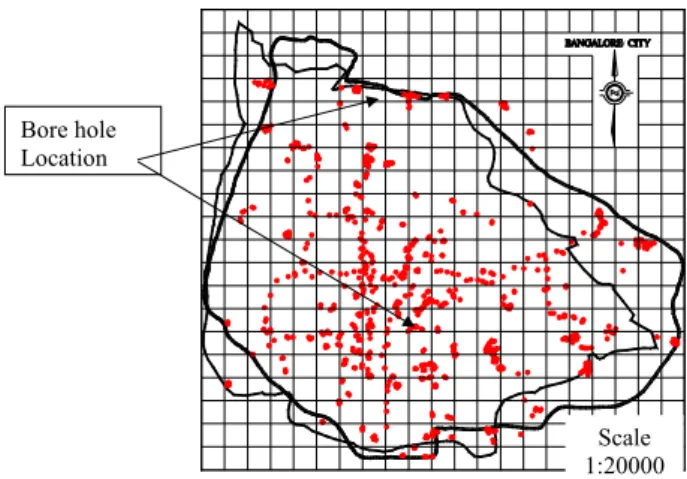
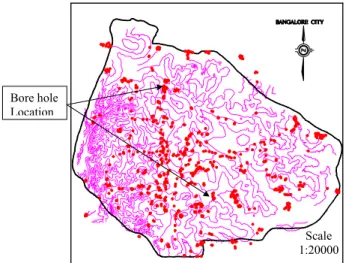
Geotechnical data was basically collated from geotechni-cal investigations carried out for several major projects in Bangalore. The GIS model developed currently consists of about 900 borehole locations marked on the digitized Ban-galore map of 1:20 000 scale which is shown in Fig. 7. The data consists of visual soil classification, standard penetra-tion test results, ground water level, time during which test has been carried out, other physical and engineering proper-ties of soil. Most investigations for residential and commer-cial complexes were below 15m and wherever bedrock has been encountered investigation has been terminated at that depth for these projects. This rock depth information has been used to prepare rock depth map for Bangalore. North-western part of the Bangalore has weathered rock varying from 6 m to 17 m depths and followed by hard rock. The Southwestern part weathered rock found at 3.5 m to 8.5 m and hard rock below 8.5 m. The Southeastern part weathered rock from 5.5 m to 17.5 m and hard rock beneath. Northeast-ern side weathered rock from 7.5 m–18.5 m and hard rock below. The rock depth information with latitude and longi-tude are obtained from the 653 boreholes out of 900, which is used for rock level PHA Mapping. Further reduced level (RL) of each bore log rock depth is calculated from contour map (see the Fig. 8) developed in GIS model. Figure 8 shows the location of boreholes with the elevation contours at 10 m intervals. The ground RL varies from 845 m to 910 m, which gives information on sloping terrains or valleys and could be used for locating the RL of ground as well as rock surface.
6 Seismic hazard analysis
15. Right side title page 6- Bangalor- replace as Bangalore
16. Left side title page 7- Bangalor- replace as BangalorFig-3 e
Fig-4 L15
CAUVERY RIVER
NANJAPUR
KEMPEGAUDANA KOPPAL
KALLIPUR
Fig. 3.Satellite image (IRS LISS-II) of part of Cauvery River (seen in the south western side), controlled by cauvery lineament.
Mandya
Bangalore
Fig. 4. Satellite image (Landsat TM) of Bangalore, Mandya and surrounding areas showing number of major lineaments.
cause the most severe consequences at the site. MCE as-sessment gives little consideration to the probability of fu-ture fault movements. For the vulnerable earthquake source identification the minimum moment magnitude considered was 3.5 and above. Earlier work by the authors Sitharam and Anbazhagan (2006) considered only 21 faults and lin-eaments and about 152 earthquakes. In the present study, 52 faults and lineaments and out of 1419 earthquake events,
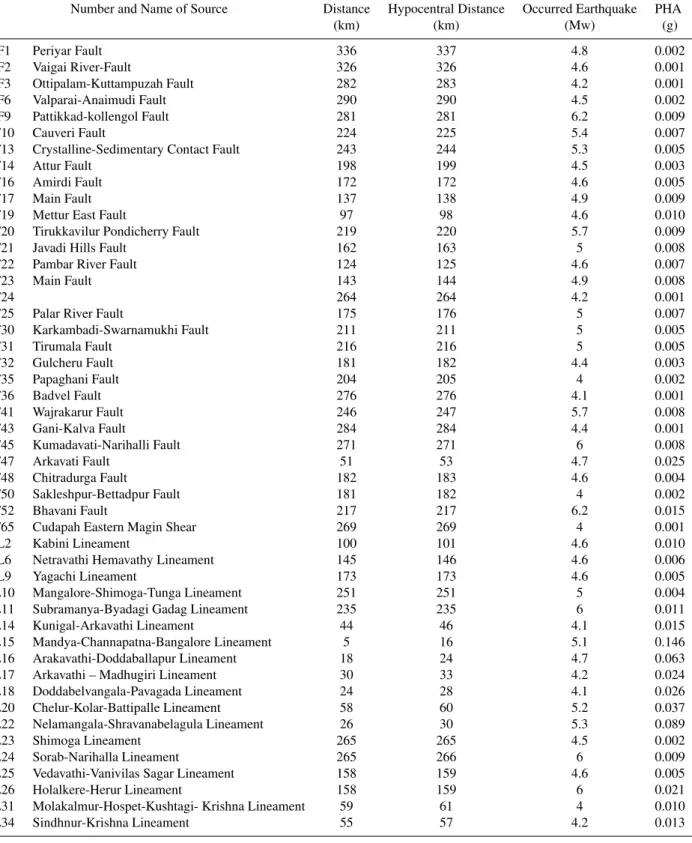
470 events that are more than 3.5 moment magnitude have been considered. Shortest distances from source to Banga-lore city centre have been measured from the seismotectonic map shown in Fig. 5 and they are also listed in Table 1. With these distance and moment magnitude, Peak Horizontal Ac-celeration (PHA) is calculated at bedrock level by consider-ing a focal depth of the earthquake of about 15 km from the surface, which is arrived at based on the past earthquake data. Method I:In this method the PGA for Bangalore has been calculated using the attenuation relation developed for south India by Iyengar and Raghukanth (2004). The attenuation relation used to calculate PGA is given below:
lny=c1+c2(M−6)+c3(M−6)2−lnR−c4R+ln∈(1) Wherey,MandRrefer to PGA (g), moment magnitude and hypocentral distance respectively. Since PGA known to be distributed nearly as a lognormal random variable lnywould be normally distributed with the average of (lnε) being al-most zero. Hence withε=1, coefficients for the southern re-gion are: (Iyengar and Raghukanth, 2004):
c1=1.7816; c2=0.9205; c3= −0.0673; c4=0.0035;
σ (lnε)=0.3136(taken as zero) (2) The calculation shows that the minimum PHA value is 0.001 g and maximum PHA value is 0.146 g (caused from Mandya-Channapatna-Bangalore lineament). Totally 10 sources have generated the higher PHA values close to Ban-galore. Among the 10 sources, the active lineament of Mandya-Channapatna-Bangalore lineament (L15 in Fig. 6) having a length of about 105 km (which is 5.2 km away from the Bangalore) causing a PHA value of 0.146 g due to an earthquake event (Mw of 5.1 occurred on 16 May 1972 ; cor-responds to a latitude of 12.4◦
N and longitude of 77.0◦
E). This is a measured earthquake event having a surface wave magnitude (Ms) of 4.6. These results confirm with the earlier analysis by the authors Sitharam and Anbazhagan (2006).
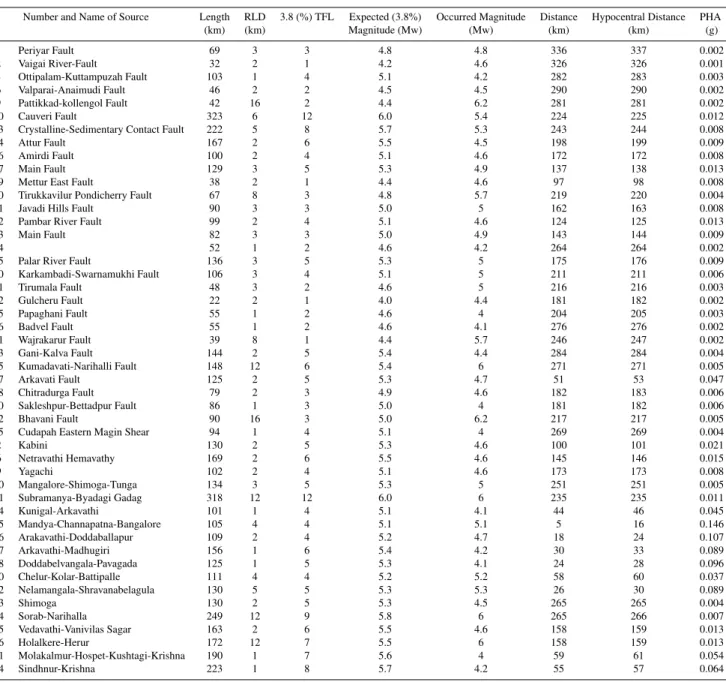
Method II:DSHA have been carried by considering sub-surface fault rupture length for the revised 52 numbers of sources. Mark (1977) recommends that the surface rupture length may be assumed as 1/3 to 1/2 of the total fault length (TFL) based on the worldwide data. However, assuming such large subsurface rupture length yields very large mo-ment magnitude and also it does not match with the past earthquake data. Wells and Coppersmith (1994) developed empirical relation between moment magnitude and subsur-face fault length using past world wide earthquakes, which is as follows:
log(RLD)=0.57MW−2.33 (3)
Fig. 5.Seismotectonic map of Bangalore and surroundings.
(1994) Eq. along with a parametric study, it is found that sub-surface fault rupture length of about 3.8% of total fault length gives moment magnitudes closely matching with the past earthquakes. Table 2 shows the RLD calculations, expected magnitude, and corresponding PHA from all the sources. The revised PHA lies in between minimum value of 0.001 g and maximum value of 0.146 g. In total, 9 sources have generated PHA value of more then 0.045 g at rock level close to Bangalore region. Among the nine sources, the Mandya-Channapatna-Bangalore lineament (L15 in Fig. 5) has a higher PHA value of 0.146 g due to an earthquake mo-ment magnitude of Mw of 5.1. For the earthquake event
with a Mw of 5.1 (occurred on 16 May 1972 with latitude of 12.4◦
N and longitude of 77.0◦
E), the RLD works out to be 3.8% of the total fault length corresponding to a PHA of 0.146 g.
7 Synthetic earthquake model
Table 1.Rock level PHA obtained using past earthquake events.
Number and Name of Source Distance Hypocentral Distance Occurred Earthquake PHA
(km) (km) (Mw) (g)
F1 Periyar Fault 336 337 4.8 0.002
F2 Vaigai River-Fault 326 326 4.6 0.001
F3 Ottipalam-Kuttampuzah Fault 282 283 4.2 0.001
F6 Valparai-Anaimudi Fault 290 290 4.5 0.002
F9 Pattikkad-kollengol Fault 281 281 6.2 0.009
F10 Cauveri Fault 224 225 5.4 0.007
F13 Crystalline-Sedimentary Contact Fault 243 244 5.3 0.005
F14 Attur Fault 198 199 4.5 0.003
F16 Amirdi Fault 172 172 4.6 0.005
F17 Main Fault 137 138 4.9 0.009
F19 Mettur East Fault 97 98 4.6 0.010
F20 Tirukkavilur Pondicherry Fault 219 220 5.7 0.009
F21 Javadi Hills Fault 162 163 5 0.008
F22 Pambar River Fault 124 125 4.6 0.007
F23 Main Fault 143 144 4.9 0.008
F24 264 264 4.2 0.001
F25 Palar River Fault 175 176 5 0.007
F30 Karkambadi-Swarnamukhi Fault 211 211 5 0.005
F31 Tirumala Fault 216 216 5 0.005
F32 Gulcheru Fault 181 182 4.4 0.003
F35 Papaghani Fault 204 205 4 0.002
F36 Badvel Fault 276 276 4.1 0.001
F41 Wajrakarur Fault 246 247 5.7 0.008
F43 Gani-Kalva Fault 284 284 4.4 0.001
F45 Kumadavati-Narihalli Fault 271 271 6 0.008
F47 Arkavati Fault 51 53 4.7 0.025
F48 Chitradurga Fault 182 183 4.6 0.004
F50 Sakleshpur-Bettadpur Fault 181 182 4 0.002
F52 Bhavani Fault 217 217 6.2 0.015
F65 Cudapah Eastern Magin Shear 269 269 4 0.001
L2 Kabini Lineament 100 101 4.6 0.010
L6 Netravathi Hemavathy Lineament 145 146 4.6 0.006
L9 Yagachi Lineament 173 173 4.6 0.005
L10 Mangalore-Shimoga-Tunga Lineament 251 251 5 0.004
L11 Subramanya-Byadagi Gadag Lineament 235 235 6 0.011
L14 Kunigal-Arkavathi Lineament 44 46 4.1 0.015
L15 Mandya-Channapatna-Bangalore Lineament 5 16 5.1 0.146
L16 Arakavathi-Doddaballapur Lineament 18 24 4.7 0.063
L17 Arkavathi – Madhugiri Lineament 30 33 4.2 0.024
L18 Doddabelvangala-Pavagada Lineament 24 28 4.1 0.026
L20 Chelur-Kolar-Battipalle Lineament 58 60 5.2 0.037
L22 Nelamangala-Shravanabelagula Lineament 26 30 5.3 0.089
L23 Shimoga Lineament 265 265 4.5 0.002
L24 Sorab-Narihalla Lineament 265 266 6 0.009
L25 Vedavathi-Vanivilas Sagar Lineament 158 159 4.6 0.005
L26 Holalkere-Herur Lineament 158 159 6 0.021
L31 Molakalmur-Hospet-Kushtagi- Krishna Lineament 59 61 4 0.010
L34 Sindhnur-Krishna Lineament 55 57 4.2 0.013
for synthetic ground generation along with past earthquake events are shown in Table 3. Seismological model by Boore (1983, 2003) [SMSIM- program for simulating ground
Table 2.PHA obtained from RLD approach.
Number and Name of Source Length RLD 3.8 (%) TFL Expected (3.8%) Occurred Magnitude Distance Hypocentral Distance PHA
(km) (km) Magnitude (Mw) (Mw) (km) (km) (g)
F1 Periyar Fault 69 3 3 4.8 4.8 336 337 0.002
F2 Vaigai River-Fault 32 2 1 4.2 4.6 326 326 0.001
F3 Ottipalam-Kuttampuzah Fault 103 1 4 5.1 4.2 282 283 0.003
F6 Valparai-Anaimudi Fault 46 2 2 4.5 4.5 290 290 0.002
F9 Pattikkad-kollengol Fault 42 16 2 4.4 6.2 281 281 0.002
F10 Cauveri Fault 323 6 12 6.0 5.4 224 225 0.012
F13 Crystalline-Sedimentary Contact Fault 222 5 8 5.7 5.3 243 244 0.008
F14 Attur Fault 167 2 6 5.5 4.5 198 199 0.009
F16 Amirdi Fault 100 2 4 5.1 4.6 172 172 0.008
F17 Main Fault 129 3 5 5.3 4.9 137 138 0.013
F19 Mettur East Fault 38 2 1 4.4 4.6 97 98 0.008
F20 Tirukkavilur Pondicherry Fault 67 8 3 4.8 5.7 219 220 0.004
F21 Javadi Hills Fault 90 3 3 5.0 5 162 163 0.008
F22 Pambar River Fault 99 2 4 5.1 4.6 124 125 0.013
F23 Main Fault 82 3 3 5.0 4.9 143 144 0.009
F24 52 1 2 4.6 4.2 264 264 0.002
F25 Palar River Fault 136 3 5 5.3 5 175 176 0.009
F30 Karkambadi-Swarnamukhi Fault 106 3 4 5.1 5 211 211 0.006
F31 Tirumala Fault 48 3 2 4.6 5 216 216 0.003
F32 Gulcheru Fault 22 2 1 4.0 4.4 181 182 0.002
F35 Papaghani Fault 55 1 2 4.6 4 204 205 0.003
F36 Badvel Fault 55 1 2 4.6 4.1 276 276 0.002
F41 Wajrakarur Fault 39 8 1 4.4 5.7 246 247 0.002
F43 Gani-Kalva Fault 144 2 5 5.4 4.4 284 284 0.004
F45 Kumadavati-Narihalli Fault 148 12 6 5.4 6 271 271 0.005
F47 Arkavati Fault 125 2 5 5.3 4.7 51 53 0.047
F48 Chitradurga Fault 79 2 3 4.9 4.6 182 183 0.006
F50 Sakleshpur-Bettadpur Fault 86 1 3 5.0 4 181 182 0.006
F52 Bhavani Fault 90 16 3 5.0 6.2 217 217 0.005
F65 Cudapah Eastern Magin Shear 94 1 4 5.1 4 269 269 0.004
L2 Kabini 130 2 5 5.3 4.6 100 101 0.021
L6 Netravathi Hemavathy 169 2 6 5.5 4.6 145 146 0.015
L9 Yagachi 102 2 4 5.1 4.6 173 173 0.008
L10 Mangalore-Shimoga-Tunga 134 3 5 5.3 5 251 251 0.005
L11 Subramanya-Byadagi Gadag 318 12 12 6.0 6 235 235 0.011
L14 Kunigal-Arkavathi 101 1 4 5.1 4.1 44 46 0.045
L15 Mandya-Channapatna-Bangalore 105 4 4 5.1 5.1 5 16 0.146
L16 Arakavathi-Doddaballapur 109 2 4 5.2 4.7 18 24 0.107
L17 Arkavathi-Madhugiri 156 1 6 5.4 4.2 30 33 0.089
L18 Doddabelvangala-Pavagada 125 1 5 5.3 4.1 24 28 0.096
L20 Chelur-Kolar-Battipalle 111 4 4 5.2 5.2 58 60 0.037
L22 Nelamangala-Shravanabelagula 130 5 5 5.3 5.3 26 30 0.089
L23 Shimoga 130 2 5 5.3 4.5 265 265 0.004
L24 Sorab-Narihalla 249 12 9 5.8 6 265 266 0.007
L25 Vedavathi-Vanivilas Sagar 163 2 6 5.5 4.6 158 159 0.013
L26 Holalkere-Herur 172 12 7 5.5 6 158 159 0.013
L31 Molakalmur-Hospet-Kushtagi-Krishna 190 1 7 5.6 4 59 61 0.054
L34 Sindhnur-Krishna 223 1 8 5.7 4.2 55 57 0.064
motion based on the Fourier amplitude spectrum of acceler-ation at bedrock and this is expressed as:
A (f )=C[S (f )]D (f ) P (f ) (4)
Where S(f ) is the source spectral function, D(f ) is the diminution function characterizing the attenuation, andP (f )
is a filter to shape acceleration amplitudes beyond a high cut-off frequency fm, and C is a scaling factor. In the present study, the single corner frequency model has been used (Brune, 1970) and the following regional seismotectonic pa-rameters are considered to generate the synthetic ground mo-tion:
– Source region Shear wave velocity = 2.7 km/s (Parvez et.al, 2003)
– Q(f )=488f0.88
– The diminution functionD(f )is defined as
D (f )=Gexp [−5f R/VSQ (f )] (5)
Table 3.Sources used for synthetic ground motion generation.
Number and Name of Source Length RLD 3.8 (%) TFL Distance Hypocentral Distance Expected (3.8%) PHA Occurred Magnitude PHA
(km) (km) (km) (km) Magnitude (Mw) (g) (Mw) (g)
F19 Mettur East Fault 38 2 1 97 98 4.4 0.008 4.6 0.010
F47 Arkavati Fault 125 2 5 51 53 5.3 0.047 4.7 0.025
L11 Subramanya-Byadagi Gadag 318 12 12 235 235 6.0 0.011 6 0.011
L15 Mandya-Channapatna-Bangalore 105 4 4 5 16 5.1 0.146 5.1 0.146
L16 Arakavathi-Doddaballapur 109 2 4 18 24 5.2 0.107 4.7 0.063
L20 Chelur-Kolar-Battipalle 111 4 4 58 60 5.2 0.037 5.2 0.037
L22 Nelamangala-Shravanabelagula 130 5 5 26 30 5.3 0.089 5.3 0.089
L26 Holalkere-Herur 172 12 7 158 159 5.5 0.013 6 0.021
Table 4.PHA obtained from synthetic ground motion model.
Number and Name of Source Length Distance Maximum (expected) Hypocentral Distance PHA (g)
(km) (km) Magnitude (Mw) (km) (g)
F19 Mettur East Fault 38 97 4.6 98 0.005
F47 Arkavati Fault 125 51 4.7 53 0.014
L11 Subramanya-Byadagi Gadag 318 235 6 235 0.012
L15 Mandya-Channapatna-Bangalore 105 5 5.1 16 0.136
L16 Arakavathi-Doddaballapur 109 18 5.2 24 0.085
L20 Chelur-Kolar-Battipalle 111 58 5.2 60 0.022
L22 Nelamangala-Shravanabelagula 130 26 5.3 30 0.064
L26 Holalkere-Herur 172 158 6 159 0.020
Fig. 6.Closer view of surroundings of Bangalore in seismotectonic map.
earthquakes and estimatedQvalue to be 460f 0.83 (after Iyengar and Raghukanth, 2004). However, for Bangalore region, Tripathi and Ugalde (2004) developed Q factor by using seismic array from the Gauribidanur seismic record-ing station that is about 85 km from Bangalore, They esti-mated and reported for the different frequency range of 1 Hz
Location
Scale 1:20000 Bore hole
Location
Fig. 7.Borehole locations in Bangalore.
to 10 Hz. For Bangalore, the natural frequency is in the range of 3 to 6 Hz and the correspondingQvalue is 488f
Scale 1:20000 Bore hole
Location
Fig. 8.Contours map of Bangalore.
-0.15 -0.10 -0.05 0.00 0.05 0.10 0.15 0.20
29 30 31 32 33 34 35
Time ( sec)
A c cel e rat io n ( g )
Fig. 9. Synthetic ground motion generated from Mandya-Channapatna-Bangalore lineament (L15).
are plotted; it shows that the predominant period of synthetic ground motion is 0.06 seconds irrespective of the magni-tude and sources. Further, PHA obtained from the model for the L15 matches well with the PGA values from both the above approaches. The synthetic ground motion for Mandya-Channapatna-Bangalore lineament (L15) is shown in Fig. 9. Rock level spectral acceleration for Mandya-Channapatna-Bangalore lineament (L15) is shown in Fig. 10.
8 Development of rock level PHA map
From the above three approaches the highest PGA value for the Bangalore is obtained from the Mandya-Channapatna-Bangalore lineament (L15) for the past earthquake of 5.1 moment magnitude. It clearly indicates that the maximum credible earthquake for the region is 5.1 in moment magni-tude and vulnerable source is active lineament of Mandya-Channapatna-Bangalore lineament (L15). Further an
at-0.00 0.05 0.10 0.15 0.20 0.25 0.30 0.35
0 0.25 0.5 0.75 1 1.25 1.5 1.75 2
Period (sec) S p ect ral A ccel er at io n ( g )
Fig. 10.Rock level spectral acceleration from synthetic ground mo-tion.
77.54E 77.56E 77.58E 77.6E 77.62E 77.64E 77.66E 77.68E
Longitude (Degree East)
12.92N 12.94N 12.96N 12.98N 13N 13.02N 13.04N Latitude (Deg ree No rth) 0.09g 0.1g 0.11g 0.12g 0.13g 0.14g 0.15g 0.16g VIDHANA SOUDHA BANGALORE
Fig. 11.Rock level PHA map of Bangalore.
tempt has been made to map the rock level PHA consider-ing the Mandya-Channapatna-Bangalore lineament (L15) as the source. The rock level PHA has been calculated using rock depth information from geotechnical data (using 653 bore holes dug for geotechnical investigations). The linea-ment L15 location is superimposed with borehole locations. The shortest distance between the each borehole to the lin-eament has been measured. Using the depth of 15 km and shortest distance, the hypocenter distance of each bore log is evaluated. The PHA due to the MCE of 5.1 from the vulner-able source of L15 has been evaluated. The rock level PHA map has been prepared and it is shown in Fig. 11. The rock level PHA map will be useful for the microzonation and site response studies of Bangalore region.
9 Conclusions
seis-motectonic atlas and past earthquake events. Determinis-tic seismic hazard analysis has been carried out considering all the sources in an area of 350 km around Bangalore and the past earthquake events. The PHA at base rock level has been calculated by using an appropriate attenuation relation by assigning the maximum reported earthquake to the source and also by assuming the subsurface rupture length (RLD is 3.8% of total fault length). The highest PHA value (0.146 g) is attributed to the source Mandya-Channapatna-Bangalore lineament (L15) and it is considered to be the vulnerable source for Bangalore. The earthquake event of Mw of 5.1 is considered as MCE for the Bangalore (which occurred on 16 May 1972; corresponds to a latitude of 12.4◦
N and lon-gitude of 77.0◦
E) and this event was a measured/recorded earthquake event with surface wave magnitude (Ms) of 4.6. The synthetic ground motion has been generated using re-gional seismotectonic parameters for the different identified sources. The source Mandya-Channapatna-Bangalore linea-ment gives the highest PHA value of 0.136 g for MCE of 5.1. The synthetic ground motion and spectral acceleration has been generated and the shape of the spectral acceleration matches with the shape of uniform hazard spectrum. The rock level PHA map has been prepared and such maps will be of use for the purpose of seismic microzonation, ground re-sponse analysis and design of important structures. From this study, it is very clear that Bangalore area can be described as seismically moderately active region. This study clearly demonstrates the potential for moderate earthquakes that can affect Bangalore and its vicinity. It is also recommended that southern part of Karnataka in particular Bangalore, Mandya and Kolar, need to be upgraded from current Indian Seismic Zone II to Seismic Zone III.
Acknowledgements. Authors thank ISRO-IISc Space
Tech-nology Cell, Indian Institute of Science, Bangalore, India for funding the project titled “Use of remote sensing and GIS for Seismic Hazard Analyses of Bangalore Urban Area, (Ref. No. ISTC/CCE/TGS/176/2006 dated 29 March 2006) and Department of Science and Technology (DST), Seismology Divi-sion, Gov. of India. The authors also thank G. U. Mahesh, Project Assistant, Indian Institute of Science for helping in preparation of seismotectonic map.
Edited by: M. Contadakis
Reviewed by: G. Papadopoulos, C. Papaioannou, and another referee
References
Atkinson, G. M. and Boore, D. M.: Ground-motion Relations for Eastern North America, Bull. Seism. Soc. Am., 85(1), 17–30, 1995.
Boore, D. M.: Stochastic simulation of high-frequency ground mo-tions based on seismological models of the radiated spectra, Bull. Seism. Soc. Am., 73, 1865–1894, 1983.
Boore, D. M.: Simulation of ground motion using the stochastic method, Pure Appl. Geophys., 160, 635–675, 2003.
Department of Space.: Atlas of Hydro-geomorphological Maps of India: Karnataka and Goa, 1990.
Drury, S. A.: A Regional tectonic study of the Archaean Chi-tradurga Greenstone belt, Karnataka, based on Landsat interpre-tation, J. Geol. Soc. India, 24, 167–184, 1983.
Ganesha Raj, K.: Major Lineaments of Karnataka and their signifi-cance with respect to Seismicity – Remote sensing based analy-sis, Ph.D. Theanaly-sis, Gulbarga University, Karnataka, India, 2001. Ganesha Raj. K and Nijagunappa, R.: Major Lineaments of
Kar-nataka State and their Relation to Seismicity: Remote Sensing Based Analysis, J. Geol. Soc. India, 63, 430–439, 2004. Hwang, H. and Huo, J. R.: Attenuation relations of ground motion
for rock and soil sites in eastern United States, Soil Dynamics and Earthquake Engineering, 16, 363–372, 1997.
Idriss, I. M.: Evaluating seismic risk engineering practice, Proceed-ings of the 11th International Conference on Soil Mechanics and Foundation Engineering, San Francisco, 1, 255–320, 1985. IS 1893 (part 1): Criteria for Earthquake Resistant Design of
Struc-ture, Bureau of Indian standards, New Delhi, 2002.
Iyengar, R. N and Raghukanth, S. T. G.: Attenuation of Strong Ground Motion in Peninsular India, Seismol. Res. Lett., 75, 4, 530–540, July/August 2004.
Mark, R. K.: Application of linear statistical model of earthquake magnitude versus fault length in estimating maximum expectable earthquakes, Geology, 5, 464–466, 1977.
Naganna, C. and Lingaraju, Y.: A strategy for drought mitigation using groundwater: A case study in Kolar district, Karnataka State, India, Groundwater Monitoring and Management, Pro-ceedings of the Dresden Symposium, IAHS, 173, 31–38, 1990. National Remote Sensing Agency.: Geological Map of part of West
Karnataka, NRSA TR 0141-0150, Hyderabad, 1–13, 1981. Nijagunappa, R., Joshphar, K., and Ganesha Raj, K.: Study of
structures of Sandur-Hospet-Bellary-Kudligi region using re-mote sensing, Proceedings ISRS National Symposium, Banga-lore, 486–491, 1999.
O’Leary, D.W, Driedman, J. D., and Pohn, H. A.: Lineaments, lin-ear, lineation: Some proposed new standards for old terms, Geol. Soc. Am. Bull., 87, 1463–1469, 1976.
Purnachandra Rao, N.: Single station moment tensor inversion for focal mechanisms of Indian intra-plate earthquakes, Current Sci., 77, 1184–1189, 1999.
Parvez, A. I., Vaccari, F., and Panza October, G. F.: A deterministic seismic hazard map of India and adjacent areas, Geophys. J. Int., 155, 489–508, 2003.
Project Vasundhara – Status Report: Regional Remote Sensing Ser-vice Centre/Indian Space Research Organisation, Airborne Min-eral Survey and Exploration Wing/Geological Survey of India, 11–15, 1991.
2000.
Rao, R., Seshamma, C. V., and Mandal, P.: Estimation of Coda Qc and spectral characteristics of some moderate earthquakes of southern Indian peninsula, Unpublished Report, 1998.
Regulatory Guide 1.165.: Identification and characterization of seismic sources and determination of safe shutdown earthquake ground motion, Published by U.S. Nuclear Regulatory Commis-sion, March 1997.
Seismotectonic Atlas of India-2000: published by Geological Sur-vey of India, 2000.
Sitharam T. G. and.Anbazhagan P.: Seismic Hazard Analysis for the Bangalore Region, Nat. Hazards, doi:10.1007/s11069-006-0012-z, available online: http://www.springerlink.com/content/ 2701385856748276/, 2006.
Sridevi J.: Estimation of plate velocity and crustal deformation in the Indian subcontinent using GPS geodesy, Current Sci., 86, 1443–1448, 2004.
Srinivasan, R. and Sreenivas, B. L.: Some new geological features from the Landsat imagery of Karnataka, J. Geol. Soc. India, 18, 589–597, 1977.
Subrahmanya, K. R.: Active intraplate deformation in south India, Tectonophys., 262, 231–241, 1996.
Subrahmanya, K. R.: Deformation related lineaments in the Indian Peninsula Near 13◦, J. Geophys., XXIII-2, 59–68, 2002. Tripathi, J. N, and Ugalde, A.: Regional estimation of Q from
seis-mic coda observations by the Gauribidanur seisseis-mic array (south-ern India), Phys. Earth Planet. Interiors, 145, 115–126, 2004. Valdiya, K. S.: Late Quaternary Movements and Landscape