PR O G R A M A D E PÓ S-GR A D U A Ç Ã O E M NE U R O C I Ê N C I A S
I N S T I T U T O D O! C É R E B R O
E N C O D I N G
M E C H A N I S M S
B A S E D
O N
FA S T
O S C I L L AT I O N S
I N
T H E
R E T I N A
O F
T H E
C AT
A N D
T H E I R
D E P E N D E N C I E S
O N
A N E S T H E S I A
F A B I O F R E I T A G
TRABALHO APRESENTADO AO PROGRAMA DE PÓS-GRADUAÇÃO EM NEUROCIÊNCIAS DA UNIVERSIDADE
FEDERAL DO RIO GRANDE DO NORTE COMO REQUISITO PARCIAL PARA A OBTENÇÃO DO
GR A U D E ME S T R E
ORIENTADOR: Prof. Dr. SERGIO NEUENSCHWANDER NEUROBIOLOGIA DE SISTEMAS E COGNIÇÃO
PR O G R A M A D E PÓ S-GR A D U A Ç Ã O E M NE U R O C I Ê N C I A S
I N S T I T U T O D O! C É R E B R O
E N C O D I N G
M E C H A N I S M S
B A S E D
O N
FA S T
O S C I L L AT I O N S
I N
T H E
R E T I N A
O F
T H E
C AT
A N D
T H E I R
D E P E N D E N C I E S
O N
A N E S T H E S I A
F A B I O F R E I T A G
DISSERTAÇÃO APRESENTADA AO PROGRAMA DE PÓS-GRADUAÇÃO EM NEUROCIÊNCIAS DA UNIVERSIDADE FEDERAL DO RIO GRANDE DO NORTE
COMO REQUISITO PARCIAL PARA A OBTENÇÃO DO GRAU DE MESTRE. ÁREA DE CONCENTRAÇÃO:NEUROBIOLOGIA DE SISTEMAS E COGNIÇÃO.
APROVADAEM: 27.08.2013
B A N C A E X A M I N A D O R A: PROF.DR.SERGIONEUENSCHWANDER
PROF.DR.ADRIANO TORT
Processing in the visual system starts in the retina. Its complex network of cells with different properties enables for parallel encoding and transmission of visual information to the lateral geniculate nucleus (LGN) and to the cortex. In the retina, it has been shown that responses are often accompanied by fast synchronous oscillations (30 - 90 Hz) in a stimulus-dependent manner. Studies in the frog, rabbit, cat and monkey, have shown strong oscillatory responses to large stimuli which probably encode global stimulus properties, such as size and continuity (Neuenschwander and
Singer, 1996; Ishikane et al., 2005). Moreover, simultaneous recordings from different
levels in the visual system have demonstrated that the oscillatory patterning of retinal
ganglion cell responses are transmitted to the cortex via the LGN (Castelo-Branco et al.,
1998). Overall these results suggest that feedforward synchronous oscillations contribute to visual encoding.
In the present study on the LGN of the anesthetized cat, we further investigate the role of retinal oscillations in visual processing by applying complex stimuli, such as natural visual scenes, light spots of varying size and contrast, and flickering checkerboards. This is a necessary step for understanding encoding mechanisms in more naturalistic conditions, as currently most data on retinal oscillations have been limited to simple, flashed and stationary stimuli. Correlation analysis of spiking responses confirmed previous results showing that oscillatory responses in the retina (observed here from the LGN responses) largely depend on the size and stationarity of the stimulus. For natural scenes (gray-level and binary movies) oscillations appeared only for brief moments probably when receptive fields were dominated by large continuous, flat-contrast surfaces. Moreover, oscillatory responses to a circle stimulus could be broken with an annular mask indicating that synchronization arises from relatively local interactions among populations of activated cells in the retina.
A surprising finding in this study was that retinal oscillations are highly dependent on halothane anesthesia levels. In the absence of halothane, oscillatory activity vanished independent of the characteristics of the stimuli. The same results were obtained for isoflurane, which has similar pharmacological properties. These new and unexpected findings question whether feedfoward oscillations in the early visual system are simply due to an imbalance between excitation and inhibition in the retinal networks generated by the halogenated anesthetics. Further studies in awake behaving animals are necessary to extend these conclusions.
O processamento da informação visual se inicia na retina. A sua complexa rede de células com diferentes propriedades permite que a informação visual seja codificada em canais paralelos e transmitida para o núcleo geniculado lateral (LGN) e o córtex. Na retina, tais respostas estão frequentemente acompanhadas por oscilações sincronizadas de alta frequência (30 – 90 Hz) em uma maneira dependente do estímulo. Como demonstrado em estudos na rã, coelho, gato e macaco, respostas oscilatórias ocorrem em geral a estímulos relativamente grandes, podendo codificar propriedades globais do estímulo como o tamanho e continuidade (Neuenschwander and Singer, 1996; Ishikane et al., 2005). Além disso, registros simultâneos em diferentes níveis do sistema visual têm mostrado que o padrão de oscilação nas células ganglionares retinianas é transmitido para o córtex visual via LGN (Castelo-Branco et al., 1998). De uma forma geral, esses resultados sugerem que oscilações sincronizadas em uma maneira feedforward são importantes na codificação da informação visual.
No presente estudo feito no LGN de gatos anestesiados, investigamos o papel das oscilações retinianas no processamento de informação visual através da apresentação de estímulos complexos, como cenas naturais, pixels aleatórios no tempo e espaço, além de grades em movimento. Esse é um importante passo para o entendimento de mecanismos de codificação em condições naturais, já que grande parte dos estudos que investigaram o papel de oscilações retinianas utilizaram-se de estímulos simples e estacionários. Análises de correlação de respostas neuronais (spiking responses) confirmaram resultados prévios mostrando que respostas oscilatórias na retina (observadas aqui a partir de registros no LGN) dependem do tamanho e estacionariedade do estímulo. Para filmes de cenas naturais (em escala de cinza e preto e branco) oscilações apareceram apenas por breves momentos provavelmente quando os campos receptores foram dominados por padrões extensos e contínuos (para ambas as escalas). As atividades oscilatórias parecem ser dependentes de uma massa crítica de células ativadas sugerindo que esse padrão regular de atividade surge através de interações horizontais na retina.
Nossos resultados mostram, além disto, que surpreendentemente oscilações da retina no gato são dependentes da anestesia mediada por halotano. Na ausência deste, atividades oscilatórias estiveram ausentes independentemente das características dos estímulos visuais. Resultados semelhantes foram obtidos para o isoflurano, anestésico com propriedades farmacológicas similares. Esse novo e inesperado resultado nos faz questionar se oscilações feedforward no sistema visual não seriam resultado de um desequilíbrio entre correntes de excitação e inibição nas redes retinianas gerado pelos anestésicos halogenados. Experimentos futuros em animais acordados serão necessários para confirmar essas conclusões.
Figure 1│ Schematic representation of the LGN in the cat.
Figure 2│ Stimulus size modulates spiking responses of an ON-center cell in the LGN.
Figure 3│ The binding by synchronization hypothesis.
Figure 4│ Oscillatory responses in the retina.
Figure 5│ Synchronous oscillations in the retina arises from population interactions.
Figure 6│ Feedforward synchronization in the retinogeniculate pathway.
Figure 7│ Synchronous oscillations in the retina encode stimulus continuity
Figure 8│ Schematic representation of the electrode recording system used in this study.
Figure 9│ Quartz-insulated tungsten-platinum electrodes.
Figure 10│ Stimulus size and circle annular mask protocols.
Figure 11│ Percolation stimulus protocol.
Figure 12│ Dynamical visual stimuli.
Figure 13│ Stimulus size and luminance modulate fast oscillations in the retinogeniculate system.
Figure 14│ Correlated activity across large distances in the retina.
Figure 15│ Breaking stimulus continuity disrupts oscillatory responses to a circle stimulus.
Figure 16│ Percolation threshold does not lead to a phase transition in the oscillatory responses.
Figure 17│ Fast oscillations appear only briefly for homogeneous image segments in natural scene movies.
Figure 18│ Oscillatory responses to gratings as function of stimulus temporal frequency.
Figure 19│ Halothane anesthesia greatly affects fast oscillations in the retina.
Figure 20│ Effects of halothane on LGN responses to a linear ramp stimulus.
Figure 21│ Oscillation strength as a function of halothane levels for responses to a linear ramp stimulus. Population data.
Figure 22│ Retinal oscillations in response to natural scene movies vanish in absence of halothane.
Figure 23│ Oscillation strength as a function of halothane levels for responses to natural scene movies. Population data.
Figure 24│ Retinal oscillations in LGN responses to grating stimuli.
Figure 25│ Oscillation strength as a function of halothane levels for responses to grating stimuli. Population data.
Figure 26│ Isoflurane, an halogenated anesthetic similar to halothane, is also responsible for the appearance of fast oscillations in the retinogeniculate system.
Figure 27│ Example of a small-world network.
Figure 28│ Visual processing using coupled oscillators.
Table 1│ Mean values and standard deviation for modulation amplitude and firing rate of the 10 different sizes in 3 different levels of luminance.
AB S T R A C T A N D K E Y W O R D S …………..…….…….……… 04
RE S U M O E PA L A V R A S-C H A V E …………..…….…….……… 05
LI S T O F F I G U R E S A N D TA B L E S ………….….….….……… 06
SU M M A R Y ………..…….….….….……… 07
IN T R O D U C T I O N ………..…….….….….……… 09
1 . 1 PA R A L L E L C H A N N E L S I N T H E R E T I N O G E N I C U L AT E S Y S T E M ………… 10
1 . 2 NE U R O N A L E N C O D I N G ……….……….……… 11
1 . 3 TH E B I N D I N G B Y S Y N C H R O N I Z AT I O N H Y P O T H E S I S …………..…... 13
1 . 4 SY N C H R O N O U S O S C I L L AT I O N S I N T H E E A R LY V I S U A L S Y S T E M... 15
1 . 5 RE T I N A L O S C I L L AT I O N S A S A N E N C O D I N G M E C H A N I S M... 18
1 . 6 AN E S T H E S I A E F F E C T S……….………….………….… 20
2 . OB J E C T I V E S ………..…….….….….……… 21
S p e c i f i c g o a l s ……….……….……….……….……… 21
3 . ME T H O D S ……… 22
3 . 1 EX P E R I M E N TA L S E S S I O N S…………..…..…..…..…..…..…..…..…. 22
3 . 1 . 1 SU R G I C A L P R O C E D U R E S, A N E S T H E S I A A N D L I F E S U P P O R T… 22 3 . 1 . 2 RE C O R D I N G D E V I C E A N D E L E C T R O D E S.….…....…..…..…. 23
3 . 1 . 3 SI G N A L C O N D I T I O N I N G A N D D ATA A C Q U I S I T I O N……… 25
3 . 2 . VI S U A L S T I M U L I ……… 26
C i rc l e s i z e ……… 27
C i rc l e a n n u l a r m a s k ……… 27
P e rc o l a t i o n s t i m u l u s ……… 27
N a t u r a l m o v i e s a n d g r a t i n g s ……… 28
3 . 3 . HA L O T H A N E E F F E C T S ……… 29
3 . 4 . DATA A N A LY S I S ……… 29
4 . RE S U LT S ……… 31
4 . 3 . PE R C O L AT I O N S T I M U L U S ……… 34
4 . 4 . OS C I L L AT O R Y R E S P O N S E S T O D Y N A M I C A L S T I M U L I ……… 35
4 . 5 . DE P E N D E N C I E S O N H A L O T H A N E L E V E L S………… ……… 37
5 . DI S C U S S I O N ………… ……… 43
5 . 1 ST I M U L U S D E P E N D E N C I E S……… 44
5 . 2 EF F E C T S O F H A L O T H A N E A N E S T H E S I A……… 47
6 . CO N C L U S I O N ……… 49
7 . RE F E R E N C E S ………...……… 50
8 . TA B L E S………...……… 56
1. IN T R O D U C T I O N
It is impossible to think about how we interact with the world without focusing
on sensory systems. Our personal sensory experiences and the memories resulting from
them contribute directly to shaping our identity. Moreover, perceived environmental
cues like odors, colors, shapes and sounds, are essential for building appropriate
responses during our social interactions. Being able to recognize a threatening predator,
a potential prey, or a receptive female, for example, are crucial for the maintenance of
the life of an individual and eventually transmission of its genes to the next generations.
Given their central importance, its is not surprising to see that during evolution different
sensory modalities appeared associated with distinct neural machinery. Yet, despite
being represented by multiple inputs, objects are perceived not as a collection of
independent attributes but as unified percepts. What are the neural mechanisms
responsible for the representation and coordination of inputs into coherent percepts?
One strategy that the brain adopted to represent sensory information was through
parallel processing (Nassi and Callaway, 2009). This notion was first put forward for the
somatosensory system, where the sensations of pain and temperature were found to be
transmitted independently through parallel pathways (Gasser and Erlanger, 1929). This
concept was later extended to the visual system based on the observation that at least
three groups of axons (with distinct calibre and conduction velocities) could be
identified in the optic nerve of the rabbit (Bishop, 1933). The concept of parallel
pathways was further supported by studies in the visual system of cats and monkeys
showing independent forward processing channels from the retina to the lateral
geniculate nucleus (LGN) and to the primary visual cortex (Casagrande and Kaas, 1994;
Sherman and Guillery, 2006). In addition to parallel channels, the visual system is
organized in multiple areas, which provide multiple representations of the visual field
(Gattass et al., 2011).
Despite all the data accumulated on how neural systems represent environmental
bits of information we still know very little about the nature of the integrative process in
the brain. In particular we do not know how perceptual binding is achieved based on the
1 . 1 PA R A L L E L C H A N N E L S I N T H E R E T I N O G E N I C U L AT E S Y S T E M
Even a simple visual scene can be decomposed into distinct attributes such as
brightness, color, depth, shape and motion. Processing all this information in parallel
implies into representing specific features by appropriate channels, from the first
processing steps at the level of the retina to the primary visual cortex and extrastriate
areas (Livingstone and Hubel, 1988).
In the retina, evidence for parallel processing was first obtained by Christina
Enroth-Cugell and John Robson with their seminal work in the cat (Enroth-Cugell and
Robson, 1966). In response to light, retinal photoreceptors change their membrane
potential. These signals are then transmitted through the bipolar cells to the ganglion
cells, where action potentials are generated and sent to the retinogeniculate pathway.
Distinct pathways are originated from the different types of retinal ganglion cells, which
convey parallel information first to the lateral geniculate nucleus (LGN) and then to the
visual cortex (Yeh et al., 2003). In the cat, the two most important functional cell types
are the X- and Y-cells. These cell types differ primarily in their morphology and
response properties. X-cells show sustained responses to spot stimuli and have dendritic
arbors confined to a narrow area, while Y-cells respond transiently and have wide
receptive fields (RFs) (Saito, 2004). Furthermore, X-cells exhibit a linear summation of
responses for stimuli presented to different subregions of the RF. In contrast, Y-cells do
not integrate linearly the spatial information (Kratz et al., 1978).
In the cat LGN, principal cells were also classified as X- or Y-cells (Hoffmann et
al., 1972). As in the retina, X-cells are less sensitive to fast movements of the stimulus,
while Y-cells show strong modulation to motion since they are capable of responding to
stimuli of high temporal frequency. Moreover, X-cells are capable of responding to
stimuli of high spatial frequencies, while Y-cells respond vigorously to stimuli of low
spatial frequency. Thus, we can infer that the Y-channel is important to encode visual
aspects related to motion processing, while X-cells are related to processing information
such as form (Tolhurst, 1973; Stone, 1983).
The two functional classes of cells in retina also differ in their projections to the
LGN. X-cells project mainly to the contralateral layer A and Y-cells diverge to project to
relay, the LGN is a laminated structure localized in the thalamus, conveying visual
information from the retina to the cortex. In the cat, the LGN is composed of three main
layers: A, A1 and C, exhibiting a retinotopic organization with emphasis in the
representation of the the central region of the visual field (Sherman and Guillery, 2002,
see Figure 1). The receptive field (RF) structure of LGN neurons is concentric, with an
antagonistic center-surround organization, similar to those observed in retinal ganglion
cells, and with either ON-center or OFF-center (Hubel and Wiesel, 1962).
1 . 2 NE U R O N A L E N C O D I N G
Specific modalities of sensory stimuli such as pressure, sound level or visual
contrast have been thought to be encoded by the spiking rate of neurons. In the visual
system, the relay cells in the LGN transmit visual information encoded by retinal
ganglion cell responses to the primary visual cortex. The notion of feature encoding by
firing rate has its roots in the seminal studies of Hubel and Wiesel (1961) using
simplified stimuli such as light spots and oriented bars.
A simple demonstration of how the spiking responses encode stimulus
characteristics can be seen in the experiments of Hubel and Wiesel (1961) in the LGN.
As shown in Figure 2, the size of the stimulus strongly modulates the neuronal
RF, the responses are vigorous. However, when the stimulus reach the surround
subregions of the RF, responses decreases. Thus, the concentric organization of the RFs
in the retinogeniculate pathway provides a way of encoding a simple feature of the
visual stimulus, its size.
Average firing rates, however, are not the only possibility for representing a
stimulus. It has been argued that the fine temporal structure of the responses may be
relevant for encoding. Accordingly, experimental and theoretical evidence has shown
that the relative timing structure of single cell responses (Reich et al., 1997), relative
spike latencies in populations (Gollisch and Meister, 2008), and phase-locking between
spikes and ongoing oscillatory activity (Koepsell et al., 2010) carry information about
the stimulus.
1 . 3 TH E B I N D I N G B Y S Y N C H R O N I Z AT I O N H Y P O T H E S I S
As discussed before, information from the visual scene is decomposed and
processed in parallel pathways which ultimately converges onto higher visual areas,
where neurons respond selectively for combinations of color, motion, orientation,
texture, shape and depth. Feedforward connections from earlier processing stages to
higher areas, such as V2, V4 and MT, coexist with reciprocal feedback (Rosa and
Tweedale, 2005; Sillito et al., 2006) and lateral connections (from equivalent level of
processing) (Wunderle et al., 2013). Thus, the visual system seems to work in a
hierarchical fashion, first analyzing the various elemental features which are combined
later in higher areas. How bits of visual information are bound into coherent wholes?
Which are the mechanisms responsible for perceptual binding? This is still a largely
unresolved question and still a big challenge for neuroscience.
An important step for understanding perceptual binding mechanisms was made
by the synchronization hypothesis proposed by von der Malsburg (1981). Essentially,
Christoph von der Malsburg‘s idea was that the elementary features of perceptual
objects are linked together by the synchronous activity of distributed neuronal
assemblies. The synchronization of the spiking activity at very fine time scale (order of
milliseconds) would provide a mechanism for building flexible relationships in the
brain. This would explain how we bind information related to one object and distinguish
from the background (see the dalmatian dog in Figure 3).
Experimental evidence for the binding by synchronization hypothesis was first
obtained in the visual cortex of the cat (Eckhorn et al., 1988; Gray et al., 1989). In
response to simplified stimuli, such as moving bars, single cells and groups of cells
(multi-unity activity, MUA) in areas 17 and 18 exhibit strong oscillatory activity at the
gamma range, from 35 to 85 Hz (Figure 3). In these seminal studies, periodic activity in
spiking activity was found to be highly correlated with the simultaneously recorded
local field potential (LFP). Action potentials generated synchronically within gamma
cycles would have a higher probability to generate new action potentials in target cells,
allowing for a neuronal coding based on timing relationships (see review in Uhlhaas et
al., 2011). These findings suggest that columns at different regions of the cortex may
synchronize their activity, leading to synchronous ensembles representing distinct
surfaces or objects in a visual scene. Interestingly, gamma oscillatory responses were
not found in the LGN (Gray and Singer, 1989) indicating that the gamma oscillations
resulted from an intracortical mechanism.
An important finding in these early studies was that synchronization of neuronal
responses appears only for single contour objects (such as a single coherent bar, Gray et
al., 1989) but not by different contours moving in different directions (Engel et al.,
1991), revealing that synchronization is highly context-dependent (Singer, 1999). The
idea that synchronization can mediate a binding mechanism was supported later by a
series of experimental studies in cats and monkeys (Engel et al., 1991; Kreiter and
Singer, 1996). Evidence was obtained not only for simple moving bars but also for
bi-stable stimuli such as moving plaids (Castelo-Branco et al., 2000). Cells in area 18 and
another cortical area called postero-medial bank of the lateral suprasylvian sulcus
(PMLS) of the cat synchronize their responses when induced by contours of the same
surface (pattern motion of the plaids) but not by contours belonging to different surfaces
(component motion of the plaids). These results are very interesting because in principle
they could provide an explanation for perceptual dynamics.
A number of studies, mainly in behaving monkeys, however, have shown
contrary evidence for the binding by synchronization hypothesis (Thiele and Stoner,
2003; Roelfsema et al., 2004; Palanca and DeAngelis, 2005; Lima et al., 2009). These
studies are very important in trying to establish a direct correlation between neuronal
anesthetized cat. In addition, a body of evidence has been gathered recently showing
that gamma processes are associated with attention (Engel et al., 2001; Fries et al.,
2001, see review in Fries, 2009) and temporal expectancy (Lima et al., 2011). These
latter studies suggest that gamma synchronization may be important for controlling the
flow of information across the cortical networks.
Overall, a consensus on the role of gamma oscillations in cognitive function is
still lacking. A possible reason is that gamma oscillations may be related to more than
one elementary function in the highly diverse neural subsystems that composes the
brain (Merker, 2013).
1 . 4 SY N C H R O N O U S O S C I L L AT I O N S I N T H E E A R LY V I S U A L S Y S T E M
Oscillations are not restricted to the cortical networks. In fact, oscillatory
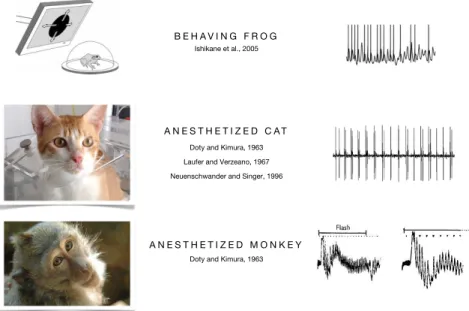
responses were observed in the optic nerve and eye as early as the first recordings of Figure 4. Fast retinal oscillations have been described in a variety of animals, such as the frog, rabbit (not shown), cat and monkey, with intracellular (frog) and extra-cellular recording techniques. Oscillations are generally seen in MUA responses to large visual stimuli and also spontaneously, in the dark.
A N E S T H E T I Z E D M O N K E Y A N E S T H E T I Z E D C A T
B E H A V I N G F R O G
Doty and Kimura, 1963
Laufer and Verzeano, 1967
Neuenschwander and Singer, 1996
neuronal activity became available (Gotch, 1903; Fröhlich, 1914; Granit and Therman,
1935). Activity in sensory systems, in particular, are commonly associated with fast
oscillations, such as in the olfactory bulb (Laurent, 2002), somatosensory (Ahissar et
al., 2000) and auditory cortices (Roberts and Rutherford, 2008), and in the insect optic
lobe (Kirschfeld, 1992). In the retina, prominent oscillations have been described in
various species, including the frog (Ishikane et al., 1999; Ishikane et al., 2005), rabbit
(Ariel et al., 1983), cat (Doty and Kimura, 1963; Laufer and Verzeano, 1967; Arnett,
1975; Neuenschwander and Singer, 1996; Neuenschwander et al., 1999) and monkey
(Doty and Kimura, 1963) (Figure 4). Strong oscillations in retinal ganglion cell activity
can be observed for responses to large spots of light, covering the center and the
surround subregions of the RFs (Neuenschwander et al., 1996), as well as Ganzfeld
illumination (Laufer and Verzeano, 1967), and also spontaneously, in the dark (Bishop
et al., 1964; Neuenschwander et al., 1999). Correlation analysis of multi-electrode
recordings suggested that synchronous oscillations in the retina arises from large-scale
interactions between the ganglion cells (Laufer and Verzeano, 1967; Neuenschwander et
al., 1999, see example in Figure 5). In the cat, synchronization of oscillatory responses
has been observed for distances larger than 20 degrees of visual angle across the retina
(Neuenschwander and Singer, 1996). Moreover, fast oscillations were found in Figure 5. Synchronous oscillations in the retina arises from population interactions. MUA traces show strong oscillatory responses to a large spot of light. Notice that correlated individual spikes from different cells exhibit missing cycles. Color arrows indicated spikes from different cells. Qualitative analysis (data from Neuenschwander and collaborators, Max-Planck Institute for Brain Research, Frankfurt).
responses to all functional types (ON and OFF-cells, X- and Y-cells) in the retina and
LGN (Ariel et al., 1983; Neuenschwander et al., 1999; Ito et al., 2010).
An important aspect in the organization of the retinogeniculate system is the
reliability of information transfer. Retinal afferents to the LGN consist of thick axons
involving richly branched terminal arbors with boutons densely distributed in terminal
clusters (Sherman and Guillery, 2006). This exquisite organization confers great
robustness for the retinogeniculate transmission. Analysis of retinal excitatory
post-synaptic potentials (EPSPs) associated with LGN spike waveforms (S-Potentials) shows
that most LGN neurons have one retinal ganglion cell input that accounts for nearly all
LGN spikes sent to visual cortex (> 95% of LGN spikes are associated with an EPSP
from a single retinal ganglion cell, Sincich et al., 2007). Thus, it is not surprising to see
that the retinal fast oscillations are faithfully transmitted through the retinogeniculate
pathway up to the LGN. Accordingly, it has been demonstrated by means of
simultaneous recordings from the retina and LGN that retinal oscillatory inputs survive
transmission at the retinogeniculate synapses (Arnett, 1975; Neuenschwander and
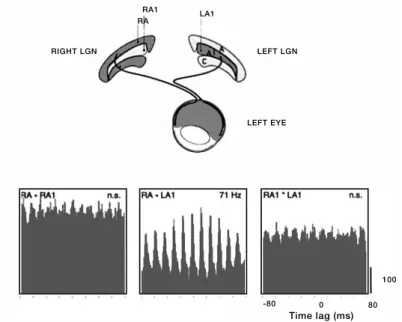
Singer, 1996). Moreover, simultaneous recordings from the LGNs in the two
hemispheres have shown that only LGN cells receiving inputs from the same eye are Figure 6. Feedforward synchronization in the retinogeniculate system. Synchronization of oscillatory responses is seen only among LGN cells receiving inputs from the same eye (right lamina A and left lamina A1, RA - LA1), whereby it did not matter whether the cells were located in the same LGN or in the LGNs of the two hemispheres. Direct recordings form the retina and LGN have demonstrated that the synchronizing mechanism resides in the retina (from Neuenschwander and Singer, 1996).
LEFT EYE LEFT LGN RIGHT LGN
RA
RA1 LA1
-80 0 80
capable of synchronizing their responses (Figure 6), excluding thalamic mechanisms
since they cannot account for synchronization across the two hemispheres
(Neuenschwander and Singer, 1996). In addition, recordings from the retina, LGN and
visual cortex in the cat (Castelo-Branco et al., 1998) have provided direct evidence that
oscillatory responses from the retina are transmitted to the cortex, characterizing a
feedforward synchronization mechanism in the early visual system (Neuenschwander et
al., 2002).
It is important to notice that although retinal oscillations are transmitted to the
cortex, they do not necessarily contribute to generate cortical gamma. In the study of
Castelo-Branco et al. (1998) in the cat, data from simultaneous recordings from the
retina, LGN and cortex (areas A17 and A18) indicate that gamma in the cortex arises
independently from oscillatory retinogeniculate inputs. Moreover, in the cortex, gamma
responses are very sensitive to the orientation selectivity of the cells (Gray and Singer,
1989), a feature that is irrelevant for responses in the retina. Another important finding
in the study of Castelo-Branco et al. (1998) is the noticeable differences in oscillation
frequencies. Gamma oscillations in the cortex have frequencies in the range of 30 to 60
Hz, while fast oscillations in the retina have frequencies at a much higher band, from 60
to 120 Hz. It is possible, however, that synchronized responses in the retina bias
synchronization of responses at the cortical level. Alternatively, synchronous inputs to
postsynaptic cells may improve information transmission (Dan et al., 1998). For all
these conjectures, at present it is still unclear whether fast oscillatory retinogeniculate
inputs contribute or not to cortical processing.
1 . 5 RE T I N A L O S C I L L AT I O N S A S A N E N C O D I N G M E C H A N I S M
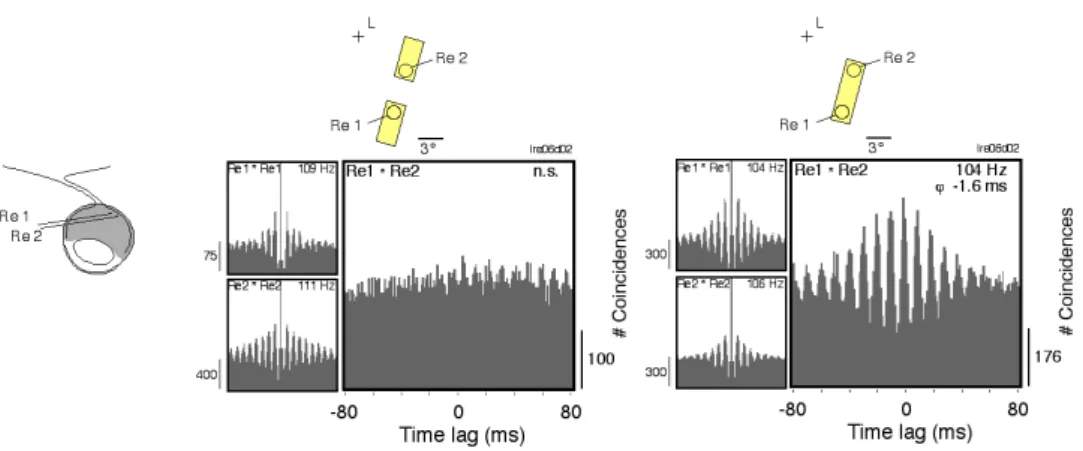
If retinal oscillations indeed play any role in vision they most likely convey
stimulus information upstream to the cortex. In the anesthetized cat, Neuenschwander
and Singer (1996) showed evidence that synchronization of oscillatory responses in the
retina (and in the LGN) depends on stimulus continuity. Rectangular stimuli flashed
over the RFs elicited strong oscillatory responses, which were correlated only when the
stimulus was contiguous, linking the two RFs (Figure 7). Based on these findings, the
authors proposed that retinal oscillations serve as a mechanism for conveying
parallel with the hypothesis of feature binding by gamma synchronization. Cortical
feature space is far more complex, such as the representation of stimulus orientation,
color, form and texture. In the retina, on the other hand, representational space is
restricted to simpler features, such as position, contrast and size. These ideas gained
support with a recent model of the inner retina showing that correlated oscillatory
activity in the retina convey size information (Stephens et al., 2006). It is possible that
large features in a visual scene, such as continuous surfaces, are encoded by the global
synchronous population activity in the retina. To determine if encoding of stimulus size
depended on connectedness independent of object shape, Stephens et al., (2006) ran a
simulation of responses to a random binary checkerboard stimulus, in which every pixel
changed incrementally its color from black to white (see example in Figure 11). The
sudden appearance of large connected blobs in the stimulus (at the percolation
threshold) led to a sharp phase transition in the oscillatory behavior. Interestingly,
synchronization of oscillatory responses of retinal ganglion cells in the frog is correlated
with escape behavior (Ishikane et al., 2005). These findings are relevant because they
point to a direct link between retinal oscillations and behavior.
Encoding by temporal correlations and by firing rates are not exclusive. As
proposed by Koepsell et al. (2009), a temporal code may co-exist with a rate code in the
Figure 7. Synchronous oscillations in the retina encode stimulus continuity (from Neuenschwander and Singer, 1996). Response to rectangular light stimuli that were either separated by a gap or were contiguous and covered the area between the RFs. When the stimuli were separated, they elicited
responses that oscillated with similar frequency (ca. 110 Hz) at both sites but showed no synchrony (left).
When the stimuli were spatially contiguous, the oscillatory responses in the LGN became highly
retina. It is even possible that information about local contrast features and global size
are carried independently by multiplexed channels.
In the present study, we investigate the role of fast oscillations in the retina on
stimulus encoding based on recordings from the LGN in the anesthetized cat. We used a
variety of simplified stimuli to test how oscillatory behavior is related to stimulus
continuity and connectedness. In particular we tested experimentally the stimulus
proposed in the theoretical study of Stephens et al. (2006). We also used dynamical
stimuli, such as natural scene movies, to verify whether retinal oscillatory responses are
present for more naturalistic conditions.
1 . 6 AN E S T H E S I A E F F E C T S
Halogenated anesthetics, such as halothane and isoflurane, have been commonly
used in many studies of rhythmic activity in the brain. In the cat, cortical gamma
oscillations seem to survive the anesthesia, although efforts are generally made to have
it at low levels (lightly anesthetized animal, e.g., Gray et al., 1989). Nevertheless, it has
been demonstrated with stimulation of the mesencephalic reticular formation that high
cortical activation levels (Munk et al., 1996; Herculano-Houzel et al., 1999) facilitate
gamma activity in the cortex of anesthetized cats. Moreover, a series of recent studies in
the behaving monkey have shown that gamma responses are modulated with attention
(Womelsdorf et al., 2007; Fries 2009) and temporal expectancy (Lima et al., 2011).
Based on these reports one may conclude that low cortical activation, as during the
anesthesia, generally damps gamma responses in the cortex.
Similarly, retinal oscillations have been studied mostly during halothane or
isoflurane anesthesia (Laufer and Verzeano, 1967; Neuenschwander and Singer, 1996;
Ito et al., 2010). A few studies in the 60‘s reported retinal oscillatory responses in
non-anesthetized, paralyzed cats submitted to transpontine transection (Doty and Kimura,
1963). To clarify whether halothane has an effect on the generation of retinal
oscillations we varied systematically the concentration levels of this anesthetic during
2. OB J E C T I V E S
Our primary goal with this study was to test if retinal oscillations (recorded here
in the LGN) serve as an encoding mechanism for stimulus size and continuity as
proposed by a number of theoretical studies. In order to investigate stimulus
dependencies we applied a series of stationary stimuli of various sizes and luminance
values. We compared the oscillatory responses to these simplified stimuli with
responses to stimuli of increasing complexity, such as binary and gray-level natural
movies.
In addition, we have examined how oscillatory responses recorded in the LGN
are dependent on the anesthesia. We studied in particular the effects of halothane and
isoflurane, halogenate anesthetics that have been routinely used in many studies of
neuronal oscillations in cats and monkeys.
S p e c i f i c g o a l s
• Evaluate the dependencies of retinal synchronous oscillations on stimulus size
and contrast;
• Verify whether breaking of stimulus continuity disrupt synchronous oscillatory
responses;
• Test if the sudden emergence of large connected clusters (percolation threshold in
random binary checkerboards) leads to transitions in the oscillatory patterning of
the responses;
• Verify whether retinal oscillations are also present in responses to spatial and
temporal complex stimuli, such as gratings and natural scene movies;
• Test the dependencies of the oscillatory responses on halothane (and isoflurane)
3. ME T H O D S
Adult cats from the Brain Institute’s colony were used in this study (N= 5). All
experimental procedures were previously approved by the ethical committee for animal
experimentation of the Universidade Federal do Rio Grande do Norte (CEUA-UFRN
protocol nº 019/2012).
Recordings of LGN responses in anesthetized cats were obtained by means of up
to 5 electrodes placed at the representation of the central visual field. Our analysis
consisted in obtaining indicators for the incidence and strength of oscillatory responses
in the retina, which are known to be transmitted faithfully to the LGN (Neuenschwander
et al., 2002). Auto and cross-correlation functions were computed for spiking responses
in order to estimate the modulation amplitude and frequency of the oscillations. The
time course of the oscillatory responses was evaluated with a sliding window analysis.
In addition, the rate levels were estimated by means of average response histograms
(PSTHs). Analysis was based on the NEUROSYNC package developed by S.
Neuenschwander, at the Department of Neurophysiology, Max-Planck Institute for
Brain Research, Frankfurt.
To test the role of retinal oscillations in stimulus encoding we used a variety of
visual stimuli, including spots of light of various sizes and contrasts, checkerboards,
moving gratings and natural scene movies.
In addition in this study we examine the effects of halogenated anesthetics such
as halothane on retinal oscillations.
3 . 1 EX P E R I M E N TA L S E S S I O N S
Experiments were done in the anesthetized cat. Different anesthetics (e.g.,
ketamine, halothane, isoflurane, fentanyl) were used to establish whether retinal
oscillations are dependent on the agent and level of anesthesia.
3 . 1 . 1 SU R G I C A L P R O C E D U R E S, A N E S T H E S I A A N D L I F E S U P P O R T
An experiment started with an intramuscular injection of ketamine (10 mg/kg,
allow the maintenance of the inhalation anesthesia by artificial ventilation with a gas
mixture of N2O (70%) and O2 (30%), supplemented with halothane (0.8 to 1.2 %,
Tanohalo - Halotano, Cristália; in some experiments isoflurane was also used at similar
concentrations). To ensure the immobilization of the eyes, a muscle relaxant
(pancuronium bromide, 0.25 mg/kg/h) was administrated i.v. continuously during the
experiment. Vital signs such as the ECG, ventilation pressure, rectal temperature
(maintained at 37°C) and expired CO2 (kept in the range of 2.6 to 3.5 %) were
continuously monitored during the experiments by means of a medical life monitoring
system (GE Dash 3000 Patient Monitor). Fluid loss was compensated by continuous i.v.
infusion of saline solution and glucose (5%).
After the animal was placed in the stereotaxic apparatus, a craniotomy was made
in the skull above the LGN (AP 6.5 and ML 9.5). Subsequently, a recording chamber
made of titanium with 14 mm of internal diameter was mounted over the exposed
region and secured into the bone with titanium screws and dental cement. A metal rod
was also secured on the skull for fixation of the head. At the end of all surgical
procedures, the stereotaxic ear and eye bars were removed and the halothane
concentration adjusted between 0.6 and 0.8%. Recordings were obtained during the
following 3–5 days.
During visual stimulation, the pupils were dilated and the nictitating membranes
retracted by means of atropine applied topically (1%). Contact lenses with an artificial
pupil of 3 mm diameter were used to protect the cornea. The representation of the area
centralis was plotted on a white board with help of a fundus camera (Zeiss, Germany)
and served as a reference for estimating the position of the receptive fields.
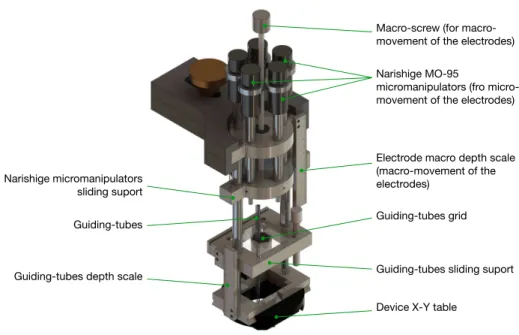
3 . 1 . 2 RE C O R D I N G D E V I C E A N D E L E C T R O D E S
For the recordings we used a custom made system fitted with up to 5
independently movable electrodes. This system was designed by S. Neuenschwander at
the Max Planck Institute for Brain Research, Frankfurt.
The recording device consisted of 5 Narishige hydraulic microdrives mounted in
a 6 X 5 grid for positioning of the guiding-tubes. The position of the guiding-tubes was
decided previously based on stereotaxic atlas of the cat.
For electrode guiding two needles were mouted in each other (Braun 100
Sterican Ø 0.60 x 60 mm, 23G x 2 ⅜” and Ehrhardt Supra Einmal-Kanülen Ø 0.30 x 23
mm) to obtain a total length of 82 mm. The thicker extremity was used for fixation in
grid (the hole size was sufficient to allow the passage and hold the guiding-tubes), while
the thinner one was placed into the brain.
A glass capilar mounted at the end of the guiding-tubes served as a piston for
moving the electrodes. A piece of needle was used to connect the glass capilar to the
micromanipulators. The recording device was fixated on recording chamber with an
adapter screwed in the recording chamber. X-Y positioning of the guiding-tubes was
adjusted previously to the descent of the electrodes by means of a Narishige X-Y table
(parts of the Narishige MO-95 recording system).
In this study we used tungsten-platinum, quartz-insulated, fiber electrodes (80
µm diameter, Thomas Recording, Germany), see Figure 9. These electrodes were
Figure 8. Schematic representation of our electrode recording system based on Narishige oil-hydraulic microdrives and X-Y table (parts of the MO-95 microdrive, Narishige, Japan). Designed by S. Neuenschwander at the Max-Planck Institute for Brain Research, Frankfurt, 2005. Simulation by Heitor de Oliveira, Brain Institute - UFRN, Natal.
Macro-screw (for macro-movement of the electrodes)
Narishige MO-95
micromanipulators (fro micro-movement of the electrodes)
Electrode macro depth scale (macro-movement of the electrodes)
Guiding-tubes grid Guiding-tubes
Device X-Y table Narishige micromanipulators
sliding suport
chosen because they have a very good signal to noise ratio, they are strong enough to
penetrate the intact dura-mater, and have high biocompatibility. The tips were prepared
in a grinding machine (Thomas Recordings, Gießen, Germany) to expose the metal core
with a conical shape (expose tip of 20 µm). Electrodes were connected by welding thin
flexible wires to them.
3 . 1 . 3 SI G N A L C O N D I T I O N I N G A N D D ATA A C Q U I S I T I O N
After the fixation of the recording device and positioning of the guiding-tubes
we generally made a series of exploratory penetrations, usually with a single electrode,
in order to find an appropriate position of the electrodes aiming at the central
representation of the visual field.
Spiking activity from neuronal groups (MUA) were obtained after amplification
and band-pass filtering the signals (0.7 – 6.0 KHz) with a 32-channel Plexon modified
preamplifier fitted with an HST16025 headset (Plexon Inc, Dallas, TX, USA). Data
acquisition was made using the program SPASS, an acquisition system based on
National Instruments boards (M-series acquisition boards, National Instruments, Austin,
TX, USA) written in LabVIEW by S. Neuenschwander at the Max Planck Institute for
Brain Research, Frankfurt. Signals were sampled at 32 kS/s with an additional 10 X
onboard amplification. Spikes were detected with an amplitude discrimination with
threshold set to twice the noise level.
Figure 9. Quartz-insulated tungsten-platinum electrodes. Notice that electrode‘s impedance depends
largely on the size of the exposed tip. Electrodes of 0.5 Ω impedance as used in this study are better for
MUA recordings. Electrodes were manufactured in our laboratory from quartz electrode fibers using a a special grinding machine (Thomas Recording, Gießen, Germany).
80 µm
METAL CORE
TIP
1.0 MΩ
0.5 MΩ
3 . 2 . VI S U A L S T I M U L I
Visual stimuli were presented on a 21” CRT monitor (Hitachi, CM815ET),
placed at 57 cm of distance from the cat, with a refresh rate of 100 Hz and 1024 x 768
pixels resolution. In these conditions 1° of visual field corresponded to approximately to
25 pixels. The screen was gamma-corrected in order to achieve a linear perception of
luminance (illumination range from 25 to 200 Lux). To control the stimulus presentation
we used the software ActiveStim (www.activestim.com). Protocols consisted of a series
of 60 to 300 repetitions. Generally, stimuli were centered at the mapped receptive field.
All different types of stimuli from different protocols were presented in a random order.
At the beginning of the recording sessions, the receptive field of the cells were
mapped with an automatic algorithm based on a moving bar (1000 X 5 pixels) crossing
the whole field of the monitor in 16 different directions (Pipa et al., 2012). RF maps
were obtained by compiling an average matrix, in which the responses to the moving
bar were added in 10 ms bins (corresponding to 0.2° in visual angle) for all directions
(see example in Figure 14). Depending on the eccentricity of the RFs the electrodes
were moved to a new position aiming at a region corresponding to the central
representation of the visual field.
Figure 10. Stimulus size and circle annular mask protocols. We used annular masks to test whether breaking stimulus continuity disrupts oscillatory responses to a circle. Stimuli were centered at the RF fields. Stimulus sizes are indicated in degrees of visual angle (same conventions in all other figures).
C I R C L E S I Z E
C I R C L E A N N U L A R M A S K
3° 5° 7° 7° 9° 9° 10° 10° 12° 12° 14°
10°
2° 3° 4° 6° 7° 8° 11° 12° 13°
C i rc l e s i z e
In order to analyze the effects of the stimulus size and contrast on firing rates
and oscillatory responses, we presented circles of 10 different sizes (2°, 3°, 4°, 6°, 7°,
8°, 10°, 11°, 12° and 13° of visual angle) with 3 different contrast levels (relative levels
of 1.0, 0.5 and 0.3, ranging from 175 to 50 lux; background illumination of 1.0 lux).
Sessions comprised 10 stimulus repetitions for a total of 300 trials.
C i rc l e a n n u l a r m a s k
We used annular masks to test whether breaking stimulus continuity disrupts
oscillatory responses to a circle. These stimuli had a shape of donut and were placed
centered over individual RFs, in a way that the responses to the central circle were
independent of the peripheral annulus. Annular masks and solid circles were presented
randomly with different sizes (sequence of 3° circle, 5° circle, 7° circle, 7° masked
circle, 9° circle, 9° masked circle, 10° circle, 10° masked circle, 12° circle, 12 ° masked
circle, 14° circle and 14° masked circle; Figure 10).
P e rc o l a t i o n s t i m u l u s
Our percolation protocol consisted in presenting sequences of checkerboard
binary images, in which every pixel changed its luminance randomly and once, from
black to white (gray background, see Figure 11). This stimulus was proposed by
Stephens and colleagues in a theoretical study (Stephens et al., 2006) to test if
oscillation dynamics in the retina show a transition point in response to a change in the
spatial properties of the images, when all points get connected (percolation phase Figure 11. Percolation stimulus. This stimulus protocol was designed to test if oscillation dynamics in the retina show a transition point in response to a change in the spatial properties of the images, when all points get connected (percolation threshold). RF position is indicated by the color circle in the center of the stimulus (same conventions in all other figures).
transition). The duration of this protocol was controlled and ranged from 1 to 6 seconds
and each session had either 50 or 100 trials. Thus, the speed of the appearing white
pixels also changed. As a control, we used a solid circle (of same size) with luminance
increasing linearly (ramp). This control stimulus was presented randomly with the
percolation stimulus.
N a t u r a l m o v i e s a n d g r a t i n g s
In general, retinal oscillations have been studied with simplified stimuli, such as
spots of lights, bars, gratings, and Ganzfeld stimuli (Neuenschwander et al., 1999;
Laufer and Verzeano, 1967). In many cases the stimuli were static and uniform, very
different from the natural vision. To test how spatial and temporal dynamics in the
stimulus change oscillation behavior we used 4 types of dynamic stimuli: gray-scale
natural scene movies (200 luminance values), binary natural scene movies (2 luminance
values), randomly flickering checkerboards (temporal frequency from 25 to 50 Hz) and
moving gratings (temporal frequency 0,33 Hz, 1,25 Hz and 3 Hz) (see examples in
Figure 18). Two different natural scene movies were presented (referred here as
LabPan and Medikament), consisting of pan images of the laboratory (the same stimuli
Figure 12. Dynamical visual stimuli. Gray-level natural scene movies had 200 luminance values (LabPan
movie is depicted here). Binary natural scene movies were displayed with 2 luminance values (black and white). The movies were made with a single global motion component made with a long camera panning
(same stimuli used in Haslinger et al., 2012). Random stimuli consisted of flickering checkerboards.
Grating stimuli moved at temporal frequencies of 0,33 Hz, 1,25 Hz and 3 Hz.
R A N D O M
used in the study of Haslinger et al., 2012). Trials had duration of 5 sec and each
stimulus was repeated 60 times in a pseudorandom order.
3 . 3 . HA L O T H A N E E F F E C T S
To test the effects of halothane anesthesia we varied systematically its
concentration levels during the recording sessions (Dräger Vaporizer, Germany).
Accurate estimation of the partial expiratory concentration of halothane (and isoflurane)
in the ventilation system was obtained from readings of the life monitoring apparatus
(GE Dash 3000 Patient Monitor). During the manipulations of halothane (and
isoflurane) levels we supplemented the anesthesia with ketamine or fentanyl (even in
case of total absence of halothane or isoflurane). These supplementary anesthetics were
applied well before the recording sessions.
For testing the effects of halothane we used various static and dynamical stimuli
(circle, linear ramp, natural scene movies and gratings) with characteristics known to
induce strong oscillatory responses in the retina (large, high contrast stimuli). For the
circle stimuli, halothane concentration was changed from 0.74% to 0.20% (at 20 trials
recording sessions for each condition), or smoothly from 1.0% to 0.0% (300 trials
recording session over about 1 hour). For the linear ramp stimuli, we decreased the
halothane levels from 0.95% to 0.20% to obtain recording sessions of 50 trials (2.0 to
3.0 sec duration). For the natural scene movies, we decreased the halothane levels from
1.0% to 0.19% in 3 steps. Finally, for the gratings stimuli, we decreased the halothane
levels from 0.94% to 0.0%. In all cases as a control the concentration of halothane was
restored to previous levels. In a few experiments we substituted halothane for
isoflurane, which is of the same family of halogenated anesthetics.
3 . 4 . DATA A N A LY S I S
Our analysis was mainly focused on the spiking activity of groups of neurons
(multi-unity activity, MUA). Only occasionally we have used spike sorting methods to
study single unity activity (SUA). Analysis was made using the NEUROSYNC
packaged developed in LabVIEW (Austin, Texas, USA) and in Matlab R10
Wave_clus developed by Rodrigo Quiroga (Quiroga et al., 2004). This method uses a
set of wavelet coefficients from each spike selected by a Kolmogorov-Smirnov test of
normality as an input to the clustering algorithm. An automatic clustering algorithm
(super-paramagnetic clustering) identifies different clusters of spikes based on the
selected set of wavelet coefficients.
In order to access the rate and timing of neuronal spike activities induced by
visual stimuli, response histograms were computed with a resolution of 10 ms. We
decided to use small bin sizes because retinal oscillations are known to be very fast (up
to 100 Hz). A 500 to 1000 ms window was used for estimating average firing rates over
different response epochs.
Our analysis of neuronal oscillations was made in the time domain. Correlation
functions for spiking responses were computed for 500 to 1000 ms analysis windows.
For a quantitative analysis a Gabor function was fitted to the correlograms and its
parameters were used to infer the strength and frequency of the synchronous
oscillations. The Levenberg-Marquardt algorithm was used (described in Press et al.,
1986) for the fitting procedure. To estimate correlation strength, a modulation amplitude
index was computed as the ratio between the amplitude of the central peak of the fitted
function and its offset. In cases when an oscillatory patterning of the responses was
detected, we used two metrics to evaluate oscillations strength: the oscillation amplitude
(correlograms were normalized by the geometric mean of firing rates) and the
modulation amplitude of the first satellite peak (MAS) (König, 1994).
A sliding window analysis was applied to follow the oscillatory behavior of the
responses over time. This analysis consists of sampling the response using a 100-ms
analysis window in 50-ms steps. Correlograms obtained for each overlapping window
were then plotted as a two-dimensional array, where the y-axis denotes time lag of the
correlation and the x-axis denotes the time course of the responses. The amplitude of the
correlograms was normalized by the geometric mean of firing rates and displayed with a
color code.
Comparisons between stimulus conditions group data was subject to the analysis
of variance (ANOVA, after testing for normal distribution) and post-hoc Bonferroni for
testing differences in pairs of mean values. Confidence interval was chosen with 95% (p
4. RE S U LT S
4 . 1 . DE P E N D E N C I E S O N S T I M U L U S S I Z E
To test how stimulus size modulates the strengh of retinal oscillations (seen here
in LGN responses) we used a simple circular light stimulus, which was flashed over the
RFs of the recorded neurons. The sliding analysis presented in Figure 13 gives an
example of how strong oscillations in the retinogeniculate system can be in response to
a large stimulus (in this case, 10°). We used 10 different sizes of the simulus at 3
luminance levels (175, 80 and 50 Lux, corresponding to contrast ratios of 1.0, 0.5 and
0.3) (N= 14 recording sessions, comprising 3 different experiments, 10 repetitions for
10 different sizes). As a metric to characterize the oscillation strength in MUA
responses, we have taken the amplitude of the oscillation from the fitted function in the
correlograms (oscillation amplitude, see Methods). Comparisons across conditions have
shown significant differences for stimulus size for all contrast levels (p < 0.05 for the
stimulus sizes of 4°, 7°, 8°, 10°, 11° and 12°). Mean values and standard deviations for
oscillation amplitude and firing rates are given in Table 1.
To analyze how oscillation strength varied as a function of stimulus size we
compiled plots separately for the 3 luminance values studied (Figure 13). Oscillation
strength increased as a function of stimulus size non linearly, without reaching a
plateau. The level of responses, on the other hand, reached a maximum already for a
stimulus of 4°. Thus, in our data, oscillation strength was clearly independent of the
spike rate.
Synchronization in the LGN was always accompanied by oscillations. Figure 14
shows an example of a cross-correlation computed for MUA pairs with RFs separated
by about 3°. Recordings were obtained from different electrodes. Observe that the
modulation of the correlogram is very strong (oscillation frequency, 87 Hz; MAS, 0.76).
Figure 13. Stimulus size and luminance modulate fast oscillations in the retinogeniculate system. MUA
recordings were obtained from the LGN of the anesthetized cat. (Left panels) Autocorrelation sliding
window analysis show strong oscillatory responses to a high contrast circle of 10° diameter flashed over the RF (oscillation frequency at 78 Hz), while a 8° stimulus evoked weak oscillations for the same
contrast. Sliding window size, 200 ms; step, 100 ms. (Right plots) Population data, traces show response
levels (firing rate, upper plot) and oscillation amplitude (lower plot) as function of stimulus size. Notice
that rates and oscillation strength have different trends. Plots show data obtained for 3 different stimulus luminance levels (175, 80, 50 Lux). Analysis window of 1000 ms, as indicated by the dashed line at the bottom of the sliding window plots. In this study correlograms were normalized by firing rates (normalized coincidences). Arrows indicate the points corresponding to the data used for the sliding window analysis (corresponding respectively to stimulus sizes of 8° and of 10°).
0.25
175 Lux
50 Lux 80 Lux
2° 3° 4° 6° 7° 8° 10° 11° 12° 13°
Rate (sp/s)
Osc. Amplitude
C i rc l e s i z e
0.00 200 0 Time (ms) 80 0 -80 Time (ms) 80 0.3 0.0 0 -80 Coincidences 8 °
1 0 °
T i m e 5 0 0 m s cgl04i0206 5-5
cgl04i0207 5-5
Figure 14. Synchronous oscillatory responses to a circular light stimulus for a pair of MUA ON-cells with corresponding RFs separated by approximately 3°. Panels show crosscorrelograms computed with a bin of 1 ms. Oscillation frequency, 87 Hz; Modulation amplitude (MAS), 0.76. Shuffling the correlation by 1-trial (shift-predictor) gives a flat function, indicating that correlation arises from interactions in the retinal networks. Fitted functions are displayed as black thin lines over the correlograms. Analysis
window, 1000 ms. Stimulus was flashed over the RFs (size, 14°). (Upper inset) RF mappings obtained by
means of a moving bar showed at 16 different directions (Pipa et al., 2012). Data from two independent
electrode channels (RF maps were merged for visualization). Stimulus borders are indicated by the circle line on the RF mapping plots.
2.0
0.0
Coincidenc
e
s
-80 0 80
Time (ms) CROSSCORRELATION 2° cgl03d0513 5-4 87 Hz 0.76
1 4 °
stimulus coordination.
4 . 2 . BR E A K I N G S T I M U L U S C O N T I N U I T Y
To test whether stimulus continuity is relevant for supporting long-range
oscillatory interactions in the retina, we designed a stimulus that consisted of an annular
mask superimposed on circular stimuli of various sizes (center part of the stimulus had
5°, see Figure 10). The presence of a mask outside the borders of the RFs should hinder
oscillatory responses for the center part of the stimulus, because the vicinity being not
activated should not mediate synchronization. As shown in the plots of Figure 15,
annular masks had a profound effect on oscillation amplitude, even though the rates
remained the same (rates tend to decrease with stimulus size in both unmasked and
masked conditions; N= 24, 3 different experiments). Notably, in these experiments, the
effect of stimulus size on oscillation strength seemed to reach a plateau for a stimulus of
10°.
Figure 15. Breaking stimulus continuity disrupts oscillatory responses to a circle stimulus. (Left panels)
Strong oscillatory responses to a high contrast circle of 9° (upper panel) are disrupted by a dark mask
cutting off the central region of the stimulus over the RF (middle panel). Oscillation frequency, 99 Hz.
These effects cannot be explained by a simple decrease in luminance level because oscillations are also
disrupted for a larger stimulus (12°, lower panel). Sliding window size, 200 ms; step, 100 ms. (Right
plots) Population data. Notice that oscillation amplitude is always lower for annular masked stimuli. Analysis window, 1000 ms (dashed line).
0.10
3° 5° 7° 9° 10° 12° 14°
Rate (sp/s
)
S t i m u l u s s i z e
0.00 360 0 Time (ms ) 80 0 -80 Time (ms ) 80 0.3 0.0 0 -80 Coincidence s 12°
T i m e 3 0 0 m s cgl03d1207 4-4
Notice, however, that although oscillation strength was much diminished for the
masked stimuli, they did not vanish completely. In the traces of Figure 15 one sees a
clear trend for an increase in oscillation amplitude (without reaching a plateau) as a
function of the size of the peripheral part of the stimulus (the center part remains
unchanged). A possible confounding factor could be the stray-light of the CRT monitor.
It would be interesting to use different types o display (e.g.., fast LCD monitor) to
dispel these interferences. Results for annular masked stimuli are given in Table 2.
4 . 3 . PE R C O L AT I O N S T I M U L U S
To further study whether oscillation dynamics are related to stimulus
connectedness (Neuenschwander and Singer, 1996) we used the percolation stimulus
proposed by Stephens et al. (2006) (see Methods). The sliding window analysis
presented in Figure 16 shows an example of how oscillatory behavior changes as a
function of adding pixels in the image. Although one can see a sharp appearance of an Figure 16. Percolation threshold does not lead to a phase transition in the oscillatory responses. (Left panels) Sliding window analysis show that oscillatory responses appear much later for the percolation stimulus (see Methods) as compared to the linear ramp circular stimulus (linear change in luminance, symbolized by a ramp over a circle). Arrows indicate the expected time of percolation threshold (at 60 %
of elapsed time, see Stephens et al., 2006). Notice that in this example a transition in oscillatory behavior
happens just before the point in time of percolation threshold (Right plot). Population data for oscillation
onset from the start of the stimulus. Although oscillatory responses took longer to appear for the percolation stimulus as compared to the linear ramp stimulus, oscillation onsets were clearly below the expected time of percolation threshold (depicted as a dashed line in the plot).
1800
Time (
m
s
)
S t i m u l u s p ro t o c o l
0
Percolation Linear
O S C I L L AT I O N O N S E T
Time ( m s ) 0 -80 80 0.25 0.0 0 -80 Coinciden c e s
T i m e 5 0 0 m s
cgl02e0201 1-1
cgl02e0202 1-1
80
15°