2009, Vol. 5(1), p. 35‐39.
On
the
perils
of
categorizing
responses
Jim Lemon
National Drug and Alcohol Research Centre, Australia
The
assumptions
underlying
the
categorization
of
numeric
measurements
are
examined
and
it
is
concluded
that
some
numeric
data
that
are
measured
by
categories
might
better
be
obtained
by
direct
estimates.
Statistical
tests
are
performed
on
artificially
generated
data
of
normal,
triangular
and
empirically
measured
distributions,
and
on
various
categorizations
of
these
data.
It
is
shown
that
categorization
can
markedly
affect
the
outcome
of
significance
tests,
in
some
cases
leading
to
both
Type
I
and
Type
II
errors.
When
high
local
densities
of
values
are
numerically
separated
by
categorization,
test
statistics
can
be
substantially
inflated
from
the
uncategorized
values.
It
is
recommended
that
response
categorization
be
subjected
to
the
same
critical
analysis
as
data
transformation
techniques
like
arbitrary
dichotomization.
Recording responses in categories is ubiquitous in the social sciences. Many variables of interest fallinto natural categories such as sex, or like attitudes are difficult to measure precisely. Some measuresmay be more plausibly related to others given suitable categorization. For example, the rough divisionsof having completed, primary, secondary and tertiary education seem more sensibly related to type of employment than whether a person has completed eight or nine years of school.
A common practice in many methods of data collection is to request a response endorsing one of a number of categories rather than an open ended numerical estimate. Thus a respondent is asked whether their age or earnings fall into particular ranges instead of requesting the actual age or estimate of earnings. Reasons commonly given for this are that respondents are willing to disclose personal information to the extent that it cannot be used to identify them and that endorsing a category does not unfavorably characterize the respondent. The first carries no weight if the respondent has already identified him‐ or herself, and the second is far more often asserted than tested. There are
Jim Lemon, Research Fellow, National Drug and Alcohol Research Centre, Sydney NSW 2052, Australia; [email protected]
many examples of researchers creating a large number of categories to increase the precision of their data, and it is debatable whether a respondent would be more reluctant to admit that they were 62 years old than that they were in the 60 to 64 age group. Requesting the respondent to select a category may result in a higher response rate than asking for a numerical estimate (Featherston & Ramirez, 1999). However, this is typically observed when the exact value requested is not immediately available to the respondent. It is plausible for a measure like age that the subject simply recalls his or her age. This appears to conform to an availability heuristic (Kahneman, 2003). Where a numerical quantity is immediately available to the respondent, as with age, there should be no impediment to supplying it. However, as a quantity becomes less available, whether through uncertainty or lack of knowledge, selecting a category may be more likely to produce a response when the respondent does not wish to commit errors.
response range (0 to 100) was the same as that used to grade the students, and thus familiar to them in that context. Similarly, Dawson (2003) proposed that one way to avoid the lack of precision of response categories in assessing alcohol consumption was to ask for a direct numerical estimate for which the respondent could select the preferred time interval (i.e. day, week, month, year). This also reflects the proposition that a calculated quantity will be less available than one directly perceived or recalled.
The effect of changing category boundaries upon the means is well known in the medical literature and has been called the “Will Rogers Phenomenon” (Feinstein, Sosin & Wells, 1985). The reference is to a joke by the American humorist that “When the Okies went to California, it raised the average IQ in both states”. The effect can easily be demonstrated by dichotomizing a set of monotonically increasing numbers, calculating the subset means, moving the point of dichotomy up or down, and recalculating the means. If the dichotomy is moved up, both means will increase, if down, both will decrease. It has been shown that this can markedly affect indices such as survival times by moving patients close to a category boundary into different diagnostic categories (Albertson et al., 2005). It is the influence of categorizing data upon statistical analyses of that data that is the focus of the present paper. Variability in Pearsonʹs index of correlation (Bollen & Barb, 1981), multivariate analyses (Doreian, 1972), the reliability of attitude measurement (Alwin, 1992) and regression coefficients (Wainer, Gessaroli & Verdi, 2006) with categorization have previously received notice in the literature.
Consider hypothetical variables that may be recorded as either numerical estimates or categories. Will the specification of categories affect subsequent analyses that are based upon categorized rather than directly recorded data?
All data sampling and analyses were performed using the R statistical language (R Development Core Team, 2006). Source code for reproducing all of the analyses described is available.
All categorizations were performed with a function that assigned numeric values to categories defined by a vector of category breakpoints. Assignment was left‐closed, that is, values that were equal to a lower category breakpoint were included, while values equal to the upper breakpoint were excluded. Two sets of breakpoints were used, corresponding to two different categorizations of drinking quantity used in the literature:
CAT1 = 0, 2, 4, 6, 10, 15; CAT2 = 0, 3, 6, 9, 12, 15.
The effect of moving category boundaries on a two sample
location test of normally distributed data
Artificial data were generated to form two samples of 100 values sampled from normal distributions with means 7 and 7.5 and standard deviations of 2 (N200). A few values were manually adjusted so that the result of a t‐test was just at the conventional level of significance (t[195] = ‐1.97, p = 0.05001). Both groups were still normally distributed when the Shapiro‐Francia test was applied (W = 0.99, p = 0.9 and W = 0.99, p = 0.36 respectively). This set was intended to resemble data from a study of group differences on a continuous variable with a moderate sample size.
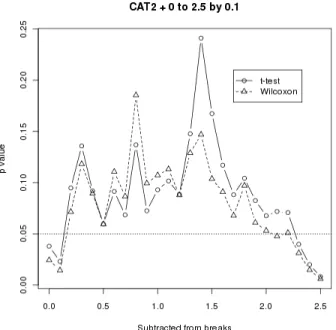
Hypothesis testing is a central feature of the scientific literature. Whether the null hypothesis is accepted or rejected, the conclusions and recommendations of a paper are expected to be consistent with the outcomes of such tests. In order to test the effect of categorization upon a continuous variable measured in two pre‐defined groups, the N200 dataset was repeatedly categorized using CAT1 and CAT2. Twenty six trials were run with 0.1 added to each category boundary between trials. The probabilities of two‐ sample t statistics of the difference between group means on the scores categorized with CAT1 varied over 10‐fold from a minimum of 0.021 to a maximum of 0.53. This was not the effect of using a parametric test on data that violated the distributional assumptions, as the probabilities of Wilcoxon signed rank tests also varied from a minimum of 0.013 to 0.4. A similar variation was evident using CAT2, for which the t probabilities ranged from 0.008 to 0.24 and those of the Wilcoxon statistic from 0.006 to 0.19 (Figures 1 and 2). It is clear that the location of category boundaries has a strong effect on the outcome of significance testing. In this case, the CAT1 intervals increase with the values observed, affording more precision in the lower range. The CAT2 intervals are constant.
The effect of different category boundaries on tests of
treatment effects over time
Figure 1 ‐ Effect of moving CAT1 breaks Figure 2 : Effect of moving CAT2 breaks
C100 samples were drawn to ensure that the effect of different categorizations on analysis of a simulated treatment effect was not due to a particular sample. For each simulation, the R200 sample comprised the pre‐treatment scores and the sum of the R200 and the T100 and C100 samples comprised the post‐treatment scores. The significance of the treatment effect was tested as the interaction of treatment level (T vs C) with occasion of measurement (pre vs post).
Applying a simple univariate repeated measures ANOVA to the first series of uncategorized data, the treatment effect was just short of significance (F[1,395] = 3.73, p = 0.054). When this sample was categorized using CAT2, no effect was apparent (F[1,395] = 0.004, p = 0.95). However, merely by recategorizing the raw data using the breakpoints CAT1, a significant treatment effect was obtained (F[1,395] = 5.25, p = 0.02). To demonstrate that this was not an artifact of sampling, the 1000 T100 and C100 samples were combined with the R200 sample as described above. Three hundred and twenty of the uncategorized samples drawn achieved a significant group effect. Using CAT2, 127 samples showed a significant group effect, fewer than the number found with the uncategorized values (χ2 =
106.2, p < 0.0001). With CAT1, 546 samples achieved statistical significance, a significantly larger number than with the uncategorized values (χ2 = 103.1, p < 0.0001).
Clearly the category intervals as well as their location can have a profound effect on the outcome of significance tests.
Using the triangular distribution to illustrate the effect of
categorization
Finally, samples of integer values were drawn from triangular distributions to elucidate the mechanisms by which categorization might affect subsequent analysis. In a triangular distribution, the density function decreases linearly from the modal value to zero at the lower and upper limits. The conventional notation is:
ƒ(x|a,b,c),
where a is the lower limit, b is the upper limit and c is the mode.
The sample generating function calculated the exact density at each integer value between the limits, but this was rounded to produce the number of values in the output. Integer values were used for comparability with the R200 sample and to maintain continuity with the hypothetical analyses of discrete distributions. The three parameters were Table 1. Probability vectors for drawing the R200, T100 and C100 samples
Probability of drawing value
Value 1 2 3 4 5 6 7 8 9 10 11 12 13 14
R200 .050 .210 .27 .178 .120 .060 .039 .023 .015 .0077 .0062 .0046 .0039 .0031
Value ‐3 ‐2 ‐1 0 1 2
T100 .15 .20 .30 .20 .10 .05
C100 .10 .25 .30 .25 .10
chosen to simulate a measure with an upper and lower bound for which the modal values of the two samples would be separated into two categories by one set of boundaries (CAT1), but not the other (CAT2). The two samples used were;
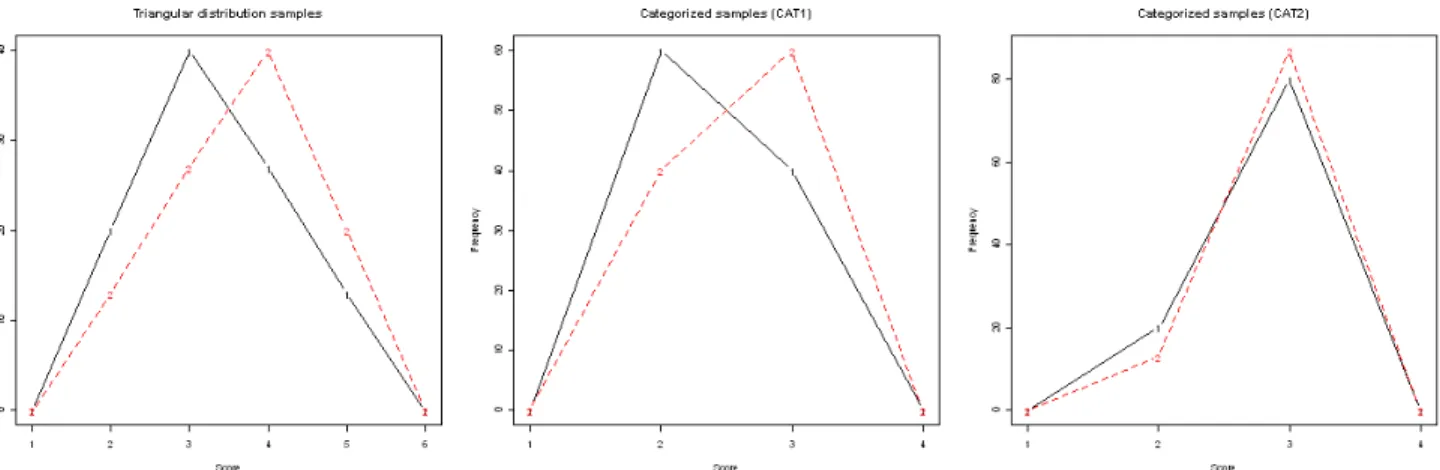
TR1 (a = 1, b = 6, c = 3 with a modal frequency of 40, n = 100) TR2 (a = 1, b = 6, c = 4 with a modal frequency of 40, n = 100)
To illustrate the process by which data categorization affects subsequent analyses, the TR1 and TR2 samples were entered into a one way ANOVA using a dummy grouping variable as a predictor. The uncategorized values showed a significant difference between the mean values of T1 and T2 (F[1,198] = 6.5, p = 0.01). As expected, categorizing the samples using the CAT1 breakpoints produced a result of even greater significance (F[1,198] = 8.25, p = 0.005), while the CAT2 breakpoints produced the opposite effect (F[1,198] = 1.8, p = 0.2). Examining the ANOVA tables shows that while the within group sum of squares in the CAT1 analysis was almost twice that of the CAT2 analysis, the effect (between group) sum of squares for the CAT1 analysis was over eight times that of the CAT2 analysis. By placing the modal values of the original sample into different categories, a test statistic larger than that obtained with the uncategorized values emerged (Figure 2). To ensure that this was not due to an inappropriate application of a parametric testing procedure, the Wilcoxon signed rank procedure was also run for uncategorized scores (W = 3890, p = 0.009), CAT1 (W = 4005, p = 0.005) and CAT2 (W = 4650, p = 0.2).
Discussion
It is clear that the position of category boundaries affects tests of sample location parameters. This may explain why some apparently strong results cannot be replicated with samples that differ in their distributions. If a marginally significant difference between two groups is tested with the
same category intervals, but different boundaries, the outcome can range from a level of significance that would be gladly accepted by most researchers (p = 0.002) to the conclusion that no difference was present (p > 0.1).
In the analysis of two different methods of categorization on data simulating the effect of a therapeutic intervention, an apparently minor change in the category boundaries changed the treatment effect from non‐significant to one that would be accepted as indicating a successful intervention. Repeating the simulation a large number of times showed that the CAT1 categorization led to more statistically significant group effects being observed in the simulated data. However, it is trivial to draw alternative samples that would reverse the effect of the two categorizations. It is clear that even minor changes to the category ranges can have a substantial effect on hypothesis tests carried out on the categorized data.
Both the location and the spacing of category boundaries can markedly affect the distribution of categorized scores. This is largely due to the relationship of those boundaries to the location and dispersion of the uncategorized data. When using the two overlapping triangular distribution samples TR1 and TR2, categorizing with a boundary that separated the modal values of the samples increased the test statistic markedly, while not doing so produced a large effect in the opposite direction. When categorization has the effect of increasing the numerical distance between groups relative to the overall dispersion of scores, an increase in the significance of location tests results.
Two effects of the categorization of numerical data have been examined, and the results obtained are relevant to any investigation that uses this procedure. The most common effect of categorization is that noted by previous work, a small reduction in the magnitude of the test statistic. However, this is not the most serious problem that may arise. Both the location and spacing of categories can have a substantial effect on the outcome of significance tests.
Wainer, Gessaroli and Verdi (2006) have demonstrated essentially the same results in regression analysis and even provided an algorithm to maximize an arbitrarily defined effect. When arbitrarily dichotomizing response scores, investigators are often asked to justify their choice of breakpoint when submitting work for publication. The effect of category definition is not as well known, yet it can have similar effects.
References
Albertsen, P.C., Hanley, J.A., Barrows, G.H., Penson, D.F., Kowalczyk, P.D.H., Sanders, M.M. & Fine, J. (2005). Prostate Cancer and the Will Rogers Phenomenon. Journal of the National Cancer Institute, 97(17), 1248‐1253. Alwin, D.F. (1992). Information transmission in the survey
interview: Number of response categories and the reliability of attitude measurement. pp83‐118 in P.V. Marsden (Ed.) Sociological Methodology (Vol. 22). Oxford: Blackwell.
Bollen, K.A. & Barb, K. H. (1981). Pearsonʹs R and coarsely categorized measures. American Sociological Review. 46, 232‐239.
Dawson, D.A. (2003). Methodological issues in measuring alcohol use. Alcohol Research and Health, 27(1), 18‐29. Doreian, P. (1972). Multivariate analysis and categorized
data. Quality and Quantity: European Journal of Methodology, 7(2), 253‐272.
Featherston, F. & Ramirez, C. (1999). Item Nonresponse in Mail Surveys of Establishments. Paper presented at the 1999 International Conference on Survey Nonresponse, Portland, Oregon, USA.
Feinstein A.R., Sosin D.M. & Wells C.K. (1985). The Will Rogers phenomenon: stage migration and new diagnostic techniques as a source of misleading statistics for survival in cancer. New England Journal of Medicine. 312(25), 1604–1608.
Kahneman, D. (2003) A perspective on judgment and choice: Mapping bounded rationality. American Psychologist, 58(9): 697‐720.
Pajares, F., Hartley, J. & Valiante, G. (2001). Response format in writing self‐efficacy assessment: Greater discrimination increases prediction. Measurement and Evaluation in Counseling and Development, 33(4), 214‐221. R Development Core Team (2006). R: A language and
environment for statistical computing. R Foundation for Statistical Computing, Vienna, Austria. ISBN 3‐900051‐ 07‐0, URL http://www.Rproject. org.
Wainer, H., Gessaroli, M. & Verdi, M. (2006) Finding what is not there through the unfortunate binning of results: the Mendel effect. Chance, 19(1): 49‐52.
Manuscript received April 2nd, 2008
Manuscript accepted October 13th, 2008