Nerve Sheath Tumors in Neurofibromatosis
Type 1: Assessment of Whole-Body Metabolic
Tumor Burden Using F-18-FDG PET/CT
Johannes Salamon1*, László Papp2, Zoltán Tóth3, Azien Laqmani1, Ivayla Apostolova4, Gerhard Adam1, Victor F. Mautner5, Thorsten Derlin6
1Department of Diagnostic and Interventional Radiology, University Medical Center Hamburg-Eppendorf, Hamburg, Germany,2Mediso Medical Imaging Systems, Budapest, Hungary,3Scanomed Ltd., Budapest, Hungary,4Department of Radiology and Nuclear Medicine, Otto-von-Guericke University, Magdeburg, Germany,5Department of Neurology, University Medical Center Hamburg-Eppendorf, Hamburg, Germany,
6Department of Nuclear Medicine, Hannover Medical School, Hannover, Germany
*j.salamon@uke.de
Abstract
Purpose
To determine the metabolically active whole-body tumor volume (WB-MTV) on F-18-fluoro-deoxyglucose positron emission tomography/computed tomography (F-18-FDG PET/CT) in individuals with neurofibromatosis type 1 (NF1) using a three-dimensional (3D) segmen-tation and computerized volumetry technique, and to compare PET WB-MTV between patients with benign and malignant peripheral nerve sheath tumors (PNSTs).
Patients and Methods
Thirty-six NF1 patients (18 patients with malignant PNSTs and 18 age- and sex-matched controls with benign PNSTs) were examined by F-18-FDG PET/CT. WB-MTV, whole-body total lesion glycolysis (WB-TLG) and a set of semi-quantitative imaging-based parameters were analyzed both on a per-patient and a per-lesion basis.
Results
On a per-lesion basis, malignant PNSTs demonstrated both a significantly higher MTV and TLG than benign PNSTs (p<0.0001). On a per-patient basis, WB-MTV and WB-TLG were significantly higher in patients with malignant PNSTs compared to patients with benign PNSTs (p<0.001). ROC analysis showed that MTV and TLG could be used to differentiate between benign and malignant tumors.
Conclusions
WB-MTV and WB-TLG may identify malignant change and may have the potential to pro-vide a basis for investigating molecular biomarkers that correlate with metabolically active disease manifestations. Further evaluation will determine the potential clinical impact of these PET-based parameters in NF1.
OPEN ACCESS
Citation:Salamon J, Papp L, Tóth Z, Laqmani A, Apostolova I, Adam G, et al. (2015) Nerve Sheath Tumors in Neurofibromatosis Type 1: Assessment of Whole-Body Metabolic Tumor Burden Using F-18-FDG PET/CT. PLoS ONE 10(12): e0143305. doi:10.1371/journal.pone.0143305
Editor:Masaru Katoh, National Cancer Center, JAPAN
Received:July 1, 2015
Accepted:November 2, 2015
Published:December 1, 2015
Copyright:© 2015 Salamon et al. This is an open access article distributed under the terms of the
Creative Commons Attribution License, which permits unrestricted use, distribution, and reproduction in any medium, provided the original author and source are credited.
Data Availability Statement:All relevant data are within the paper.
Introduction
Neurofibromatosis type 1 (NF1) is a rare hereditary tumor predisposition syndrome caused by a germline mutation in the NF1 tumor suppressor gene [1]. Individuals with NF1 may develop a variety of benign and malignant tumors, the most frequent being peripheral nerve sheath tumors (PNSTs) [2]. PNSTs are neoplasms arising from Schwann cells [3]. So called plexiform neurofibromas may undergo transformation into malignant peripheral nerve sheath tumors (MPNSTs) [4]. Patients with NF1 have a lifetime risk of up to 10% for developing MPNSTs [5,6]. Prognosis is usually poor in these rapidly metastasizing neoplasms, underlining the need for early detection of malignant transformation and identification of risk factors.
F-18-fluorodeoxyglucose (F-18-FDG) positron emission tomography/computed tomogra-phy (PET/CT) has become an established and well studied imaging method for the detection of MPNSTs in individuals with NF1 by measuring consumption of radioactively labelled glucose [7–12]. It provides unique insights into the biology of nerve sheath tumors. MPNSTs are highly aggressive neoplasms with marked metabolic activity [9–11]. However, benign plexiform neu-rofibromas may also exhibit increased metabolic activity in a substantial number of NF1 indi-viduals [7,8]. Not all patients with plexiform neurofibromas will demonstrate metabolically active tumors, and the number (and therefore the volume) of tumors with F-18-FDG uptake differs considerably from case to case [8].
Recently, newer F-18-FDG PET/CT-based volumetric parameters such as metabolic tumor volume (MTV) and total lesion glycolysis (TLG) have gained increasing interest in a variety of cancers [12–18].
The internal tumor burden in individuals with NF1 has been studied using T2-weighted whole-body MRI segmentation techniques [19,20]. High internal tumor load on MRI has been found to be associated with a higher risk of developing MPNSTs in previous studies [21], but not with genetic alterations or serum markers [1,22]. It is an inherent limitation of MRI that it cannot discriminate between tumors which are metabolically active and those who are not [10]. Compared to MRI, PET has the advantage of precise quantitation of tumor metabolic activity in terms of standardized uptake values (SUVs) which can easily be used as cut-off val-ues for differentiating between malignant and benign lesions, e.g. a cut-off>3.5 usually sug-gests malignancy [8]. Another advantage of PET/CT over MRI is that an unremarkable investigation excludes malignant change in neurofibromas with a negative predictive value of 100% [8]. There are no parameters on MRI to reliably exclude malignant change [10]. In addi-tion, PET/CT provides a highly sensitive whole-body staging, especially for patients with typi-cal osseous and pulmonary metastases. Differentiation of metastases from benign
neurofibromas is challenging if not impossible on MRI. Concerning whole-body imaging, assessment of not just the mere anatomical tumor load but of the metabolically active portion of tumors may provide more useful information concerning NF1 biology, the risk of malig-nancy or correlation with serum markers.
Therefore, the aim of this study was to determine the metabolically active whole-body tumor burden on F-18-FDG PET/CT in individuals with NF1 using a three-dimensional (3D) segmen-tation and computerized volumetry technique, and to compare PET WB-MTV, WB-TLG and other imaging-based parameters between patients with benign and malignant PNSTs.
Patients and Methods
Patients
The study group consisted of 36 age- and sex-matched patients (20 men; 16 women; age, 36.6 ± 12.3 years; range 16.5 to 68.7 years) with NF1 and benign (n= 18) or malignant (n= 18)
F-18-FDG PET/CT in NF1
PLOS ONE | DOI:10.1371/journal.pone.0143305 December 1, 2015 2 / 14
Mediso Medical Imaging Systems or Scanomed Ltd.. The named commercial companies did not play a role in the study design, data collection and analysis, decision to publish, or preparation of the manuscript and did only provide financial support in the form of authors' salaries (LP and ZT). They provided support in the form of making available the software package used.
PNSTs who had been referred for an F-18-FDG PET/CT scan for exclusion of MPNSTs between December 2006 and May 2014. Subjects were selected according to the following inclusion and exclusion criteria:
Inclusion:
(I1) Fulfillment of the National Institutes of Health (NIH) diagnostic criteria for NF1 [23].
(I2) Symptomatic lesions or lesions with change in size or texture
(I3) Histopathology and/or clinical/radiological follow-up>12 months available in patients with focally increased tracer uptake
Exclusion:
(E1) Inability or unwillingness to provide informed consent for the retrospective analysis of the data.
(E2) Patients with atypical NF
(E3) Patients with metastases of MPNST
The study protocol has been approved by the local Clinical Institutional Review Board (Ethic committee of the medical chamber of Hamburg) and complied with the Declaration of Helsinki. All subjects had given written informed consent for the retrospective evaluation of their data. For minors / children we obtained written informed consent from their legal guardians.
PET/CT Acquisition and Image Reconstruction
F-18-FDG PET/CT images were obtained using a Gemini GXL10 scanner (Philips Medical Sys-tems, Best, The Netherlands). Patients fasted for at least 6 h before injection of 350 MBq of F-18-FDG. During the uptake period of about 60 min, patients received oral contrast (20 ml Gas-trolux CT1in 1 l water; Sanochemia Diagnostics, Neuss, Germany). Imaging started with a low-dose CT of the whole body (120 kV, 80 mA, transaxial FOV 600 mm, no gap, collimation 10 x 1.5 mm, pitch 1.1, rotation time 0.5 s, slice thickness 5 mm, matrix 512 x 512). Then, a total-body emission scan was performed in the caudocranial direction with 90 s per bed posi-tion at head and thorax, and 60 s at the legs. Transversal PET slices were reconstructed into a 144 x 144 matrix using the iterative 3DLOR reconstruction algorithm of the system software with standard parameter settings. Spatial resolution in the reconstructed PET images was about 8 mm full-width-at-half-maximum. Transaxial, sagittal, and coronal images and fused images were displayed for review.
Image Analysis
Image analyses were undertaken on a workstation with a research software package (Inter-View™FUSION; Mediso Medical Imaging Systems Ltd., Budapest, Hungary).
PET image analysis. PET images were visually evaluated for the presence of focal
radio-tracer uptake above background corresponding to space-occupying lesions on CT images. We herein define all lesions with increased glucose metabolism and therefore significant F-18-FDG uptake (SUVmax2.0) as metabolically active, i.e. PET positive (PET+). The number of PET
+ PNSTs was recorded. Then, automated segmentation of metabolically active tumors in PET + patients was performed using a stopping rule of 2.0, 2.5 and 3.5 [24]. These established cut-off values were chosen to assess likely malignant lesions (SUVmax3.5), additional equivocal
(SUVmax2.0). The voxels of normal organs such as heart, liver, kidneys, ureters, and bladder,
as well as false-positive lesions such as inflammatory lesions were manually excluded. Semi-quantitative analysis was performed by obtaining the mean and maximum standardized uptake values (SUVmean, SUVmax) of each lesion. The standardized uptake value (SUV) was calculated
using the following formula: tissue concentration (MBq/g)/injected dose (MBq)/body weight (g). The metabolic tumor volume (MTV) of each lesion was measured and added to the whole-body MTV (WB-MTV). The total lesion glycolysis (TLG) was calculated as (MTV) × (mean SUV) [14]. Whole-body total lesion glycolysis (WB-TLG) was calculated by summing up the individual TLG of each lesion.
CT image analysis. The largest diameter of each lesion was determined on the
corre-sponding coregistered PET/CT images.
Reference standard and histopathological evaluation
All patients with PNSTs with increased tracer uptake underwent histopathological evaluation [25] and/or clinical and radiological follow-up>12 months.
Statistical analysis
Continuous variables are expressed as mean ± SD. Categoric variables are presented with abso-lute and relative frequencies. Analyses were performed both on a per-lesion and a per-patient basis. MTV, TLG and a set of other imaging-derived parameters (maximum SUVmean,
maxi-mum SUVmax, maximum diameter) were recorded for all benign and malignant lesions, and
compared. WB-MTV, WB-TLG and other imaging-derived parameters were also compared between patient groups with benign and malignant PNSTs. For between-group comparisons of continuous data,Pvalues were calculated from Mann-Whitney U rank sum tests. Receiver operating characteristic (ROC) analysis was performed to define the optimum cut-off value for SUVmax, MTV and TLG. Statistical significance was established forPvalues of less than 0.05.
Statistical analysis was performed using GraphPad Prism 5.01for Windows (GraphPad Soft-ware In., La Jolla, Calif, USA).
Results
Evaluation of F-18-FDG PET/CT scans was feasible in all patients. The MPNST group con-sisted of 18 patients (10 men, 8 women; mean age, 35.8 ± 12.9 years; range, 17.1–68.7 years). The control group matched for gender and age consisted of 18 patients (10 men, 8 women; mean age, 37.4 ± 12.1 years; range, 16.5–63.2 years).
19 MPNSTs were confirmed by histopathological evaluation in 18 patients. 14 other tumors were found to be benign by histology. All other PET+ lesions were classified as benign after a mean follow-up of 54 ± 23 months (range, 13–98).
Lesion-based analysis
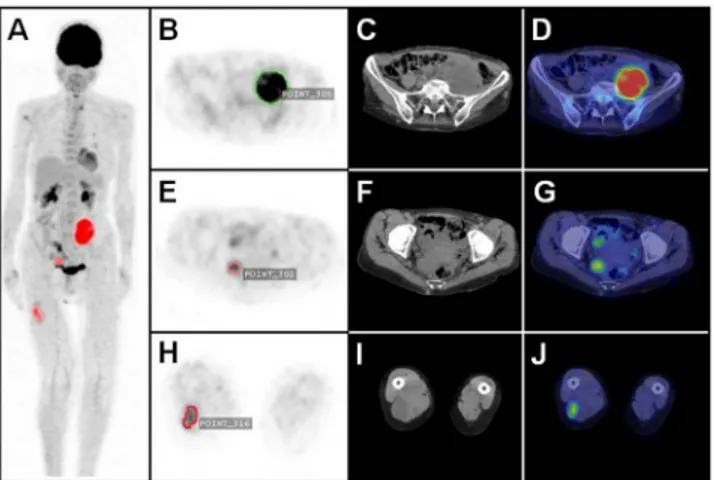
An example of a volumetric analysis in a NF 1 patient with PNSTs is shown inFig 1. 74 meta-bolically active lesions were found in 34 (94.4%) patients at a SUVmaxthreshold of 2.0, and
therefore considered as PET+. The mean SUVmaxof PET+ lesions was 5.8 ± 3.5 (range, 2.2–
16). The average SUVmeanof these lesions was 3.1 ± 1.0 (range, 1.7–6.7). The mean size of PET
+ tumors was 62.1 ± 49.2 mm (range, 11–292 mm).
Detailed data on metabolic tumor volume and total lesion glycolysis at different SUVmax
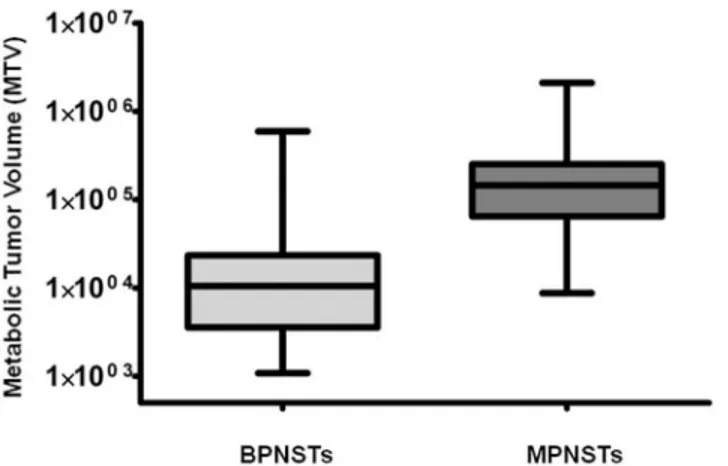
thresholds are shown inTable 1. Box plots demonstrating the significant difference between MTV and TLG of MPNSTs versus BPNSTs are shown in Figs2and3.
F-18-FDG PET/CT in NF1
Compared to BPNSTs, MTV and TLG of MPNSTs were significantly higher at SUVmax
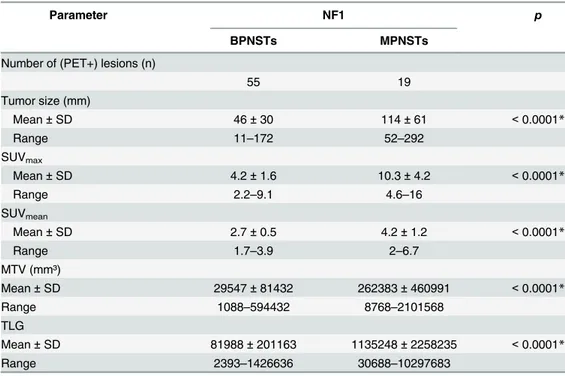
thresholds of 2.0, 2.5 and 3.5, (p<0.0001). Compared to BPNSTs, MPNSTs also demonstrated a significantly higher SUVmax, SUVmean, and tumor diameter (p<0.0001 in all cases).
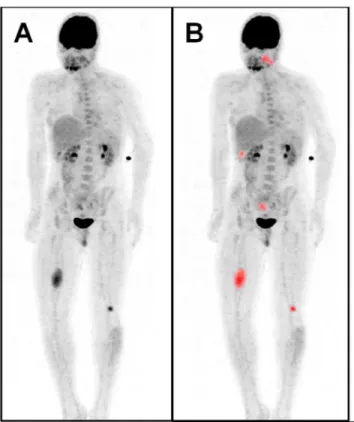
Exam-ples of a solitary MPNST and a solitary BPNST are shown inFig 4.
Detailed data (per-lesion analysis) on imaging-derived parameters of malignant and benign PNSTs are shown inTable 2.
Neither MTV nor TLG were significantly correlated with gender or age at all investigated SUVmaxthresholds on a per-lesion basis (p>0.05 in all cases).
Patient-based analysis
34 (94.4%) of 36 NF1 patients demonstrated metabolically active PNSTs. The mean WB-MTV per patient was 212040 ± 282687 mm3(range, 2880–2107008 mm3). Compared to patients with only BPNSTs, the WB-MTV was significantly higher in patients with MPNSTs at all SUVmax
thresh-olds (p<0.001 in all cases). The mean WB-TLG per patient was 814423 ± 1801860 mm3(range, 7488–10315091 mm3). Patients with MPNSTs had a significantly higher WB-TLG at all SUVmax
thresholds (p<0.001). Neither WB-MTV nor WB-TLG were significantly correlated with gender or age at all investigated SUVmaxthresholds on a per-patient basis (p>0.05 in all cases).
Detailed data (per-patient analysis) on WB-MTV and WB-TLG at different SUVmax
thresh-olds are shown inTable 3. Data (per-patient analysis) on other imaging-derived parameters comparing the patient group with only BPNSTs and the patient group diagnosed with malig-nant and benign PNSTs are shown inTable 4.Fig 5shows a MPNST patient with multiple met-abolically active tumors.
ROC analysis of MTV and TLG for identification of malignancy
Per-patient basis. Both a WB-MTV cut-off value and a WB-TLG cut-off value could
dif-ferentiate between patients with MPNSTs and those with only BNSTs at all SUVmaxthresholds
(p<0.001 in all cases).
Fig 1. Automated 3D-segmentation and volumetric assessment of nerve sheath tumors.Maximum intensity projection PET image (A) with automatically delineated metabolically active tumors (red). Axial PET image (B) with volumetric ROI (green) of a MPNST (SUVmax/ MTV / TLG: 11.2 / 182592 / 894700) in the left
pelvis; corresponding CT (C) and fused PET/CT image (D). Axial PET image (E) with volumetric ROI (light red) of a plexiform neurofibroma (PNF) (SUVmax/ MTV / TLG: 4.7 / 14848 / 41574) close to the rectum;
corresponding CT (F) and PET/CT image (G). Axial PET image (H) with volumetric ROI (dark red) of a BPNST (SUVmax/ MTV / TLG: 3.7 / 15872 / 41267) in the right thigh; corresponding CT (I) and PET/CT image
(J).
Table 1. Per-lesion analysis of metabolic tumor volume and total lesion glycolysis of benign vs. malignant PNSTs at different SUVmaxthresholds.
SUVmax>2.0 p SUVmax>2.5 p SUVmax>3.5 p
BPNSTs MPNSTs BPNSTs MPNSTs BPNSTs MPNSTs
MTV (mm³)
Mean±SD 29547±81432 262383±460991 <0.0001* 12957±14562 207581±484072 <0.0001* 7626±8174 144368±287296 <0.0001*
Range 1088–594432 8768–2101568 1024–56576 8768–1758500 1024–34560 2304–1304704
TLG
Mean±SD 81988±201163 1135248±2258235 <0.0001* 44679±54981 954137±2105349 <0.0001* 33839±41122 873232±1788102 <0.0001*
Range 2393–1426636 30688–10297683 2764–243267 31564–9495900 3891–179712 8985–8089164
MTV- metabolic tumor volume; TLG—total lesion glycolysis; BPNST—benign peripheral nerve sheath tumors; MPNST—malignant peripheral nerve sheath tumors; SD—standard
deviation;
*—statistically significant
doi:10.1371/journal.pone.0143305.t001
F-18-FDG
PET/CT
in
NF1
PLOS
ONE
|DOI:10.137
1/journal.p
one.0143305
December
1,
2015
6/1
Fig 2. Comparison between MTV of BPNSTs versus MPNSTs on a per-lesion basis (SUVmaxthreshold
2.0).MTV is significantly higher in MPNSTs (p<0.0001).
doi:10.1371/journal.pone.0143305.g002
Fig 3. Comparison between TLG of BPNSTs and MPNSTs on a per-lesion basis (SUVmaxthreshold
2.0).TLG is significantly higher in MPNSTs (p<0.0001). doi:10.1371/journal.pone.0143305.g003
Fig 4. Solitary BPNST versus solitary MPNST.Maximum intensity projection PET image (A) of a patient with a solitary BPNST (SUVmax/ MTV / TLG: 2.6 / 2885 / 6488) in the left thigh with automatically delineated
metabolically active tumors (red) (B), corresponding axial PET (C), CT (D) and fused PET/CT image (E). Maximum intensity projection PET image of a patient with a solitary MPNST (SUVmax/ MTV / TLG: 7.1 /
171328 / 633913) in the right pelvis (F) with automatically delineated metabolically active tumors (red) (G) with corresponding PET (H), CT (I) and PET/CT image (J).
Per-lesion basis. Both a MTV cut-off value and a TLG cut-off value could differentiate between patients with MPNSTs and those with only BNSTs at all SUVmaxthresholds
(p<0.0001 in all cases). The optimum cut-off-value for SUVmaxwas>5.5 (AUC 0.96, p<0.0001), yielding a sensitivity of 95% and a specificity of 85% for differentiation of malig-nant and benign lesions. The optimum cut-off-value for the TTL ratio was>2.6 (AUC 0.98, p<0.0001), resulting in a sensitivity of 100% and a specificity of 87%.
Results of the ROC analysis are summarized inTable 5.
Discussion
In this study, we assessed the metabolically active whole-body tumor burden in NF1 patients using F-18-FDG PET/CT. In a cohort matched for sex and age, we could introduce WB-MTV and WB-TLG as novel parameters for biological characterization of NF1 patients. Most impor-tantly, we could demonstrate that these parameters are significantly different between malig-nant and benign lesions (p<0.0001), and that MPNST patients have significantly different whole-body MTV and TLG compared to patients with only benign tumors (p<0.001).
F-18-FDG PET/CT has become an established and powerful tool for detection of malignant peripheral nerve sheath tumors in patients with NF1 [7,8,11]. In the past, various F-18-FDG PET/CT imaging parameters have been explored in order to further characterize PNSTs and to facilitate sensitive detection of MPNSTs. Among all PET derived parameters, SUVmax
repre-sents the most commonly used parameter for detecting MPNSTs [26]. Recommended cut-off values range from 3.5 to 6.1 [26,27], but a SUVmaxof 3.5 is the most widely used cut-off value
[7,8,26]. In this study, the optimum SUVmaxcut-off value would have been4.5, yielding
Table 2. Data on imaging-derived parameters of benign and malignant PNSTs at a SUVmaxthreshold
of 2.0.
Parameter NF1 p
BPNSTs MPNSTs
Number of (PET+) lesions (n)
55 19
Tumor size (mm)
Mean±SD 46±30 114±61 <0.0001*
Range 11–172 52–292
SUVmax
Mean±SD 4.2±1.6 10.3±4.2 <0.0001*
Range 2.2–9.1 4.6–16
SUVmean
Mean±SD 2.7±0.5 4.2±1.2 <0.0001*
Range 1.7–3.9 2–6.7
MTV (mm³)
Mean±SD 29547±81432 262383±460991 <0.0001*
Range 1088–594432 8768–2101568
TLG
Mean±SD 81988±201163 1135248±2258235 <0.0001*
Range 2393–1426636 30688–10297683
MTV- metabolic tumor volume; TLG—total lesion glycolysis; BPNST—benign peripheral nerve sheath tumors; MPNST—malignant peripheral nerve sheath tumors; SD—standard deviation;
*—statistically significant. doi:10.1371/journal.pone.0143305.t002
F-18-FDG PET/CT in NF1
SUVmax>2.0 p SUVmax>2.5 p SUVmax>3.5 p
BPNST Group MPNST Group BPNST Group MPNST Group BPNST Group MPNST Group
MTV (mm³)
Mean±SD 933348±182184 309786±476008 <0.0001* 26710±30288 229857±401815 <0.0001* 14896±12901 165380±299704 0.0003*
Range 2880–717056 83456–2107008 1024–104256 21696–1761444 2432–34624 11712–1306560
TLG
Mean±SD 241878±446054 1259842±2299646 0.0002* 91295±106409 1100238±2205196 <0.0001* 40251±48086 924919±1883390 0.0008*
Range 7488–1760217 30668–10315091 2764–350348 31564–9511797 3891–179712 15859–8097516
MTV- metabolic tumor volume; TLG—total lesion glycolysis; BPNST—benign peripheral nerve sheath tumors; MPNST—malignant peripheral nerve sheath tumors; SD—standard
deviation;
*—statistically significant
doi:10.1371/journal.pone.0143305.t003
F-18-FDG
PET/CT
|DOI:10.137
1/journal.p
one.0143305
December
1,
maximum sensitivity and a specificity of 71%. However, SUVmaxonly represents the highest
metabolic activity of a pixel within the tumor, not taking into account other biological parame-ters such as the tumor volume. MPNSTs often arise from so called plexiform neurofibromas which are often very large and -due to necrosis and fibrotic scar tissue- markedly heteroge-neous tumor manifestations with highly variable shapes [4,26,28]. Therefore, one-dimensional assessments such as SUVmaxdo not necessarily represent the real tumor burden or tumor
biol-ogy. To identify malignant change, active tumor volume is more relevant to increase specificity and reduce false positive diagnoses than a single pixel with high metabolic activity. Indeed, MTV and TLG incorporate both metabolic activity and three-dimensional tumor volume. In the present study, both MTV and TLG were significantly different between benign and malig-nant PNSTs at all SUVmaxthresholds (p<0.001). ROC analyses revealed that both parameters
could be used to identify malignant change with similar sensitivity and specificity like the established SUVmaxcut-off. However, specificity was not fully satisfying for all assessed
param-eters (MTV, TLG, SUVmax), which is a known challenge in MPNST imaging.
With improving image analysis tools and three-dimensional display techniques, volume based parameters of F-18-FDG PET may be evaluated rapidly and consistently [29–33]. How-ever, there is currently no standard methodology for assessment of volumetric PET parameters. Previous studies assessing MTV and TLG in a variety of tumors used different methods to define a threshold for SUVs to delineate the metabolic tumor volume. Some studies also used an isocontour threshold method based on F-18-FDG uptake segmented above a threshold of 2.5 or 3.0 [30,31]. Others assessed MTV using different methods like setting a margin threshold of 50% of SUVmaxof that lesion [32]. In the present study we used three different fixed SUVmax
isocontour thresholds of 2.0, 2.5 and 3.5. The rationale for that approach was that a threshold of3.5 represents the most commonly used cut-off value for differentiation between MPNSTs and PNSTs [26]. Indeed, all MPNSTs in this study demonstrated a SUVmaxof at least 4.6. A
SUVmaxthreshold of2.5 is usually used to define the need for follow-up of PNSTs to rule out
malignant transformation in the future [10,26]. The lowest threshold of2.0 was chosen to Table 4. Data on imaging-derived parameters comparing the patient group with benign PNST only and the group with benign and malignant PNSTs at a threshold of 2.0.
Parameter NF1 p
BPNST Group MPNST Group
Number of lesions (n)
Mean±SD 2.1±2.2 2.3±1.6 0.29
Range 1–9 1–7
Tumor size (mm)
Mean±SD 52.6±35.4 86.6±56.2 0.002*
Range 11–172 12–292
SUVmax
Mean±SD 3.9±1.4 7.2±4 0.002*
Range 2.2–9.1 2.3–16
SUVmean
Mean±SD 2.6±0.5 3.5±1.1 0.003*
Range 1.7–3–8 2–6.7
BPNST—benign peripheral nerve sheath tumors; MPNST—malignant peripheral nerve sheath tumors; SD —standard deviation;
*—statistically significant. doi:10.1371/journal.pone.0143305.t004
F-18-FDG PET/CT in NF1
Fig 5. Multiple metabolically active tumors.Maximum intensity projection PET image (A) of a patient with a MPNST in the right upper leg (SUVmax/ MTV / TLG: 5.3 / 63488 / 190464), plexiform neurofibromas in the
left head and neck area (SUVmax/ MTV / TLG: 3.6 / 17088 / 42720), below the right liver lobe (SUVmax/ MTV /
TLG: 3.7 / 3584 / 8960), in the right pelvis (SUVmax/ MTV / TLG: 2,5 / 6435 / 14157) and in the left upper leg
(SUVmax/ MTV / TLG: 5.3 / 4096 / 13107). Automatically delineated metabolically active tumor volumes (red)
(B).
doi:10.1371/journal.pone.0143305.g005
Table 5. ROC analysis for MTV and TLG on both a per-lesion and a per-patient basis.
MTV
SUVmaxthreshold Sensitivity (%) Specificity (%) MTV (mm3) AUC p
Per -lesion 2.0 95 74.1 >22336 0.92 <0.0001
2.5 95 80.5 >19680 0.94 <0.0001
3.5 84.2 72 >10848 0.90 <0.0001
Per- patient 2.0 100 86.7 >82400 0.92 <0.0001
2.5 93.7 78.6 >42528 0.93 <0.0001
3.5 94.1 75 >15648 0.95 <0.0003
TLG
SUVmaxthreshold Sensitivity (%) Specificity (%) TLG AUC p
Per -lesion 2.0 94.7 78 >99213 0.94 <0.0001
2.5 94.1 83 >82627 0.96 <0.0001
3.5 89 71 >43392 0.90 <0.0001
Per- patient 2.0 94.4 80 >204614 0.88 <0.0001
2.5 94 79 >133235 0.93 <0.0001
3.5 88.2 75 >102006 0.91 <0.001
evaluate the volume of all PNSTs with relevant metabolic activity, and was therefore used to define PET+ tumors in this study. A threshold of3.5 should be regarded as most important and should remain the basis for future studies, for it can identify malignant tumor tissue with high reliability.
Whole-body MRI is widely used in NF1 to define a subpopulation with internal tumor bur-den, to further characterize PNSTs and to provide a means for follow-up examinations to iden-tify growing lesions [19–22]. Assessment of whole-body internal tumor burden using
segmentation techniques for T2-weighted whole-body MRI sequences has been investigated in several studies [20,21]. Higher internal tumor burden on T2-weighted imaging has been associ-ated with an increased risk for developing MPNSTs. In a study by Nguyen et al., patients with MPNSTs demonstrated a significantly higher whole-body tumor volume compared to NF1 patients without MPNSTs. However, the non-MPNST group included a significant number of patients without internal tumors which have a substantially lower risk for developing malignancy [21]. In the present study, both WB-MTV and WB-TLG were significantly higher in patients with MPNSTs (p<0.001). Given the fact that only a small proportion of internal tumors in NF1 are metabolically active and that MPNSTs uniformly demonstrate high F-18-FDG uptake, assessment of WB-MTV may help to more precisely define populations at risk than mere assess-ment of morphologic tumor burden on T2w. This is supported by the fact that so far, MRI-derived volumetric assessment showed no correlation with genetic analyses, e.g. large NF1-dele-tions, even though constitutional large NF1-deletions are generally associated with more severe clinical manifestations [1]. In addition, known serum markers of Schwann cells like S100βhave shown no correlation with MRI tumor burden [22]. Assessment of biologically active tumor bur-den on PET might provide a more promising parameter for correlation analysis, hypothesizing that serum markers of tumor burden may be mainly originating from active tumors. Further studies comparing T2w-derived whole-body tumor burden, WB-MTV and WB-TLG will shed light on the usefulness of these techniques for providing an imaging biomarker correlating with known circulating biomarkers such as adrenomedullin, MIA or SOX9 [34–36].
Some limitations of the present study should be mentioned. First, given the retrospective nature of this study, a selection bias cannot be ruled out. Second, the number of included patients is relatively small. However, the number of included MPNSTs (n= 19) is comparable to or higher than in other studies [7,26,27]. A particular strength of this study is that the study population is matched for both age and gender which has not been done in most other studies comparing malignant and benign PNSTs. Third, histopathologic evaluation could not be per-formed in all PNSTs for both practical and ethical reasons. However, regarding the follow-up of 54 ± 23 months, it is highly unlikely that tumors might have been misclassified. Finally, we did not assess the prognostic significance of MTV and TLG. Although it is tempting to assume that large tumors may carry a worse prognosis, we consider the most important value of PET MTV and TLG in NF1 patients to comprehensively characterize the clinical phenotype and to provide a basis for evaluation of genotype-phenotype relations and biochemical markers.
Conclusion
WB-MTV and WB-TLG identify a distinct phenotype of neurofibromatosis patients, charac-terize biologic subpopulations, and may discriminate between malignant and benign PNSTs. Therefore, one might assume that MTV and TLG provide the basis for investigating molecular biomarkers that correlate with metabolically active disease manifestations. Further evaluation will determine the potential clinical impact and prognostic significance of these PET-based parameters in NF1.
F-18-FDG PET/CT in NF1
Author Contributions
Conceived and designed the experiments: JS TD GA VM IA. Performed the experiments: JS AL. Analyzed the data: JS TD IA. Contributed reagents/materials/analysis tools: GA TD VM ZT LP. Wrote the paper: JS TD.
References
1. Kluwe L, Nguyen R, Vogt J, Bengesser K, Mussotter T, Friedrich RE, et al. Internal tumor burden in neurofibromatosis Type I patients with large NF1 deletions. Genes Chromosomes Cancer. 2012; 51: 447–451. doi:10.1002/gcc.21931PMID:22294457
2. Ferner RE, Gutmann DH. International consensus statement on malignant peripheral nerve sheath tumors in neurofibromatosis. Cancer Res. 2002; 62: 1573–1577. PMID:11894862
3. Ducatman BS, Scheithauer BW, Piepgras DG, Reiman HM, Ilstrup DM. Malignant peripheral nerve sheath tumors. A clinicopathologic study of 120 cases. Cancer. 1986; 57: 2006–2021. PMID:3082508 4. Korf BR. Plexiform neurofibromas. Am J Med Genet. 1999; 89: 31–37. PMID:10469434
5. Evans DG, Huson SM, Birch JM. Malignant peripheral nerve sheath tumours in inherited disease. Clin Sarcoma Res. 2012; 2: 17. doi:10.1186/2045-3329-2-17PMID:23036231
6. Rasmussen SA, Yang Q, Friedman JM. Mortality in neurofibromatosis 1: an analysis using U.S. death certificates. Am J Hum Genet. 2001: 68:1110–1118. PMID:11283797
7. Salamon J, Veldhoen S, Apostolova I, Bannas P, Yamamura J, Herrmann J, et al. 18F-FDG PET/CT for detection of malignant peripheral nerve sheath tumours in neurofibromatosis type 1: tumour-to-liver ratio is superior to an SUVmax cut-off. Eur Radiol. 2014; 24: 405–412. doi: 10.1007/s00330-013-3020-xPMID:24097302
8. Salamon J, Derlin T, Bannas P, Busch JD, Herrmann J, Bockhorn M, et al. Evaluation of intratumoural heterogeneity on 18F-FDG PET/CT for characterization of peripheral nerve sheath tumours in neurofi-bromatosis type 1. Eur J Nucl Med Mol Imaging. 2013; 40: 685–692. doi:10.1007/s00259-012-2314-6 PMID:23232507
9. Combemale P, Valeyrie-Allanore L, Giammarile F, Pinson S, Guillot B, Goulart DM, et al. Utility of 18F-FDG PET with a semi-quantitative index in the detection of sarcomatous transformation in patients with neurofibromatosis type 1. PLoS One. 2014; 9: e85954. doi:10.1371/journal.pone.0085954PMID:
24516522
10. Derlin T, Tornquist K, Münster S, Apostolova I, Hagel C, Friedrich RE, et al. Comparative effectiveness of 18F-FDG PET/CT versus whole-body MRI for detection of malignant peripheral nerve sheath tumors in neurofibromatosis type 1. Clin Nucl Med. 2013. 38: e19–25. doi:10.1097/RLU.0b013e318266ce84 PMID:23242059
11. Khiewvan B, Macapinlac HA, Lev D, McCutcheon IE, Slopis JM, Al Sannaa G, et al. The value of 18F-FDG PET/CT in the management of malignant peripheral nerve sheath tumors. Eur J Nucl Med Mol Imaging. 2014; 41: 1756–1766. doi:10.1007/s00259-014-2756-0PMID:24699907
12. Meany H, Dombi E, Reynolds J, Whatley M, Kurwa A, Tsokos M, et al. 18-fluorodeoxyglucose-positron emission tomography (FDG-PET) evaluation of nodular lesions in patients with Neurofibromatosis type 1 and plexiform neurofibromas (PN) or malignant peripheral nerve sheath tumors (MPNST). Pediatr Blood Cancer. 2013; 60: 59–64. doi:10.1002/pbc.24212PMID:22645095
13. Urban T, Lim R, Merker VL, Muzikansky A, Harris GJ, Kassarjian A, et al. Anatomic and metabolic eval-uation of peripheral nerve sheath tumors in patients with neurofibromatosis 1 using whole-body MRI and (18)F-FDG PET fusion. Clin Nucl Med. 2014; 39: e301–307. doi:10.1097/RLU.
0b013e3182a757d3PMID:24152623
14. Lee JW, Cho A, Lee JH, Yun M, Lee JD, Kim YT, et al. The role of metabolic tumor volume and total lesion glycolysis on18F-FDG PET/CT in the prognosis of epithelial ovarian cancer. Eur J Nucl Med Mol Imaging. 2014; 41: 1898–1906. doi:10.1007/s00259-014-2803-xPMID:24852188
15. Liao S, Penney BC, Wroblewski K, Zhang H, Simon CA, Kampalath R, et al. Prognostic value of meta-bolic tumor burden on 18F-FDG PET in nonsurgical patients with non-small cell lung cancer. Eur J Nucl Med Mol Imaging. 2012 39: 27–38. doi:10.1007/s00259-011-1934-6PMID:21946983
16. Lee JW, Kang CM, Choi HJ, Lee WJ, Song SY, Lee JH, et al. Prognostic Value of Metabolic Tumor Vol-ume and Total Lesion Glycolysis on Preoperative 18F-FDG PET/CT in Patients with Pancreatic Can-cer. J Nucl Med. 2014; 55: 898–904. doi:10.2967/jnumed.113.131847PMID:24711649
18. Ryu IS, Kim JS, Roh JL, Lee JH, Cho KJ, Choi SH, et al. Prognostic value of preoperative metabolic tumor volume and total lesion glycolysis measured by 18F-FDG PET/CT in salivary gland carcinomas. J Nucl Med. 2013; 54: 1032–1038. doi:10.2967/jnumed.112.116053PMID:23670902
19. Plotkin SR, Bredella MA, Cai W, Kassarjian A, Harris GJ, Esparza S, et al. Quantitative assessment of whole-body tumor burden in adult patients with neurofibromatosis. PLoS One. 2012 7: e35711. doi:10. 1371/journal.pone.0035711PMID:22558206
20. Cai W, Kassarjian A, Bredella MA, Harris GJ, Yoshida H, Mautner VF, et al. Tumor burden in patients with neurofibromatosis types 1 and 2 and schwannomatosis: determination on whole-body MR images. Radiology. 2009; 250: 665–673. doi:10.1148/radiol.2503080700PMID:19244040
21. Nguyen R, Jett K, Harris GJ, Cai W, Friedman JM, Mautner VF. Benign whole body tumor volume is a risk factor for malignant peripheral nerve sheath tumors in neurofibromatosis type 1. J Neurooncol. 2014; 116: 307–313. doi:10.1007/s11060-013-1293-1PMID:24166582
22. Smith MJ, Esparza S, Merker VL, Muzikansky A, Bredella MA, Harris GJ, et al. Plasma S100βis not a useful biomarker for tumor burden in neurofibromatosis. Clin Biochem. 2013; 46: 698–700. doi:10. 1016/j.clinbiochem.2012.12.007PMID:23261835
23. NIH Office of Medical Applications of Research. Neurofibromatosis. Conference statement. National Institutes of Health Consensus Development Conference. Arch Neurol. 1988; 45: 575–578. PMID: 3128965
24. Zsoter N, Bandi P, Szabo G, Toth Z, Bundschuh RA, Dinges J, et al. PET-CT based automated lung nodule detection. Conf Proc IEEE Eng Med Biol Soc. 2012: 4974–4977. doi:10.1109/EMBC.2012. 6347109PMID:23367044
25. Trojani M, Contesso G, Coindre JM, Rouesse J, Bui NB, de Mascarel A, et al. Soft-tissue sarcomas of adults; study of pathological prognostic variables and definition of a histopathological grading system. Int J Cancer. 1984; 33: 37–42. PMID:6693192
26. Warbey VS, Ferner RE, Dunn JT, Calonje E, O'Doherty MJ. [18F]FDG PET/CT in the diagnosis of malignant peripheral nerve sheath tumours in neurofibromatosis type-1. Eur J Nucl Med Mol Imaging. 2009; 36: 751–757. doi:10.1007/s00259-008-1038-0PMID:19142634
27. Benz MR, Czernin J, Dry SM, Tap WD, Allen-Auerbach MS, Elashoff D, et al. Quantitative F18-fluoro-deoxyglucose positron emission tomography accurately characterizes peripheral nerve sheath tumors as malignant or benign. Cancer. 2010; 116: 451–458. doi:10.1002/cncr.24755PMID:19924789 28. Mautner VF, Hartmann M, Kluwe L, Friedrich RE, Fünsterer C. MRI growth patterns of plexiform
neuro-fibromas in patients with neurofibromatosis type 1. Neuroradiology. 2006; 48: 160–165. PMID: 16432718
29. Chung HH, Kwon HW, Kang KW, Park NH, Song YS, Chung JK, et al. Prognostic value of preoperative metabolic tumor volume and total lesion glycolysis in patients with epithelial ovarian cancer. Ann Surg Oncol. 2012; 19: 1966–1972. doi:10.1245/s10434-011-2153-xPMID:22124757
30. Hyun SH, Ahn HK, Kim H, Ahn MJ, Park K, Ahn YC, et al. Volume based assessment by F-FDG PET/ CT predicts survival in patients with stage III non-small-cell lung cancer. Eur J Nucl Med Mol Imaging. 2014; 41: 50–58. doi:10.1007/s00259-013-2530-8PMID:23948859
31. Oh JR, Seo JH, Chong A, Min JJ, Song HC, Kim YC, et al. Whole body metabolic tumour volume of 18F-FDG PET/CT improves the prediction of prognosis in small cell lung cancer. Eur J Nucl Med Mol Imaging. 2012; 39: 925–935. doi:10.1007/s00259-011-2059-7PMID:22270509
32. Yoon HJ, Paeng JC, Kwak C, Park YH, Kim TM, Lee SH, et al. Prognostic implication of extrarenal met-abolic tumor burden in advanced renal cell carcinoma treated with targeted therapy after nephrectomy. Ann Nucl Med. 2013; 27: 748–755. doi:10.1007/s12149-013-0742-4PMID:23818007
33. Lee SJ, Choi JY, Lee HJ, Baek CH, Son YI, Hyun SH, et al. Prognostic value of volume-based (18)F-fluorodeoxyglucose PET/CT parameters in patients with clinically node-negative oral tongue squamous cell carcinoma. Korean J Radiol. 2012; 13: 752–759. doi:10.3348/kjr.2012.13.6.752PMID:23118574 34. Hummel TR, Jessen WJ, Miller SJ, Kluwe L, Mautner VF, Wallace MR, et al. Gene expression analysis
identifies potential biomarkers of neurofibromatosis type 1 including adrenomedullin. Clin Cancer Res. 2010; 16: 5048–5057. doi:10.1158/1078-0432.CCR-10-0613PMID:20739432
35. Miller SJ, Jessen WJ, Mehta T, Hardiman A, Sites E, Kaiser S, et al. Integrative genomic analyses of neurofibromatosis tumours identify SOX9 as a biomarker and survival gene. EMBO Mol Med. 2009; 1: 236–248. doi:10.1002/emmm.200900027PMID:20049725
36. Kolanczyk M, Mautner V, Kossler N, Nguyen R, Kühnisch J, Zemojtel T, et al. MIA is a potential bio-marker for tumour load in neurofibromatosis type 1. BMC Med. 2011; 9: 82. doi: 10.1186/1741-7015-9-82PMID:21726432
F-18-FDG PET/CT in NF1