Network Diversity and Affect Dynamics: The
Role of Personality Traits
Aamena Alshamsi1, Fabio Pianesi2, Bruno Lepri2,3, Alex Pentland3, Iyad Rahwan1,3*
1Department of Electrical Engineering and Computer Science, Masdar Institute of Science & Technology, Abu Dhabi, United Arab Emirates,2Foundation Bruno Kessler, Trento, Italy,3Media Laboratory, Massachusetts Institute of Technology, Cambridge, Massachusetts, United States of America
Abstract
People divide their time unequally among their social contacts due to time constraints and varying strength of relationships. It was found that high diversity of social communication, dividing time more evenly among social contacts, is correlated with economic well-being both at macro and micro levels. Besides economic well-being, it is not clear how the diver-sity of social communication is also associated with the two components of individuals’
sub-jective well-being,positiveandnegative affect. Specifically, positive affect and negative affect are two independent dimensions representing the experience (feeling) of emotions. In this paper, we investigate the relationship between the daily diversity of social communica-tion and dynamic affect states that people experience in their daily lives. We collected two high-resolution datasets that capture affect scores via daily experience sampling surveys and social interaction through wearable sensing technologies: sociometric badges for face-to-face interaction and smart phones for mobile phone calls. We found that communication diversity correlates with desirable affect states–e.g. an increase in the positive affect state or a decrease in the negative affect state–for some personality types, but correlates with undesirable affect states for others. For example, diversity in phone calls is experienced as good by introverts, but bad by extroverts; diversity in face-to-face interaction is experienced as good by people who tend to be positive by nature (trait) but bad for people who tend to be not positive by nature. More broadly, the moderating effect of personality type on the rela-tionship between diversity and affect was detected without any knowledge of the type of social tie or the content of communication. This provides further support for the power of unobtrusive sensing in understanding social dynamics, and in measuring the effect of potential interventions designed to improve well-being.
Introduction
The advent of communication technologies and the ease of mobility have made our social net-works more diverse. Almost on a daily basis, we contact different people from diverse back-grounds and relationships. One straightforward way to measure the diversity of our social
a11111
OPEN ACCESS
Citation:Alshamsi A, Pianesi F, Lepri B, Pentland A, Rahwan I (2016) Network Diversity and Affect Dynamics: The Role of Personality Traits. PLoS ONE 11(4): e0152358. doi:10.1371/journal.pone.0152358
Editor:Alain Barrat, Centre de Physique Théorique, FRANCE
Received:July 8, 2015
Accepted:March 12, 2016
Published:April 1, 2016
Copyright:© 2016 Alshamsi et al. This is an open access article distributed under the terms of the
Creative Commons Attribution License, which permits unrestricted use, distribution, and reproduction in any medium, provided the original author and source are credited.
Data Availability Statement:All relevant data are deposited into Figshare (https://figshare.com/s/ b3fc96e494e74bc9a0ba).
Funding:This project has received funding from the European Union’s Seventh Framework Programme for research, technological development and demonstration under the agreement no PCOFUND-GA-2008_226070. The funders had no role in study design, data collection and analysis, decision to publish, or preparation of the manuscript.
networks is through considering the uniqueness of people who we interact with, possibly quan-tify it according to the number of people we communicate with (number of different social contacts) [1], types of relationships (e.g. friend and/or family) [2,3] or backgrounds (e.g. eth-nicities) [4,5]. By using these measures, diversity in social networks appears to lead or correlate with desirable societal outcomes [6] such as better health [2,3] and higher creativity [7], as well as with less desirable ones such as distrust, less voting and donation [4] and low performance in schools [8]. Social network diversity seems connected also with affect, namely the experi-ence/feeling of emotions, in the context of daily interaction [9] and social (emotional, financial or informational) support from other people [10].
Nevertheless, the above concept of diversity does not consider the role that time plays in shaping our social interactions and, in particular, in having each of us allocate different time to different people (social contacts [11]). Such time-sensitive notion of social communication diversity (dividing time more or less evenly among social ties) has been shown to associate with economic well-being indices, such as economic development in communities [12] and individual’s financial status [13], as well as with individual outcomes such as study perfor-mance [8].
In this paper, we try to extend this body of work by investigating the relationships (if any) between such notion of diversity–which we will refer to by the termdiversity of social
commu-nication–and two important components of subjective well-being:positiveandnegative affect.
Specifically, positive and negative affect are two independent dimensions representing the self-reported or inferred experience (feeling) of emotions [14–16]. Positive affect (PA) reflects the degree of feeling“enthusiastic”,“active”and“alert”, whereas negative affect (NA) reflects“ dis-tress and not pleasurable engagement”feelings e.g.“anger, disgust, guilt, fear and nervousness”. Although positive affect and negative affect intuitively look inversely correlated, they exhibit a degree of distinction and independence from each other according to their intensities [15]. The presence (absence) of one type of affect does not entail the absence (presence) of the other; they are measured separately [17].
We chose affect as a proxy for subjective well-being because it has an impact on different aspects of people’s lives. For example, positive affect is associated with many desirable out-comes e.g. success [18], creative problem solving, [18] motivation and performance [19]. How-ever, negative affect is associated and correlated with stress [20] and health complaints [21]. Interestingly, affect plays a role in organizations [22,23], especially between groups [24].
What we are interested in understanding, therefore, is whether the changing diversity of social communication, measured on a daily basis, is anyhow related to the dynamics of positive and negativeaffect states, measured again on a daily basis. In psychology,affect statesare momentary experiences (e.g. when a person feels anxious or angry at a particular moment).
Other aspects that should be considered are the possible differences due to the communica-tion modality and the communicacommunica-tion setting. Conceivably, face-to-face communicacommunica-tion can impose different time limitation than, e.g. phone calls. Similarly, interactions in workplaces can impose different constraints (e.g. they are time limited and partially random) than daily spon-taneous interactions with friends and relatives. Hence, this could reflect in diversity of social interaction and in the way it relates to affect states. In order to control for these possibilities, we exploited two data sets, one containing face-to-face interactions in a workplace and the other daily cell-phone calls.
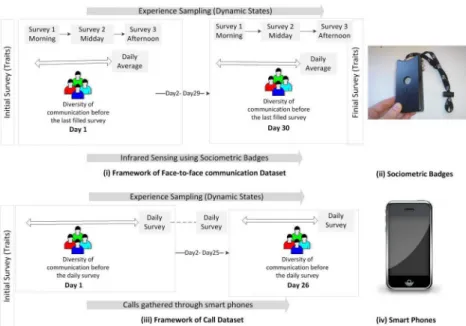
The first dataset [29] contains the face-to-face interactions of 52 people who wore the sociometric badge [30] for 30 (working) days. The sociometric badges are wearable devices that are capable of detecting face-to-face interaction through embedded infrared sensors. The second dataset contains the cell-phone calls of 119 people, recorded for a period of 26 days. Daily experience sampling surveys were used in both cases to collect information about daily affect states.
The notion of diversity of social communication can be operationalized in two partially dif-ferent ways. Starting from the distribution of time allocated to each contact during a given day, we can model the diversity as the distributionaluniformity, with diversity decreasing when few social contacts consume more communication time than other contacts. In this view, diversity of social communication becomes similar to Shannon entropy [1,12,13]. A slightly different approach exploits the concept ofunequality: diversity is high when every contact is allocated the same amount of time and it decreases when fewer contacts take a bigger share of the avail-able time; such a notion can be operationalized through the Gini coefficient [31][32]. In princi-ple, this quantity has an inverse relationship with Shannon entropy. However, this relationship breaks down when the number of social contacts is 1, as both Gini and Shannon entropy yield a zero value.
Methods
Data Collection
High-resolution sensors have made collecting and analyzing enormous amount of social inter-action data possible [33–35], alleviating the exclusive reliance on self-reports based on people’s memory [36]. Moreover, sensors can log data at very fine time-scales [37] without interfering with people’s routines or consuming their time, making it easier to investigate short-duration phenomena. Therefore, we used two types of wearable sensors to track the social interaction of participants in two separate experiments: (1) sociometric badges and (2) smart phones. We col-lected also the affect states and traits of participants through surveys.
Sociometric Badges Dataset. Sociometric Badges, designed and built by author Pentland, are equipped with accelerometer, microphone, bluetooth and infrared sensors that can be used to capture (i) body movements, (ii) prosodic speech features (e.g. pitch), (iii) proximity to/colo-cation with other people and (iv) face-to-face interactions respectively [30]. In this work, we exploit infrared sensors–Fig 1(ii)–to recognize similar sensors facing them, implying that the two participants wearing them had a face-to-face interaction. In order for a badge to be detected through infrared sensors from another badge, the two badges must have a direct line of sight and the receiving badge’s infrared must be within the transmitting badge’s infrared sig-nal cone of heighth<= 1 meter and a radius ofr<=htanθ, whereθ= 15° degrees; the
infra-red transmission rate (TRir) was set to 1Hz.
low negative affect (LNA)–Fig 1(i). In addition, affect and personality (stable) traits were mea-sured at the beginning and at the end of the study.
The study lasted 30 working days during work hours at the premises of a research organiza-tion in northern Italy. The participants are employees in a research instituorganiza-tion in Italy who vol-unteered to participate in the experiment for six weeks (working days are considered only). They belong to five units whereby all the employees of these units participated in the experi-ment along with the heads of these units. Their ages range from 23 to 53 with an average of 36. Forty seven participants are men (90.3%) and five are women (9%). Forty seven participants are Italian (90.3%) and five participants are from other countries (9%). Forty six out of the fifty two participants were researchers in computer science belonging to four research groups; the remaining six participants were part of the full-time IT support staff. Their educational level varies from high school diplomas to PhD degrees. Following the Italian regulations, all partici-pants were asked to sign an informed consent form and the study was conducted in accordance to the form. The general study and the form were also approved by the ethical committee of Ca’Foscari University of Venice.
Procedure. The participants wore sociometric badges every working day within the insti-tution. At the beginning and at the end of the experiment, the participants filled extended sur-veys about personality and affect traits. During the six weeks, participants were asked to fill three dailyexperience samplingsurveys about their transient affect states that they have experi-enced in the last 30 minutes. It is very unlikely that people would have experiexperi-enced significantly varying affect states during such a short period of time. The surveys were triggered to be sent via email every working day at 11:00 AM, 2:00 PM and 5:00 PM. The participants were given Fig 1. At the beginning and the end of the experiments, participants filled a survey capturing their (stable) traits.(i) Framework of the Sociometric Badges Dataset: Participants filled 3 daily surveys to measure (dynamic) states. We take the daily average of states and calculate the daily diversity in
communication that took place before the last filled survey. (ii) Sociometric Badges are used to track face-to-face interactions by means of infrared (IR) sensors. (iii) Framework of the Mobile Territorial Lab project: Participants filled one daily survey to measure daily (dynamic) states. We calculate the diversity in communication that took place before the daily filled survey. (iv) Smart phones tracks the daily call social networks of participants.
2.5 hours to fill the surveys. We refer to the first survey as the morning survey, the second sur-vey as the midday sursur-vey and the third sursur-vey as the afternoon sursur-vey.
Experience sampling surveys elicit dynamic states of affect. Questions in these surveys report participants’states which were experienced in the last 30 minutes. The short version of Positive and Negative Affect Schedule (PANAS) was used to evaluate the affect states of partici-pants [39]. Specifically, high positive affect (HPA) was assessed using 3 items:enthusiastic,
interestedandactive. High negative affect (HNA) was assessed using 3 items:sad,boredand
sluggish. Low positive affect (LPA) was assessed using 2 items:calmandrelaxed, while low
neg-ative affect (LNA) was assessed using 2 itemslonelyandisolated. Respondents were asked to report a number on a scale from 1 to 5 (1 =Very SlightlyorNot At Alland 5 =Extremely) for each item. Then, we averaged the numbers assigned to the items describing a given state (e.g.
enthusiastic,interestedandactivefor HPA)
Note that the experience sampling method has a long history and is highly reliable in mea-suring dynamics of psychological states within individuals [40]. For those interested in the cave-ats around the use of experience sampling, we also point to extensive discussions elsewhere [41]. On the other hand, the Italian version of the Big Five Marker Scale (BFMS) [42] was used to assess personality traits at the beginning and at the end of the experiment. This scale is an adjective list composed by 50 items. Our sample was composed of almost 90% Italian native speakers and the subjects who were not Italian native speakers received a validated translation of the BFMS. Similarly, Multidimensional Personality Questionnaire (MPQ) was utilized to measure the affect traits of our participants [43].
Preprocessing the surveys. We take the average of the daily scores of dynamic affect states of each participant to associate it with the daily diversity in communication that take place before the last filled survey.
Dispositional Traits of Personality and Affect. We considered the trait scores that were reported by participants at the end of the experiment. Then, we normalized the trait scores of participants using the mean and the standard deviation. To discuss the statistical interaction between traits and social-situational factors associated with a given transition, we focused only on participants with high scores in the trait (+1 standard deviation) and participants with low scores in the trait (-1 standard deviation). By using this method, we are able to know how levels of traits moderates the association between the social-situational factors and the variability in states. For example, we are interested to know how introverts respond to an increase in the diversity in social communication in comparison to extroverts’response to the same increase.
Mobile Territorial Lab Dataset. Mobile phones allow for unobtrusive and cost-efficient access to huge streams of previously inaccessible data related to daily social behavior [44–47]. Recently, the social psychologist Miller wrote“The Smartphone Psychology Manifesto”in which he argued that the smartphones should be seriously considered as new research tools for psychology. In his opinion, these tools could revolutionize all fields of psychology and other behavioural sciences making these disciplines more powerful, sophisticated, and grounded in real-world behaviour [48]. Indeed, several works have started using smartphone activity data in order to predict personality traits [49–51], daily mood [52] and stress levels [53].
Procedure. We leveraged the sensing technologies that are available in smart phones and tracked the daily call social networks of 119 participants–the interlocutors could be within or outside the community of participants–in Trento, Italy for 26 days. Simultaneously, daily expe-rience sampling surveys were conducted to collect two affect states and their corresponding traits–high positive affect (HPA) and high negative affect (HNA)–Fig 1(iii). At the beginning of the study affect and personality (stable) traits were measured.
Telefonica [54]. Following the Italian regulations, all participants were asked to sign an informed consent form and the study was conducted in accordance to it. The general study and the form were also approved by a joint Ethical Committee of University of Trento and Province of Trento (for more details about Mobile Territorial Lab, checkS1 File).
A total of 119 volunteers from the MTL chose to participate in our data collection of daily affect states. Their ages range from 28 to 50 with an average of 39. Forty three participants are men (36%) and seventy six are women (63%). 115 participants are Italian (96.6%) and four par-ticipants are from other countries (3.4%). They held a variety of occupations and education lev-els, ranging from high school diplomas to PhD degrees. All were savvy Android users who had used the smartphones provided by the MTL since November 2012.
During the 26 days, participants were asked to fill daily experience sampling surveys about transient affect states that they experience. The surveys were triggered to be sent via email and via SMS every day at 8:00 PM and the participants were given four hours to fill the surveys.
The short version of Positive and Negative Affect Schedule (PANAS) was used to evaluate the affective daily states of participants [39]. Specifically, positive affect (PA) was assessed using 5 items:alert,inspired,determined,attentiveandactive. Negative affect (NA) was assessed using 5 items:upset,hostile,ashamed,nervousandafraid.
At the beginning of the study, the participants filled extended surveys about personality and affect traits. The long version of Positive and Negative Affect Schedule (PANAS) was used to measure the affect traits’scores of our participants [14].
Preprocessing the surveys. The data comprise 1499 surveys by the 119 participants. Ide-ally, the number of filled surveys should be 3094 (119 participants × 1 daily surveys × 26 days). However, participants sometimes do not fill the daily surveys or fill them late. Because we aimed at relating the affect states to the preceding diversity in communication, the time win-dow of the preceding communication is about twenty four hours approximately. Therefore, many surveys were not taken into consideration. Regarding the affect states, we took the exact daily reported scores.
Dispositional Traits of Personality and Affect. We followed the same described approach for the sociometric badges dataset in Section“Sociometric Badges Dataset”.
Dynamic Social networks for both Datasets
We created dynamic temporal networks of face-to-face interaction and mobile phone commu-nication for each participant in the two datasets. For each day, we created the participant’s tem-poral dynamic social network based on the social ties that the infrared sensor has detected or the phone calls that the participant has received or initiated. We considered only social net-works that took place before the last filled daily survey.
Due to the difference in the types of the communication, the scope of the networks in the two types differ too. The sociometric badges detect face-to-face interaction between partici-pants only, while smart phones can track calls between participartici-pants and other people– partici-pants or non-participartici-pants.
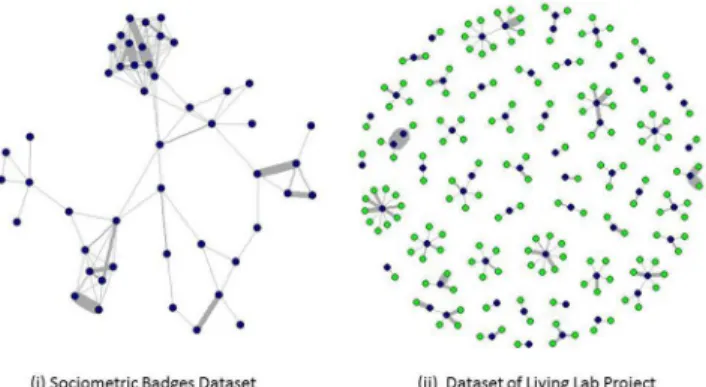
The dynamic social networks of the two datasets in a particular day are depicted inFig 2. Fig 3show the distribution of aggregate communication and social network sizes of partici-pants in the two datasets.
Diversity
when fewer social contacts receive more interaction time than other social contacts. By measur-ing the uncertainty of a random variable, Shannon entropy is a good summary measure of distributional uniformity and for this reason, it has been exploited to address diversity [1,12, 13].
Entropy is adapted to suite interaction networks by first calculating, for node (person)i, the share of communication time (pij) he/she has shared with each of his/her interacting part-ners (other nodes)j, usingFormula 1where:Vijis the communication volume between node i and j (number of infrared contacts in face-to-face communication or the total call dura-tion).
pij¼
Vij
Pk j¼1Vij
ð1Þ
pijis then plugged inFormula 2where k is the degree of node i (the number of i’s contacts) andpijis the proportion of i’s total communication volume that involves j, normalized by log2(k).
DsocialðiÞ ¼
Pk
j¼1pijlog2ðpijÞ
log2ðkÞ
ð2Þ
Diversity as inequality. If we assume that a given person, on a given day, has a given amount of time to distribute among his/her (potential) social contacts, then the diversity of social interaction comes close toinequality. This quantity is low when every contact is allocated the same amount of time and it increases as soon as fewer contacts take a bigger share of the available time. When seen from this perspective, the diversity of social interaction can be oper-ationalized through the Gini coefficient, whose typical application has been the measurement of the inequality of income distribution in a given population [32]
Fig 2. Sample daily networks of the two datasets.(i) The network of the community of participants is constructed based on the sociometric badges dataset in one typical day. The infrared sensors can only detect the infrared sensors of other participants, so the network includes face-to-face interactions within the community of participants. (ii) The call network is constructed including people within or outside the participant community in one typical day. MTL participants are coloured with dark blue while non-participants are coloured with green. In both networks, the thickness of edges represents the intensities of communication between two nodes. We can see that individuals are inclined to divide their time unequally among their social contacts.
We usedFormula 3to compute the Gini coefficient, wherekis the number of contacts and Vijis the volume of communication that involvesj.
DsocialðiÞ ¼
2Pk
j¼1jVij
kPkj¼1Vij
kþ1
k ð3Þ
Gini coefficient will be zero (no inequality) in two cases: a) when there are n>1 contacts and the communication is equally distributed among them and b) when there is just one con-tact who takes all the communication time. The latter case fully accords with the view of diver-sity asinequality: as there are nocompetingcontacts, there is no inequality. In principle, Gini has an inverse relationship with Shannon entropy. This relationship breaks down when the number of contacts is 1, as both Gini and Shannon entropy yield a zero value (no uncertainty = no uniformity but no inequality). For more details, we compare the behaviour of each diversity index in different scenarios inS1 File.
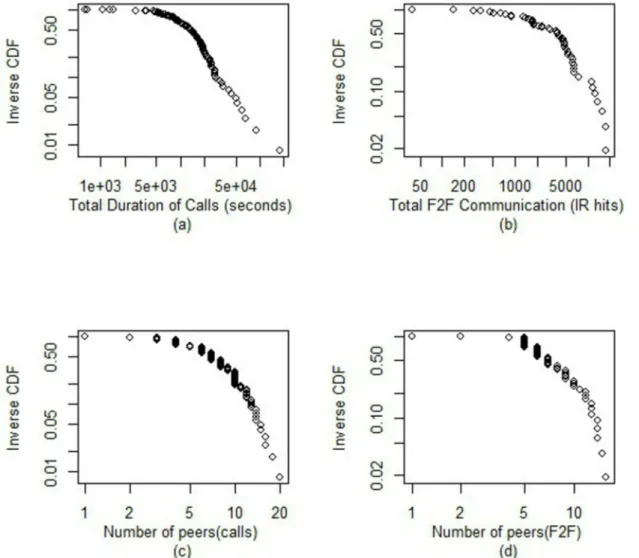
Fig 3. (a) Distribution of total time spent on phone calls by participants (b) Distribution of total time spent communicating through face-to-face interaction (c) Distribution of personal network sizes via mobile phones calls (d) Distribution of personal network sizes via face-to-face interaction.Generally, few individuals have very long phone calls or face-to-face interactions. Also, few individuals have a high number of social contacts.
Results
We first describe the statistical model that we used. Then, we present our results and discuss them.
Statistical Model
Both our independent variables (levels of the various traits and diversity measures–either Shan-non entropy or Gini coefficient) and dependent variables (HPA, LPA, HNA and LNA-state levels) are continuous. Hence, we used linear regression to model the relationship between dependent and independent variables. As both datasets contain longitudinal data, with repeated measures, OLS-based models are not an appropriate option, given that they do not capture within-subject correlation. We therefore used linear mixed models that allow for a flex-ible modeling of within-subject dependencies through different choices of co-variance struc-tures. Other advantages of exploiting linear mixed models are: the inclusion of both random and fixed effects–that allows for to consider subjects as a random sample from the population–
and higher robustness to unbalanced longitudinal data set with respect to repeated measure ANOVA.
Goodness of fit. It is essential to measure how well our model performs. Hence, we used the variance explained (R2) but its calculation is not straightforward in mixed models. Recently, Nakagawa and Schielzeth proposed two types ofvariance explained R2: (1) marginalR2and (2) conditionalR2[55]. MarginalR2addresses the variance explained by fixed effects, while the conditionalR2addresses the variance explained by fixed and random effects together. We used their method to calculate theR2. In our case, the marginalR2(addressing the variance
explained by fixed effects) is more relevant to quantify the goodness of model fit.
The role of diversity
In the context of face-to-face interactions, we analyzed 912 daily records of 52 participants and addressed four affect state: high and low positive affect (HPA/LPA) along with high and low negative affect (HNA/LNA). In phone call networks, we analyzed 1499 daily records of 119 participants and addressed two affect states: high positive affect (HPA) and high negative affect (HNA).Fig 4depicts the within-subject variations in the HPA dynamic state and the between-subject variations in the HPA stable trait. The trait can partially explain the accompanying scores of the dynamic states. Nevertheless, there is a lot of variations that traits alone do not seem to be able to explain that are expected to exist due to situational factors. In this case, we consider the diversity of social communication as a situational factor that can explain some of the variability in the affect states.
We started with our basic model that consists of a diversity measure: entropy or Gini, (Xij) that captures its fixed and random effects.Xijis the diversity of the social communication of participantiat dayj. LetYijdenotes the addressed affect state of participantiat dayj. For each affect state and communication type (face-to-face or phone calls), we fit the model inFormula 4whereβ0is a constant (intercept),β1is the fixed effect slope of the used diversity measure,β2 is the random slope of the used diversity measure,ujis the fixed intercept of individuals andeij is the time-specific error of participantiat timej.
Yij¼b0þb1Xijþb2Xijþujþeij ð4Þ
cases, the direction of the relationship between the diversity and the affect state is not consis-tent. Moreover, theR2(variance explained of models containing only diversity measures) is very small (<0.1). SeeS1 Filefor details. Therefore, the relationship between diversity in com-munication and affect dynamic states is weak and insufficient alone to explain the dynamics of daily affect states.
Individual Differences
Motivated by the fact that personality traits can partially explain the variability in affect states [27,28,56]–it is also observed inFig 4–especially when the traits are supported by situational Fig 4. Distribution of dynamic HPA state by participant and trait in the sociometric badges dataset.
Each boxplot describes the distribution of the high positive affect (HPA) state score for each participant. The colour intensity indicates the individual’s score of the corresponding trait (HPA trait). The dark blue colour
means that a participant has a low score in the HPA trait, while the light blue colour means that a participant has a high score in the HPA trait. The boxplots are sorted in an increasing order according to the score of the HPA trait. Generally, people who have high scores in the trait (darker colours) tend to have high scores in the scores of the corresponding state as well. The same applies to people who have low scores in the trait (lighter colours) who tend to have low scores in the corresponding state as well. However, there are many exceptions whereby the dispositional trait of HPA do not explain the daily scores of the state.
factors [26,57], we hypothesize that the interplay between the trait and the diversity of com-munication (the situational factor) can better explain affect dynamics.
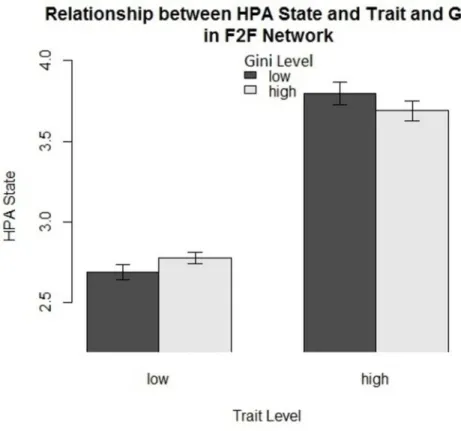
We turn now to consider the role (if any) played by the traits. We started with a visual inspection by plotting the interaction bar plot of the affect states, broken down by traits and diversity measures.Fig 5shows the relationship between the level of positive affecttrait (x-axis), the score of the positive affectstate(y-axis) and the discretized level of the Gini score–
black bars represent low scores of Gini and gray bars represent high scores of Gini. We discre-tized the values of the trait and the diversity measure (high and low) to demonstrate the role of the interaction between the trait and the diversity measure in affect dynamics. Obviously, the affectstatescores correspond to the affecttraitscores. In other words, people with high scores in the trait almost experience high scores of the affect state as well. However, when we consider the Gini coefficient, one can notice the effect of the trait score on the state score depends on the level of Gini score. When the trait is high, the mean score of the state is relatively low when Gini is high, while the mean score of the state is relatively high when Gini is low. The opposite can be witnessed in the case of low trait scores. Hence, the plot suggests that traits might indeed play a role in mediating the relationship between diversity in social communication and affect states. The purpose of the visualization is illustrating the suggested role of the interaction between traits and diversity measures in one example. Nevertheless, not all results are this
Fig 5. The bar plot demonstrates the mediating effect of traits in the relationship between the diversity measure and the score of the dynamic affect state.Generally, high scores of the trait correspond to high scores of the state. However, if we look for within-trait variation of dynamic state, we can see that diversity plays different roles in different levels of the trait. For example, when the trait level is low, the score of the state is relatively high for high scores of Gini and low for low scores of Gini. In contrast, when the trait level is high, the score of the state is relatively high for low scores of Gini and low for high scores of Gini.
clearly visible because the data is based on longitudinal studies, in which addressed variables (diversity and affect state) are sampled many times for each participant.
This visualization is giving us a hint that the role of diversity in affect dynamics is mediated by traits. However, we need to affirm the significance of the initial observations statistically using an appropriate statistical tool for longitudinal data. Therefore, we used the complete model that contains all the variables in the basic model plus the chosen individual trait (Ti) of participantiand the interaction between the trait and the diversity measure (TiXij) whereβ
3 is the fixed effect of the trait andβ4is the fixed effect of the interaction between the trait and the diversity measure inFormula 5.
Yij¼b0þb1Xijþb2Xijþb3Tiþb4TiXijþujþeij ð5Þ
Deviance Test. In addition to considering the significance of the fixed effect parameters, it is important to also investigate whether the more complex model indeed provides a better fit to the data. To this end, we exploit thedeviance testwhich compares the deviances of the two models (the negative of twice the log-likelihood of each model) and checks whether the more complex one has a significantly lower deviance than the basic one. If so, we can confidently conclude that the more complex model yields a better fit to the data. Otherwise, the basic model is preferred.
We found that the role of diversity of communication is dependent on the addressed affect state, the psychological trait, the selected diversity measure and the communication type. For instance, in the context of face-to-face interaction, diversity (calculated by Gini) correlates neg-atively with high positive affect (HPA) for individuals who have low scores in the correspond-ing HPA, while it correlates positively with HPA state for individuals who have high scores in the HPA trait (MarginalR2= 0.3 and pr(χ2) = 0.03). In the context of call networks, however, the diversity, measured by Gini, correlates positively with HPA for introverts and vice versa for extroverts (MarginalR2= 0.013 and pr(χ2) = 0.06). We can see that the moderating trait differs according to the mode of communication in the case of HPA. In other words, it is not only the case that traits can moderate the effect of situational aspects (diversity in communication), but also the moderating trait and the direction of the interaction can vary according to the scenario (face-to-face vs phone call). In the context of calls, we found also that diversity, measured by entropy, correlates positively with high negative affect (HNA) for individuals who have low scores in the corresponding trait, while diversity correlates negatively with HNA for people with low scores in HNA trait (MarginalR2= 0.11 and pr(χ2) = 0.03). According to the results, the complete model outperforms the basic model in most cases–as measured byχ2test. Said differently, the additional variance explained by the interaction of the diversity measures and traits is statistically significant in comparison to the models that include the traits only. For more details, checkS1 File.
Discussion
communication, and their personality traits to infer scores of affect states. With such a non-intrusive approach, we were able to delineate the relationship between diversity of social com-munication and subjective well-being.
While network diversity was directly correlated with economic well-being in earlier studies, we found that the association between network diversity and subjective well-being is dependent on individual differences and communication modes. Specifically, we found that diversity of communication is beneficial for certain personality types in some communication types, while it is not beneficial for other personality types. For example, diversity in phone calls is experi-enced as good by introverts, but bad by extroverts; diversity in face-to-face interaction is expe-rienced as good by people who tend to be positive by nature (trait) but bad for people who tend to be not positive by nature. Our findings contribute to the growing literature in social psychol-ogy that focuses on understanding the role of situational factors in the variability of our affect. Also, our findings bring attention to the role of individual differences (personalities) and the necessity of considering them while studying affect dynamics.
Interestingly, our results suggest also that thediversity as inequality(Gini) captures the rela-tionship between diversity in social communication and affect dynamics better than the
diver-sity as uniformity(entropy), in particular in the face-to-face interaction scenario. Further
investigation is required to confirm this result.
Although our study is a pioneer in studying the relationship between affect dynamics and diversity in social communication, the nature of the observational studies from which the data-sets were collected, restricts our conclusions to be correlational rather than causal. The confir-mation of the causality of the results requires conducting controlled experiments in which different interventions should be introduced to different groups of people in order to elicit the causal effect of diversity of social communication.
In this study, we focused only on direct communication: phone calls and face-to-face com-munication. Nowadays, people do not only communicate through these modes, but also use social media and instant messaging heavily. Therefore, it would be interesting to study the rela-tionship between diversity of social communication through these passive types of communi-cation and affect dynamics.
Supporting Information
S1 File. The file contains the following.Sections: 1 Sociometric Badges Dataset, 2 Mobile Ter-ritorial Lab Dataset, 3 Dynamic Social networks, 4 Diversity Measures, 5 Statistical Models, 6 Results. Table 1, Surveys for personality and affect states and traits in the Sociometric Badges study. Tables 2:28, statistical results. Figure 1, Descriptive statistics of the participants in the Sociometric Badges Dataset. Figure 2, Descriptive statistics of the participants in the Mobile Territorial Lab Dataset. Figure 3, The composite social network of participants in the sociomet-ric badges dataset. Figure 4, The composite social network of participants in the MTL dataset. Figure 5, The daily social networks of the participants in the sociometric badges (face to face interaction) for days 1–15. Figure 6, The daily social networks of the participants in the socio-metric badges (face to face interaction) for days 16–30. Figure 7, The daily social networks of the participants in the Living Lab Dataset (mobile phone communication) for days 1–15. Fig-ure 8, The daily social networks of the participants in the Living Lab Dataset (mobile phone communication) for days 16–26. Figure 9, The entropy is plotted against different probabilities of a random variable. The random variable can take only two values (Bernoulli Process). Fig-ure 10, The Gini is plotted against different probabilities of a random variable. The random variable can take only two values (Bernoulli Process).
S1 Datasets. Datasets of face-to-face interactions and mobile phone communication. (RAR)
Author Contributions
Conceived and designed the experiments: BL FP. Performed the experiments: BL FP. Analyzed the data: AA FP IR. Wrote the paper: AA FP BL AP IR. Interpreted the results: AA FP BL AP IR. Carried out data processing: AA.
References
1. Madan A, Cebrian M, Lazer D, Pentland A. Social sensing for epidemiological behavior change. In: Pro-ceedings of the 12th ACM international conference on Ubiquitous computing. ACM; 2010. p. 291–300.
doi:10.1145/1864349.1864394
2. Cohen S, Doyle WJ, Skoner DP, Rabin BS, Gwaltney JM. Social ties and susceptibility to the common cold. Jama. 1997; 277(24):1940–1944.
3. Cohen S, Janicki-Deverts D. Can we improve our physical health by altering our social networks? Per-spectives on Psychological Science. 2009; 4(4):375–378. doi:10.1111/j.1745-6924.2009.01141.x PMID:20161087
4. Putnam RD. E pluribus unum: Diversity and community in the twenty-first century the 2006 Johan Sky-tte Prize Lecture. Scandinavian political studies. 2007; 30(2):137–174. doi:10.1111/j.1467-9477.2007. 00176.x
5. Villalpando O. The impact of diversity and multiculturalism on all students: Findings from a national study. Journal of Student Affairs Research and Practice. 2002; 40(1):124–144. doi:10.2202/1949-6605.1194
6. Granovetter MS. The strength of weak ties. American journal of sociology. 1973;p. 1360–1380. doi:10. 1086/225469
7. Perry-Smith JE. Social yet creative: The role of social relationships in facilitating individual creativity. Academy of Management journal. 2006; 49(1):85–101. doi:10.5465/AMJ.2006.20785503
8. Vaquero LM, Cebrian M. The rich club phenomenon in the classroom. Scientific reports. 2013; 3. doi: 10.1038/srep01174PMID:23378908
9. Sandstrom GM, Dunn EW. Social Interactions and Well-Being The Surprising Power of Weak Ties. Per-sonality and Social Psychology Bulletin. 2014;p. 0146167214529799. doi:10.1177/
0146167214529799PMID:24769739
10. Agneessens F, Waege H, Lievens J. Diversity in social support by role relations: A typology. Social net-works. 2006; 28(4):427–441. doi:10.1016/j.socnet.2005.10.001
11. Miritello G, Moro E, Lara R, Martínez-López R, Belchamber J, Roberts SG, et al. Time as a limited resource: Communication strategy in mobile phone networks. Social Networks. 2013; 35(1):89–95. doi: 10.1016/j.socnet.2013.01.003
12. Eagle N, Macy M, Claxton R. Network diversity and economic development. Science. 2010; 328 (5981):1029–1031. doi:10.1126/science.1186605PMID:20489022
13. Pan W, Aharony N, Pentland A. Fortune monitor or fortune teller: Understanding the connection between interaction patterns and financial status. In: Privacy, Security, Risk and Trust (PASSAT) and 2011 IEEE Third Inernational Conference on Social Computing (SocialCom), 2011 IEEE Third Interna-tional Conference on. IEEE; 2011. p. 200–207. doi:10.1109/PASSAT/SocialCom.2011.163
14. Watson D, Clark LA, Tellegen A. Development and validation of brief measures of positive and negative affect: the PANAS scales. Journal of personality and social psychology. 1988; 54(6):1063. doi:10. 1037/0022-3514.54.6.1063PMID:3397865
15. Diener E, Larsen RJ, Levine S, Emmons RA. Intensity and frequency: dimensions underlying positive and negative affect. Journal of personality and social psychology. 1985; 48(5):1253. doi:10.1037/ 0022-3514.48.5.1253PMID:3998989
16. Russell J. A circumplex of affect. Journal of Personality and Social Psychology. 1980; 36:1152–1168.
17. Lucas, RE, Dyrenforth PS. Does the existence of social relationships matter for subjective well-being? 2006;.
18. Lyubomirsky S, King L, Diener E. The benefits of frequent positive affect: does happiness lead to suc-cess? Psychological bulletin. 2005; 131(6):803. PMID:16351326
20. Clark L, Watson D. Diurnal variation in mood: Interaction with daily events and personality. In: meeting of the American Psychological Association, Washington, DC; 1986.
21. Beiser M. Components and correlates of mental well-being. Journal of Health and Social Behavior. 1974;p. 320–327. doi:10.2307/2137092PMID:4455735
22. Barsade S, Brief AP, Spataro SE, Greenberg J. The affective revolution in organizational behavior: The emergence of a paradigm. Organizational behavior: A management challenge. 2003; 1:3–50.
23. Barsade SG, Gibson DE. Why does affect matter in organizations? The Academy of Management Per-spectives. 2007; 21(1):36–59. doi:10.5465/AMP.2007.24286163
24. Barsade SG, Ward AJ, Turner JD, Sonnenfeld JA. To your heart’s content: A model of affective
diver-sity in top management teams. Administrative Science Quarterly. 2000; 45(4):802–836. doi:10.2307/
2667020
25. Costa PT, McCrae RR. The revised neo personality inventory (neo-pi-r). The SAGE handbook of per-sonality theory and assessment. 2008; 2:179–198.
26. Zelenski JM, Larsen RJ. The distribution of basic emotions in everyday life: A state and trait perspective from experience sampling data. Journal of Research in Personality. 2000; 34(2):178–197. doi:10.
1006/jrpe.1999.2275
27. Tellegen A. Structures of mood and personality and their relevance to assessing anxiety, with an emphasis on self-report. 1985;.
28. Watson D, Clark LA. Negative affectivity: the disposition to experience aversive emotional states. Psy-chological bulletin. 1984; 96(3):465. doi:10.1037/0033-2909.96.3.465PMID:6393179
29. Lepri B, Staiano J, Rigato G, Kalimeri K, Finnerty A, Pianesi F, et al. The sociometric badges corpus: A multilevel behavioral dataset for social behavior in complex organizations. In: Privacy, Security, Risk and Trust (PASSAT), 2012 International Conference on and 2012 International Confernece on Social Computing (SocialCom). IEEE; 2012. p. 623–628.
30. Olguín DO, Waber BN, Kim T, Mohan A, Ara K, Pentland A. Sensible organizations: Technology and methodology for automatically measuring organizational behavior. Systems, Man, and Cybernetics, Part B: Cybernetics, IEEE Transactions on. 2009; 39(1):43–55. doi:10.1109/TSMCB.2008.2006638 31. Gini C. Variabilitàe mutabilità. Reprinted in Memorie di metodologica statistica (Ed Pizetti E, Salvemini
T) Rome: Libreria Eredi Virgilio Veschi. 1912; 1.
32. Yitzhaki S. Relative deprivation and the Gini coefficient. The quarterly journal of economics. 1979;p. 321–324. doi:10.2307/1883197
33. Cattuto C, Van den Broeck W, Barrat A, Colizza V, Pinton JF, Vespignani A. Dynamics of person-to-person interactions from distributed RFID sensor networks. PloS one. 2010; 5(7):e11596. doi:10.1371/ journal.pone.0011596PMID:20657651
34. Stehlé J, Voirin N, Barrat A, Cattuto C, Isella L, Pinton JF,et al. High-resolution measurements of face-to-face contact patterns in a primary school. 2011;.
35. Aharony N, Pan W, Ip C, Khayal I, Pentland A. Social fMRI: Investigating and shaping social mecha-nisms in the real world. Pervasive and Mobile Computing. 2011; 7(6):643–659. doi:10.1016/j.pmcj.
2011.09.004
36. Bernard HR, Killworth PD, Sailer L. Informant accuracy in social-network data V. An experimental attempt to predict actual communication from recall data. Social Science Research. 1982; 11(1):30–66.
doi:10.1016/0049-089X(82)90006-0
37. Lazer D, Pentland AS, Adamic L, Aral S, Barabasi AL, Brewer D, et al. Life in the network: the coming age of computational social science. Science (New York, NY). 2009; 323(5915):721.
38. Csikszentmihalyi M, Hunter J. Happiness in everyday life: The uses of experience sampling. Journal of Happiness Studies. 2003; 4(2):185–199. doi:10.1023/A:1024409732742
39. Thompson ER. Development and validation of an internationally reliable short-form of the positive and negative affect schedule (PANAS). Journal of cross-cultural psychology. 2007; 38(2):227–242. doi:10. 1177/0022022106297301
40. Conner TS, Tennen H, Fleeson W, Barrett LF. Experience sampling methods: A modern idiographic approach to personality research. Social and personality psychology compass. 2009; 3(3):292–313. doi:10.1111/j.1751-9004.2009.00170.xPMID:19898679
41. Csikszentmihalyi M, Larson R. Validity and reliability of the Experience-Sampling Method. The Journal of nervous and mental disease. 1987; 175(9):526–536.
43. Tellegen A, Waller NG. Exploring personality through test construction: Development of the Multidimen-sional Personality Questionnaire. The Sage handbook of personality theory and assessment. 2008; 2:261–292.
44. Eagle N, Pentland AS, Lazer D. Inferring friendship network structure by using mobile phone data. Pro-ceedings of the National Academy of Sciences. 2009; 106(36):15274–15278. doi:10.1073/pnas.
0900282106
45. Lane ND, Miluzzo E, Lu H, Peebles D, Choudhury T, Campbell AT. A survey of mobile phone sensing. Communications Magazine, IEEE. 2010; 48(9):140–150. doi:10.1109/MCOM.2010.5560598
46. Madan A, Cebrian M, Moturu S, Farrahi K, et al. Sensing the“health state”of a community. IEEE Perva-sive Computing. 2012;(4: ):36–45. doi:10.1109/MPRV.2011.79
47. Stopczynski A, Sekara V, Sapiezynski P, Cuttone A, Madsen MM, Larsen JE, et al. Measuring large-scale social networks with high resolution. PloS one. 2014; 9(4):e95978. doi:10.1371/journal.pone. 0095978PMID:24770359
48. Miller G. The smartphone psychology manifesto. Perspectives on Psychological Science. 2012; 7 (3):221–237. doi:10.1177/1745691612441215PMID:26168460
49. Staiano J, Lepri B, Aharony N, Pianesi F, Sebe N, Pentland A. Friends don’t lie: inferring personality
traits from social network structure. In: Proceedings of the 2012 ACM conference on ubiquitous comput-ing. ACM; 2012. p. 321–330.
50. de Montjoye YA, Quoidbach J, Robic F, Pentland AS. Predicting personality using novel mobile phone-based metrics. In: Social computing, behavioral-cultural modeling and prediction. Springer; 2013. p. 48–55.
51. Chittaranjan G, Blom J, Gatica-Perez D. Mining large-scale smartphone data for personality studies. Personal and Ubiquitous Computing. 2013; 17(3):433–450. doi:10.1007/s00779-011-0490-1
52. LiKamWa R, Liu Y, Lane ND, Zhong L. Moodscope: Building a mood sensor from smartphone usage patterns. In: Proceeding of the 11th annual international conference on Mobile systems, applications, and services. ACM; 2013. p. 389–402.
53. Bogomolov A, Lepri B, Ferron M, Pianesi F, Pentland AS. Daily Stress Recognition from Mobile Phone Data, Weather Conditions and Individual Traits. In: Proceedings of the ACM International Conference on Multimedia. ACM; 2014. p. 477–486.
54. Centellegher S, De Nadai M, Caraviello M, Leonardi C, Vescovi M, Ramadian Y, et al. The Mobile Terri-torial Lab: a multilayered and dynamic view on parents’daily lives. EPJ Data Science. 2016; 5(1):1.
doi:10.1140/epjds/s13688-016-0064-6
55. Nakagawa S, Schielzeth H. A general and simple method for obtaining R2 from generalized linear mixed-effects models. Methods in Ecology and Evolution. 2013; 4(2):133–142. doi: 10.1111/j.2041-210x.2012.00261.x
56. Friedkin NE. The attitude-behavior linkage in behavioral cascades. Social Psychology Quarterly. 2010; 73(2):196–213.