DOI: 10.13164/re.2015.0932 APPLICATIONS OF WIRELESS COMMUNICATIONS
Interference Suppression Performance of Automotive
UWB Radars Using Pseudo Random Sequences
Idnin PASYA
1, Hiroshi KATO
2, Takehiko KOBAYASHI
21
Microwave Technology Centre, Faculty of Electrical Engineering, Universiti Teknologi MARA, 40450 Shah Alam, Selangor, Malaysia
2
Wireless Systems Laboratory, Tokyo Denki University, 5-Senju Asahi-Cho, Adachi-ku, Tokyo 120-8551, Japan
[email protected], [email protected]
Abstract. Ultra wideband (UWB) automotive radars have attracted attention from the viewpoint of reducing traffic accidents. The performance of automotive radars may be degraded by interference from nearby radars using the same frequency. In this study, a scenario where two cars pass each other on a road was considered. Considering the utilization of cross-polarization, the desired-to-undesired signal power ratio (DUR) was found to vary approximately from -10 to 30 dB. Different pseudo random sequences were employed for spectrum spreading the different radar signals to mitigate the interference effects. This paper evaluates the interference suppression provided by maxi-mum length sequence (MLS) and Gold sequence (GS) through numerical simulations of the radar’s performance in terms of probability of false alarm and probability of detection. It was found that MLS and GS yielded nearly the same performance when the DUR is -10 dB (worst case); for example when fixing the probability of false alarm to 10-4, the probabilities of detection were 0.964 and 0.946 respectively. The GS are more advantageous than MLS due to larger number of different sequences having the same length in GS than in MLS.
Keywords
UWB, radar, maximum length sequence, Gold sequence, interference suppression, detection probability
1.
Introduction
Ultra wideband (UWB) automotive radars are receiving huge research interests for its potential to be applied as automotive radars that could assists drivers, as well as automated driving applications [1]. In comparison with conventional vehicular sensing system using infra-red, ultra-sound, and millimeter-waves radar, the Ka-band UWB radar systems hold several advantages such as reduced blind-angle [2], high range resolution, robustness to weather conditions, and lower costs than millimeter-wave radars. Nevertheless, if the environment is populated
by cars equipped with independent automotive radars, the performance of each radar will be degraded by interference signals entering their receivers, which are originated from nearby radars operating at the same frequency. The per-formance degradation can be mitigated with the use of cross-polarization and code division multiple access (CDMA) technology [3–5], however, quantitative evalua-tion of interference suppression have not been fully exploited. The authors previously studied the interference rejection capability of automotive radars modulated by maximum length sequence (MLS) codes [6], and derived the basic capability of the method to suppress interference.
In this paper, we further investigated the interference suppression performances of UWB automotive radars modulated by pseudo random sequence using binary MLS, and Gold sequences (GS). Both sequences were selected due to their good auto- and cross-correlation properties, which is significantly useful in suppressing interference from nearby radars. Initially, the desired-to-undesired sig-nal power ratio (DUR) was examined when two cars pass by each other on the opposite side of the road. Suppression of interference was numerically evaluated by calculating the probability of false alarm (Pfa), and the probability of detection (Pd) of the radar for the estimated DUR. Impor-tant characteristics of both sequence which is related to the automotive radar system design was also discussed, such as the order of shift register, code length, number of available sequence, and auto- and cross-correlation properties.
2.
Calculation of Desired-to-Undesired
Signal Power Ratio
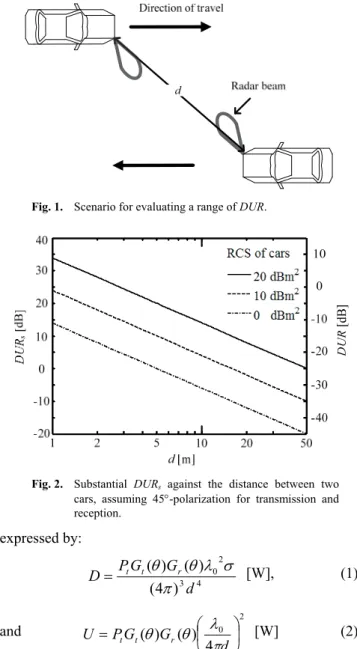
Fig. 1. Scenario for evaluating a range of DUR.
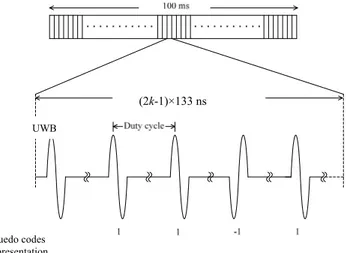
Fig. 2. Substantial DURs against the distance between two
cars, assuming 45-polarization for transmission and reception.
expressed by:
4 3
2 0 ) 4 (
) ( ) (
d G G P
D t t r
[W], (1)
and
2 0 4 ) ( )
(
d G
G P
U t t r
[W] (2)
where Pt is the transmitting power, Gt the antenna gain for transmission and reception, Gr the azimuth angle from the antenna boresight, the wavelength and the radar cross section (RCS) of targets, and d the distance between the two cars. Therefore, the DUR is expressed by
2
4 log 10 log
10
d U
D DUR
[dB]. (3)
Here, we could understand from (3) that the DUR is inde-pendent of Pt, Gt(), Gr(), and when the two radars trans-mit the same power and use the same antennas. Equations (1) to (3) were derived based on free space (FS) model consideration. This is based on calculations of first Fresnel zone radius (refer Appendix) and assumptions that the directivity of antenna beam was optimized for vehicular applications. Furthermore, UWB two-ray propagation model reported in [7] indicated that frequency diversity effects reduced the fading depth from two-ray interference for the case of UWB, approximating the case of FS propa-gation. Hence, we considered the FS model in this study.
The RCS of a typical passenger car ranges from 2 to 20 dBm2 [2], and d varies from 1 to 20 m, considering the lane widths of roads range from 2.8 to 3.5 m. It is impor-tant to note that we used a simplified assumption of UWB RCS based on investigation in [2]. Precise estimation of UWB RCS for cars may require considerations of antenna height and wavelength, however, the authors limit the scope of the paper to evaluating the radar performance, and will address the mentioned problem in a separate work.
If the two radars utilize vertical and horizontal polari-zation, the DUR lies between -35 and 9 dB. Since the DUR of -35 dB (when = 2 dBm2 and d = 20 m) is too low to discriminate between the desired and undesired signals, we further assume that the radars use 45-inclined linear po-larization. In this case, the desired signal is received in 45 polarization, while the undesired signal in –45 polariza-tion. Here, assuming the cross polarization discrimination of the antennas to be XPD dB, the substantial DUR (DURs) is therefore enhanced by
XPD DUR
DURs . (4)
Here, we consider the typical XPD of linear polarized an-tennas such as slot and microstrip patches exceeds 25 dB. Therefore, the DURs ranges approximately from -10 to 34 dB. The plot of DURs against distance d is shown in Fig. 2.
3.
Simulation Setup
3.1
Pulse Trains Modulated with Maximum
Length- or Gold-Sequences
The UWB radar under consideration transmits a series of UWB pulses which is modulated by pseudo random sequence consisting of binary phase shift keying (BPSK) codes with either MLS or GS. The pulse waveform can be arbitrarily selected to comply with UWB spectrum mask specified by regulatory bodies. When the radar is using pulses with duty cycle d = 133 ns, for example, the detec-tion range R = cd/2 = 20 m, where c is the electromagnetic wave velocity. The time interval for alarming the driver was set to be 100 ms, considering normal human reaction time [8]. During this 100 ms, the radar is capable to trans-mit 750,000 pulses (= 100 ms / 133 ns).
Fig. 3. Example of a BPSK-modulated pulse train with an MLS.
Order of MLS code, k MLS feedback
taps (MLS1)
MLS feedback taps (MLS2)
7 (3, 7) (1, 2, 3, 7)
9 (4, 9) (3, 4, 6, 9)
11 (2, 5, 8, 11) (2, 3, 10, 11)
13 (1, 3, 4, 13) (4, 5, 7, 9, 10, 13)
Tab. 1. Selected MLS feedback taps to generate preferred pairs of MLS.
each radar, as listed in Tab. 1. The total number N of the preferred pairs of MLSs, however, is limited: e.g. N = 6, 2, 4, and 4 when k = 7, 9, 11, and 13, respectively. An MLS yields a two-level autocorrelation function:
. 0 if 1 0 if 1 2 ) (
k (5)
and a preferred pair of MLSs possesses a relatively low level cross correlation function. On the other hand, GSs possess no particular preferred pairs. GSs possess (2k – 1) different sequences. GSs provide relatively low three-level cross correlation function (2(k+1)/2 – 1, –1, and –2(k+1)/2 – 1). The autocorrelation function of the GSs of a length of k is given by
1 2 or , 1 , 1 2 either 1 2 ) ( 2 / ) 1 ( 2 / ) 1 (k k k . 0 if 0 if (6)
The larger fluctuating () (when ≠ 0) is a drawback of the GSs. Accordingly, auto correlation and cross correla-tion of GS is slightly inferior to it of MLS. However, GS possess far more different sequences. Therefore, utilization of GS can suppress interference from multiple other radars. On the other hand, in either case of random sequence, the selection of k and feedback taps should be negotiated among the cars beforehand, for instance, via an inter-vehi-cle communication link. The design of physical layer and communication protocol for this purpose is not studied within this paper, since it is outside the scope of the present study.
3.2
Simulation Structure
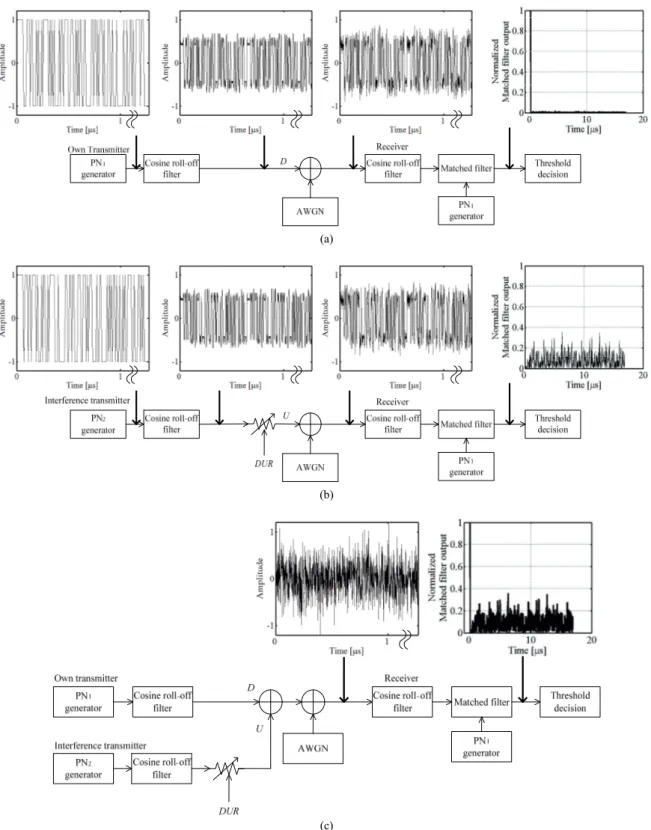
A series of numerical simulation was carried out to evaluate the probability of false alarm (Pfa) and probability of detection (Pd) of the UWB radar system. Signal flow diagrams and representative waveforms are presented in Fig. 4. Figure 4(a) depicts a case that the receiver receives the desired signal alone, generated from a unique code designated by either MLS1 or GS1. Additive white Gaus-sian noise (AWGN) was injected into the signal at the receiver input port. Signal-to-noise power ratio (SNR) was fixed at 10 dB. For the sake of presentation clarity, the matched filter output was normalized by the maximum value of auto-correlation function (2k – 1 for a k-stage MLS and GS), as shown in Fig. 4(a). Figure 4(b) depicted the case where the undesired signal U alone entered the receiver, in which Pfa was calculated by varying the DUR and threshold level. Figure 4(c) represents the signal flow and the waveforms when both the desired and undesired signals co-exist within the same channel. The Pd was cal-culated under the presence of undesired signal U in the system, when Pfa was fixed 10-2 or 10-4 for DUR between –10 to 30 dB, and the length of sequences L = 127, 511, 2047, 8191 (corresponding to k = 7, 9, 11, and 13, respec-tively). The maximum antenna gain, obtained from product of transmission and reception was assumed to be 11 dBi, and the half-power beamwidth is 60 (common value for typical slot antennas).
The simulation was carried out based on the following conditions:
Matched filter output was normalized by the maxi-mum value of autocorrelation function in Fig. 4(a).
The same normalization was applied to the matched filter output in Figs. 4(b) and (c).
The Pfa was calculated by varying DUR and the threshold level in Fig. 4(b).
The Pd was calculated when Pfa was fixed at 10-2 or 10-4.
4.
Simulation Results
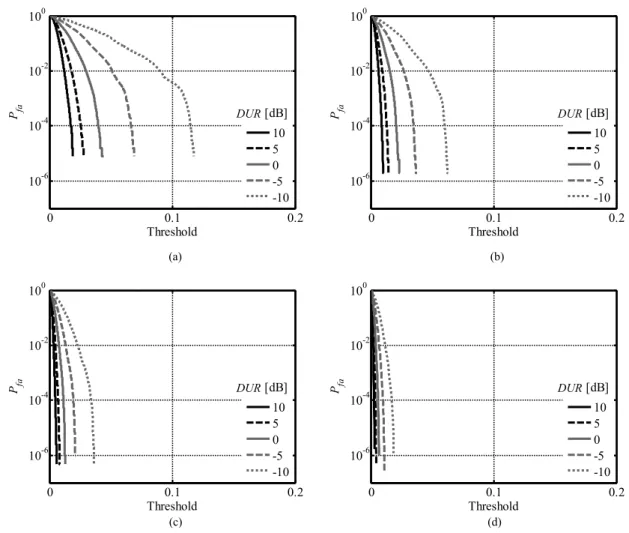
First, the false alarm probability Pfa was calculated when no target is present in the system, and the receiver receives only the undesired signal U generated by MLS2 or GS2 from the interfering radar. The matched filter output in Fig. 4(a) was normalized for a certain level of the de-sired signal D by the maximum value (2k – 1) of auto-cor-relation function of MLS1 and GS1. Similarly, the matched filter output in Fig. 4(b) was normalized in a similar man-ner, where the U was varied at a ratio between –30 to 10 dB (–10 DUR [dB] 30) to the desired signal level D. The calculated Pfa for L = 127, 511, 2047, 8191 (corre-sponding to k = 7, 9, 11, and 13, respectively), are plotted (2k-1)×133 ns
(a)
(b)
(c)
Fig. 4. Block diagrams and simulated waveforms used in the study. The receiver receives: (a) the desired signal from host vehicle radar transmitter, (b) the undesired signal from the other radar transmitter, or (c) the desired and the undesired signals simultaneously.
in Figs. 5 and 6 between –10 DUR 10 dB. It can be observed from the figure that higher DUR contributes to decrease in Pfa yielding the same threshold level. It was also found that larger k results in the lower threshold level yielding the same Pfa. The Pfa was almost the same when comparing MLS and GS. It is considered that an effect of low three-level cross correlation was lost because AWGN was super-imposed to the signal at the receiver input.
0 0.1 0.2 10-6
10-4 10-2 100
Threshold
Pfa
10 5 0 -5 -10
DUR [dB]
0 0.1 0.2
10-6 10-4 10-2 100
Threshold
Pfa
10 5 0 -5 -10
DUR [dB]
(a) (b)
0 0.1 0.2
10-6 10-4 10-2 100
Threshold
Pfa
10 5 0 -5 -10
DUR [dB]
0 0.1 0.2
10-6 10-4 10-2 100
Threshold
Pfa
10 5 0 -5 -10
DUR [dB]
(c) (d)
Fig. 5. Simulated false alarm probability: length of MLS = (a) 127, (b) 511, (c) 2047, and (d) 8191.
21, 27, 33, and 39 dB for L = 127, 511, 2047, 8191, re-spectively. This is because the maximum values of auto-correlation function of MLS are 127 (21 dB), 511 (27 dB), 2047 (33 dB), and 8191 (39 dB) for L = 127, 511, 2047, 8191, respectively. Addition of the order of MLS stages k by 2 induced approximately 5 dB reduction of DUR yielding the same level of Pd.
Improvements relative to no use of GS were ap-proximately 23, 27, 33, and 40 dB for L = 127, 511, 2047, 8191, respectively, as plotted in Fig. 8. Similar to the case of MLS, improvement of approximately 5 dB of Pd was observed by increasing the length of the GS codes. Fig-ure 9 compares both the Pd of MLS and GS. The detection
DUR[dB] Pfa MLS GS
30 10
-2
10-4
0.999 0.999
0.999 0.999
10 10
-2
10-4
0.995 0.993
0.995 0.993
-10 10
-2
10-4
0.963 0.946
0.963 0.945
Tab. 2. Typical detection probability: length of MLS and GS = 8191.
probabilities were found almost the same for MLS and GS, the former of which yielded slightly higher performances, as typically summarized in Tab. 2. The performance im-provement marked by usage of GS was larger when the DUR was smaller (for example DUR = –10 dB). This fact is in parallel with the previous studies of comparisons between MLS and GS in bit error rate and peak-to-noise ratio in the fields of spread spectrum communication [9] and radar [10], respectively.
5.
Conclusion
either MLS or GS to suppress interference from the radar of the other passing car. Allocation of different MLSs and GSs to different radars facilitates the suppression of inter-ference from other radars. Threshold level was determined to yield false alarm rates of either at 10-2 or 10-4 (caused by interference from the other radar) when no return signal was received from its own radar transmitter. The employ-ment of MLS or GS to modulate the radar pulse train re-sulted in significant improvement in detection probability. Improvements relative to no use of MLS were
approxi-mately 21, 27, 33, and 39 dB for L = 127, 511, 2047, 8191, respectively. Improvements relative to no use of GS were approximately 23, 27, 33, and 40 dB for L = 127, 511, 2047, 8191, respectively. The detection probabilities were found almost the same between MLS and GS. These results show that GS is comparable to MLS when applied to the sprespectrum vehicular radars, however it is more ad-vantageous considering the larger number of available sequences. Both MLS and GS marked improvements of Pd with increasing code length.
0 0.1 0.2
10-6 10-4 10-2 100
Threshold
P
fa
10 5 0 -5 -10
DUR [dB]
0 0.1 0.2
10-6 10-4 10-2 100
Threshold
P
fa
10 5 0 -5 -10
DUR [dB]
(a) (b)
0 0.1 0.2
10-6 10-4 10-2 100
Threshold
Pfa
10 5 0 -5 -10
DUR [dB]
0 0.1 0.2
10-6 10-4 10-2 100
Threshold
Pfa
10 5 0 -5 -10
DUR [dB]
(c) (d)
Fig. 6. Simulated false alarm probability: length of GS = (a) 127, (b) 511, (c) 2047, and (d) 8191.
-10 0 10 20 30
0.6 0.7 0.8 0.9 1
DUR [dB]
Pd
L = 127
L = 511
L = 2047
L = 8191 without MLS Length of MLS
-10 0 10 20 30
0.6 0.7 0.8 0.9 1
DUR [dB]
Pd
L = 127
L = 511
L = 2047
L = 8191 without MLS Length of MLS
(a) (b)
-10 0 10 20 30 0.6
0.7 0.8 0.9 1
DUR [dB]
Pd
L = 127
L = 511
L = 2047
L = 8191 without GS Length of GS
-10 0 10 20 30
0.6 0.7 0.8 0.9 1
DUR [dB]
Pd
L = 127
L = 511
L = 2047
L = 8191 without GS Length of GS
(a) (b)
Fig. 8. Simulated detection probability of GS: when Pfa = (a) 10-2 and (b) 10-4.
-10 0 10 20 30
0.6 0.7 0.8 0.9 1
DUR [dB]
Pd
MLS, L = 8191 GS, L = 8191 MLS, L = 2047 GS, L = 2047 MLS, L = 511 GS, L = 511 MLS, L = 127 GS, L = 127
-10 0 10 20 30
0.6 0.7 0.8 0.9 1
DUR [dB]
Pd
MLS, L = 8191 GS, L = 8191 MLS, L = 2047 GS, L = 2047 MLS, L = 511 GS, L = 511 MLS, L = 127 GS, L = 127
(a) (b)
Fig. 9. Comparison of Pd between MLS and GS: when Pfa = (a) 10-2 and (b) 10-4.
Appendix
The first Fresnel zone radius when operating the UWB radar at 25 GHz of center frequency. The nth-Fresnel zone radius can be calculated using the following equation,
2 1
2 1
d d
d d n
Fn
(7)
where d1 and d2 is the distance from the transmitting and receiving antennas to the center of the Fresnel zone, is the wavelength, and n is the index number for the nth -Fres-nel zone radius. Assuming the distance 10 m, d1 and d2 are both 5 m. Centre frequency of 25 GHz gives us = 12 mm, hence, F1 = 0.17 m. The transmitting and receiving anten-nas heights of 0.5 m are sufficient for the system to exclude a destructive reflected wave from the ground that could reduce the receiving power.
References
[1] GRESHAM, I., JENKINS, A., EGRI, R., et al. Ultra-wideband radar sensor for short-range vehicular applications. IEEE
Transactions on Microwave Theory and Techniques, 2004, vol. 52, no. 9, p. 2105–2120. DOI: 10.1109/TMTT.2004.834185
[2] KOBAYASHI, T., TAKAHASHI, N., YOSHIKAWA, M., et al. Measurement of automobile UWB radar cross sections at Ka band. In Ultra-Wideband, Short-Pulse Electromagnetics 7, New York (United States), Springer, 2007, p. 586–592. ISBN: 978-0-387-37728-5
[3] GAMBI, E., SPINSANTE, S. Chaos-based radars for automotive applications: theoretical issues and numerical simulation. IEEE Transactions on Vehicular Technology, Nov. 2008, vol. 57, no. 6, p. 3858–3863. DOI: 10.1109/TVT.2008.921632
[4] WEI, Y., LIU, L., ZHANG, J. Blind estimation of PN sequence of DS-CDMA signal in multipath. In Proceedings of the 2nd Interna-tional Conference on Communications and Networks. Yichang (China), 2012, p. 1695–1699. DOI: 10.1109/CECNet.2012. 6201645
[5] FISH, A., GUREVICH, S. Performance estimates of the pseudo-random method for radar detection. In Proceedings of the 2014 IEEE International Symposium of Information Theory. Honolulu (United States), 2014, p. 3102–3106, DOI: 10.1109/ISIT.2014. 6875405
[6] KATO, H., KOBAYASHI, T. Detection probability of automotive radars using maximum length sequences to suppress interference from nearby radars. In Proceedings of the IEEE International Aerospace and Electronics Conference. Dayton (United States), 2014, p. 396–400. DOI: 10.1109/NAECON.2014.7045843
wideband signals in line-of-sight environments. In Proceedings of the 2004 IEEE Eighth International Symposium on Spread Spectrum Techniques and Applications. Sydney (Australia), 2004, p. 488–492. DOI: 10.1109/ISSSTA.2004.1371748
[8] KARL, I., BERG, G., RUGER, F., et al. Driving behavior and simulator sickness while driving the vehicle in the loop: validation of longitudinal driving behavior. IEEE Intelligent Transportation Systems Magazine, 2013, vol. 5, no. 1, p. 42–57, ISSN: 1939-1390. DOI: 10.1109/MITS.2012.2217995
[9] CHEN, X. H., LANG, T., OKSMAN, J. Multiple chip-rate DS/CDMA system and its spreading code dependent performance analysis. IEE Proceedings- Communication, 1998, vol. 145, no. 5, p. 371–377. DOI: 10.1049/ip-com:19982289
[10] YANG, C., LI, W., ZENG, Y., et al. Impulse response measure-ments using Gold sequences. In Proceedings of the2006 8th Inter-national Conference on Signal Processing. Beijing (China), 2006, p. 1–4. DOI: 10.1109/ICOSP.2006.346070
About the Authors …
Idnin PASYA became a Member of IEEE in 2010. He received the B.E. and M.E. degrees in Information and Communication Engineering from Tokyo Denki University in 2004 and 2006, respectively, and his Ph.D. degree in Information, Communication and Media Design Engi-neering from Tokyo Denki University in 2015. He worked as an engineer in Toshiba PC & Network, Tokyo, Japan, from 2006 to 2009. He is currently a senior lecturer in the Faculty of Electrical Engineering, Universiti Teknologi MARA, Malaysia. His research interests include evaluation
of ultra wideband communication systems, MIMO radar and its applications. Dr. Idnin received the IEEE MTT Best Paper Award in 2014 IEEE Radio and Wireless Symposium.
Hiroshi KATO received his B.E. and M.E. degrees from Tokyo Denki University in 2013 and 2015, respectively. He currently works as an engineer in NEC Communica-tions Systems, Japan. His research interests include UWB automotive radars and signal processing.