UNIVERSIDADE DE LISBOA
FACULDADE DE CIÊNCIAS
Departamento de Física
Study of the Interactions of Surface-Modified Particles with
Membrane Model Systems
Mestrado Integrado em Engenharia Biomédica e Biofísica
Perfil em Engenharia Clínica e Instrumentação Médica
Melissa Margarete Jessen Sirage
Dissertação orientada por:
Professor Doutor Hugo Alexandre Ferreira
Doutora Liana C. Silva
i
Acknowledgements
The realization of this master thesis was only possible under strong teamwork and individual dedication. At the end of this journey, there are some people I want to express my gratefulness.
First of all, I want to thank to Professor Hugo Alexandre Ferreira his supervision and support. A great thank to my supervisor Doctor Liana C. Silva for all the support and supervision. Her precious meetings of discussion of results and all exigencies during the writing of this master thesis was of extreme importance.
Thanks to Professor Helena Florindo for accepting me in IntraCell_ADD group. Thanks for all the advices and supervision on the work done in microparticles. Thanks also for reviewing my master thesis.
I am grateful to all my colleagues for teaching, advice and guidance during laboratory work. Thanks a lot to João Oliveira Conniot, Carina Peres, Joana Silva and Eva Zupančič for accompanying me on my first steps on the laboratory formulating microparticles. A very special thanks goes to Ana Varela, Ester Ventura, Ana Carreira and also Andreia Giro dos Santos for supporting me during the confocal experiments and vesicles’ formulation. Overall, thanks to all my colleagues for making IntraCell_ADD a lovely special group to work with!
Thanks to Ana Matos for the strong friendship, advices and gaiety. I am very greatful for all your advice.
A very special thanks to my lovely and exceptional family: parents, brothers, sister and sister in law. Thanks for all your unconditional support, all love and for teaching me and inspiring me so much. Thank you, thank you, thank you!!!
An extra special thanks to Fábio Mogas for all love, unconditional support and for helping me untangle when all seems complicate.
This master thesis marks the end of my Biomedical and Biophysics Engineering course. So I want to thank to all my wonderful colleagues from the course that at the same time became friends for live. Many thanks to Marina Costa, Neuza Silva, Carolina Vale, Gil Braz, André Girão, Mariana Trincão, Tiago João Ferro and Andreia Cândido e Silva. Mainly without all of you, these six years of faculty wouldn’t represent Anos Dourados to me.
ii
Abstract
The complexity of cell membranes and the development of nano/micro drug delivery systems make the topic of interactions between these two structures challenging. Studies point that the surface properties of these carriers like size, surface charge, shape and hydrophobicity largely influence such interactions. This project aims to study the interactions of surface modified Poly(lactic-co-glycolic acid) (PLGA) Microparticles (MPs) with Giant Unilamellar Vesicles (GUVs).
MPs were formulated by the double emulsion solvent evaporation method and surface modified using chitosan (CH) and alginate (ALG) in order to manipulate the surface charge. Five concentrations of coumarin-6 (0.04, 0.10, 0.20, 0.40 and 1.00 g/mg) were entrapped into the PLGA matrix, after formulation optimization without probe. Phisichochemical characterization of MPs was made in terms of size, surface charge, coumarin-6 loading and morphology. Spectral properties of coumarin-6 were analyzed by fluorescence spectroscopy with the five different probe concentrations and five concentrations of MPs in suspension (0.10, 0.20, 0.25, 0.40, and 0.50 mg/mL). GUVs with different lipid composition and membrane properties, namely, homogeneously fluid GUVs and GUVs displaying gel-fluid and lo-ld phase separation were produced. Confocal microscopy was used to
monitor the possible interactions between coumarin-6-loaded PLGA MPs and GUVs.
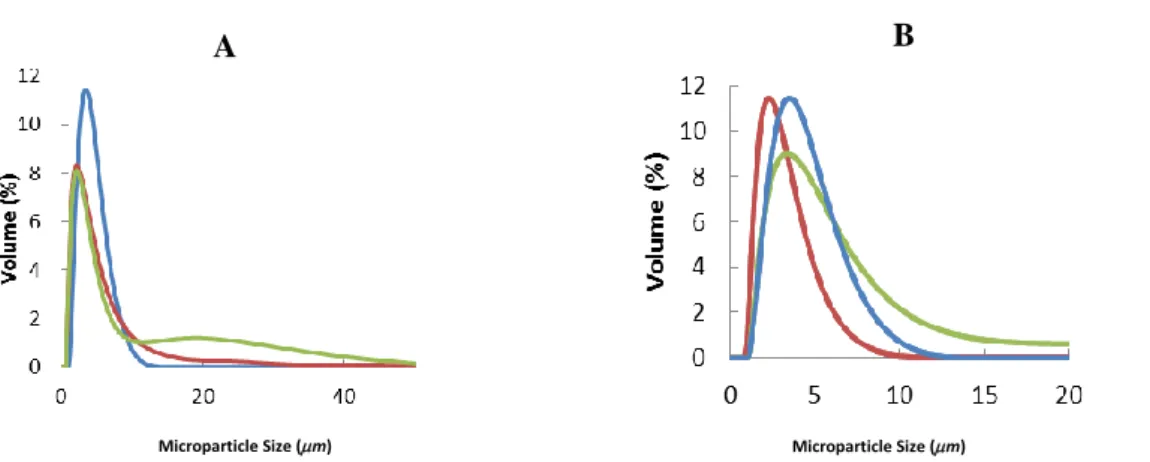
MPs size (D50%) of non-fluorescent and fluorescent coumarin-6-loaded PLGA MPs ranged between
1.4±0.3 to 3.8±0.2 µm. The span values ranged between 1.1±0.2 to 4.8±1.1, demonstrating polidisperse populations. The surface modification did not demonstrate a statistically significant impact on the D50% values. In addition, the presence of coumarin-6 did not demonstrate a statistically
significant impact on the D50% values, except for PLGA ALG MPs loaded with 0.4 and 1.0 μg/mL of
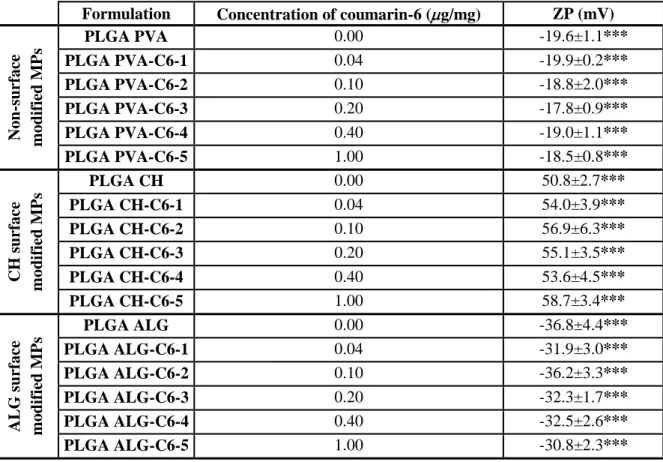
coumarin-6 (p < 0.01). As expected, the surface modification produced a statistically significant impact on the surface charge (p < 0.001). Negative surface charges were displayed for non-fluorescent and fluorescent PLGA PVA MPs (-17.8±0.9 to -19.9±0.2 mV) and for non-fluorescent and fluorescent PLG ALG MPs (-30.8±2.3 to -36.8±4.4 mV). PLGA MPs containing CH PLGA showed a highly positive surface charge (50.8±2.7 and 58.7±3.4 mV). The presence of coumarin-6 did not demonstrate statistically significant impact on surface charge.
Spectral studies showed that once increasing the MPs concentration in suspension no spectral changes were detected, suggesting that coumarin-6 did not change the partition environment to the surface and so remains on the hydrophobic matrix. In addition, this observation was further supported by the mainly linear variation of fluorescence intensity maximum upon increasing the concentration of the coumarin-6-loaded PLGA-C6 MPs, independently of their surface modification. At coumarin-6 concentrations above 0.2 g/mg, the increase of the non-encapsulated molecules localized in the surface of the MPs or even aqueous medium was mainly evidenced by the decrease of anisotropy values. Regardless of MP composition, the red shift in probe emition of an aproximately 15 nm once increasing probe concentration from 0.04 to 1.00 g/mg also account that observation.
Studies on the MPs-membranes interaction studies were performed under the following experimental conditions: i) concentration of coumarin-6 0.2 g/mg and ii) MPs concentration 0.25 mg/mL. Data showed that highly positive PLGA CH-C6-3 MPs and highly negative PLGA ALG-C6-3 MPs interacted with GUVs and were mainly directed to the gel phase and interface of fluid-gel phases.
Results show that the MP surface modification plays an important role on surface charge. Entrapment of the fluorescent dye coumarin-6 conducts to a probe/MPs stable system. It was
iii demonstrated that surface charge and biophysical membrane behaviour are important on interactions of surface modified MPs and GUVs.
Keywords: Poly(lactic-co-glycolic acid) micoparticles, coumarin-6, surface charge, giant unilamelar
iv
Resumo
Os avanços feitos na área do transporte de agentes terapêuticos têm-se focado no desenvolvimento de sistemas à escala nano/micrométrica. Uma das vantagens desses sistemas promissores prende-se com a sua específicidade e eficiência na entrega do agente terapêutico à célula, tecido ou órgão alvo, permitindo a manutenção da concentração terapêutica desejada durante o tempo requerido. Deste modo, a quantidade de agente terapêutico no alvo será apenas a necessária e os efeitos secundários serão mínimos. Por outro lado, os estudos das membranas biológicas e dos sistemas modelo de membrana têm demonstrado que a membrana celular não é uma mera barreira entre o meio extra e intracelular. Na verdade, as evidências apontam para uma grande complexidade das membranas celulares, tanto ao nível da sua compartimentação estrutural e funcional bem como no papel activo dos lípidos na manutenção do equilíbrio celular. É na junção destes dois contextos – membranas celulares e sistemas de entrega à escala nano/micrométrica – que o tópico das interacções entre estes dois sistemas se torna tão desafiante e de grande interesse biológico.
Os estudos nesta área apontam que as características superficiais de nano/micro sistemas impactam significativamente as interacções entre estes dois sistemas. Características como tamanho, carga superficial, forma e hidrofobicidade de nano/micro sistemas parecem estar na base do mecanismo de interacção. Além do mais, alguns estudos apontam que aquando da interacção, estes nano e micro vectores podem interferir com a sinalização celular, induzir danos estruturais, alterar a expressão génica bem como modificar as características biofísicas das membranas celulares. No entanto, diversos estudos têm também demonstrado resultados contraditórios sobre quais dos factores primeiramente influenciam a interacção de nano/micro partículas. De facto, esta dependência pode também estar relacionada com o tipo de célula. Porém, o tópico das interacções ainda continua pouco estudado. A percepção clara dos factores que determinam o sucesso da interacção bem como do efeito imediato produzido na membrana celular irão permitir um desenho preciso destes sistemas de entrega de medicamentos. Além do mais, também irão possibilitar a modulação com melhor precisão do sucesso terapêutico e diminuir efeitos indesejáveis, como toxicidade. Assim, o objectivo deste projecto é desenvolver micropartículas (MPs) poliméricas modificadas à superfície para o estudo das interacções com sistema de modelo membranares.
O poli(ácido láctico-co-glicólico) (PLGA) foi usado como matriz polimérica das MPs. Estas foram formuladas usando o método modificado de dupla emulsão por evaporação do solvente. A superfície destas MPs foi modificada usando ácido polivinílico (PVA), quitosano (CH) e alginato (ALG), para que se obtivessem partículas com carga superficial neutra, positiva e negativa, respetivamente. A composição e processo de produção das MPs foram optimizados de forma a obter características físico-químicas desejadas, nomeadamente span (medida da dispersão das populações) menor que 1. Posteriormente, as MPs foram marcadas com a sonda fluorescente cumarina-6. Esta sonda foi encapsulada na matriz polimérica usando cinco concentrações de cumarina-6: 0.01, 0.10, 0.20, 0.40 e 1.00 µg/mg (µg/mg expressa a concentração de coumarina-6/polímero). Assim, as PLGA MPs não fluorescentes e fluorescentes foram caracterizadas tendo em conta o seu tamanho, carga superficial, forma, eficiência de encapsulação, capacidade de carga e características espectrais através de Difracção Laser, Dispersão Electroforética da Luz, Espectroscopia de Absorção e Microscopia Confocal (respectivamente).
De forma estudar a estabilidade e localização da sonda na matriz, foram preparadas cinco concentrações de MPs em suspensão: 0.10, 0.20, 0.25, 0.40, and 0.50 mg/mL. O estudo espectral, através de Espectroscopia de Fluorescência, permitiu também a optimização das condições
v experimentais (em termos de concentração de cumarina-6 e de concentração de MPs em suspensão) da última etapa do projecto. Para o efeito, foram adquiridos espectros de emissão/excitação e os valores de anisotropia de fluorescência em estado estacionário foram medidos. Posteriormente, Vesículas Gigantes Unilamelares (GUVs) contendo diferentes composições lipídicas e propriedades biofísicas foram preparadas por electroformação e marcadas com rodamina. Assim, foram preparadas GUVs homogeneamente fluídas (POPC), GUVs com separação de fases gel-fluído (POPC/DPPC 1:1 mol/mol) e separação de fases líquido ordenado–líquido desordenado (POPC/SM/Chol 1:1:1 mol/mol/mol). Finalmente, para o estudo das interacções recorreu-se a microscopia confocal.
Os resultados demonstraram que as PLGA MPs não fluorescentes e fluorescentes têm diâmetros médios D50% entre 1.4±0.3 e 3.8±0.2 m. A presença da cumarina-6 não produziu diferenças
estatisticamente significativas, excepto para PLGA ALG MPs carregadas com 0.4 and 1.0 μg/ml de cumarin-6 (p < 0.01). Os valores de span variaram entre 1.1±0.2 e 4.8±1.1, o que demonstra heterogeneidade. Os resultados de carga superficial (medida pelo valor de ZP) variaram significativamente com a modificação à superfície (p < 0.001). Tanto para MPs fluorescentes como para não fluorescentes, a carga superficial situou-se nos intervalos de [(-17.8±0.9)-(-19.9±0.2)] mV, [50.8±2.7-58.7±3.4] mV e [(-30.8±2.3)- (-36.8±4.4)] mV para MPs modificadas com PVA, CH e ALG, respectivamente. A introdução da sonda não produziu alterações significativas nos valores de ZP. A caracterização morfológica revelou que as MPs são esféricas, podendo adoptar, nalguns casos, forma de foice (indicador de instabilidade). A caracterização espectral de cumarina-6 demonstrou que os comprimentos de onda de excitação/emissão máximos (ex max e em max) não variam
significativamente com a concentração de suspensão de MPs e com o surfactante usado na formulação. Do mesmo modo, à medida que a concentração de MPs na suspensão aumenta, a intensidade máxima de fluorescência (F.I.) aumenta de maneira aproximadamente linear. Estes resultados demonstram que a sonda está essencialmente localizada na matriz polimérica e, deste modo, a sua partição entre o ambiente polimérico hidrofóbico e o ambiente hidrofílico que a rodeia, não é alterada. No entanto, com o aumento da concentração de cumarina-6 observou-se, no espectro de emissão da sonda, um ligeiro desvio de 15 nm para o vermelho. Os resultados das medidas de anisotropia mostram que para concentrações de sonda abaixo de 0.2 m/mg, os valores são de aproximadamente 0.35, decrescendo para valores de 0.15, quando a concentração de sonda aumenta de 0.2 m/mg para 1.00 m/mg. A alteração dos valores de anisotropia e de desvio no espectro de emissão observado sugerem que, para altas concentrações, houve um aumento de moléculas não encapsuladas localizadas na superfície das MPs ou até mesmo na água. Tendo em conta o estudo espectral, a combinação de concentração de sonda/concentração de suspensão escolhida foi de [0.2
µg/mg; 0.25 mg/ml], pois representaram os valores medianos e os parâmetros analisados variarem
linearmente. Além do mais, nessa concentração as imagens microscópicas adquiridas não teriam demasiada fluorescência.
Os sistemas de modelo membranares, GUVs, foram preparados com sucesso. As GUVs compostas por POPC apresentaram uma distribuição homogénea de Rodamina-DOPE (1,2-Dioleoil-sn-glicero-3-fosfaetanolamina-N-(lissamina rodamina B Sulfonil), demonstrando a sua fluidez. Por outro lado, as vesículas compostas de POPC/DPPC (1:1 mol/mol) apresentaram separação de fases gel-fluído. A mistura ternária POPC/SM/Chol (1:1:1 mol/mol/mol) mostrou separação de fases fluído-fluído. No entanto, nalgumas POPC/SM/Chol (1:1:1 mol/mol/mol) GUVs, também se verificou a separação de fases gel-fluído. Finalmente, os estudos das interacções demonstraram nenhuma aproximação às vesículas homogeneamente fluidas. As observações feitas demonstraram que apenas as PLGA MPs marcadas com sonda com carga superficial altamente positivas e negativas interagiram com as GUVs compostas por POPC/DPPC (1:1 mol/mol), na fase gel e interface das fases gel-fluído.
vi Resultados semelhantes foram obtidos com a mistura de POPC/SM/Chol, na qual as PLGA MPs modificadas com CH direccionaram-se para a fase líquida-ordenada.
Os resultados descritos mostram que o tipo de surfactante usado produz uma clara distinção de carga superficial. A sonda cumarina-6 demonstrou ser adequada para marcação deste tipo de MPs pois a sua encapsulação permitiu a produção de um sistema sonda/MPs estável. Os estudos de interacção revelaram que a carga superficial das MPs e fase biofísica das GUVs determinam as interacções entre estes sistemas.
Palavras-chave: Micropartículas ácido poli(láctico-co-glicólico), cumarina-6, carga superficial,
vii
Table of Contents
Acknowledgements ... i
Abstract ... ii
Resumo ... iv
Table of Contents ... vii
List of Figures ... ix
List of Acronyms ... xv
CHAPTER 1: Introduction ... 1
CHAPTER 2: Literature Review ... 3
2.1 Drug Delivery Systems – Micro and Nano Systems ... 3
2.1.1 Polymeric Microparticles ... 3
2.1.1.1 PLGA Microparticles ... 4
2.1.1.2 Surface modification of PLGA Microparticles ... 6
2.1.2 Impact of Physicochemical Surface Properties of Nano and Micro Systems in Cellular Uptake – size, surface charge, shape and chemistry ... 8
2.2 Biomembranes – structure and importance ... 10
2.2.1 Historical Perspective ... 11
2.2.2 Types of Biomembrane Lipids ... 13
2.2.3 Membrane Lipid Phases ... 14
2.2.4 Membrane Lipid Domains ... 16
2.2.5 Membrane Model Systems ... 17
CHAPTER 3: Aims ... 19
CHAPTER 4: Materials and Methods ... 20
4.1 Materials ... 20
4.2 Methods ... 20
4.2.1 Lipids and probe stock solutions ... 20
4.2.2 Surface-modified MPs preparation ... 20
4.2.3 Physicochemical Characterization of the surface-modified microparticles ... 22
4.2.3.1Microparticle size and ZP analyses ... 22
4.2.3.2Confocal Microscopy ... 22
4.2.3.3Coumarin-6 loading analysis ... 22
4.2.3.4Statistical Analysis ... 23
4.2.4 Spectral characterization of coumarin-6 ... 23
viii
4.2.6 Impact of the surface properties in the interaction between surface-modified
microparticles and giant unilamellar vesicles ... 24
CHAPTER 5: Results25 5.1 Characterization of the surface-modified MPs ... 25
5.2 Spectral characterization of coumarin-6 ... 28
5.3 Quantification of the Coumarin-6 entrappment ... 35
5.4 MPs-membrane interaction: impact of MPs surface properties ... 36
CHAPTER 6: Discussion ... 38
6.1 Physicochemical characterization of the surface-modified microparticles and coumarin-6 spectral characterization ... 38
6.2 Impact of surface properties of the surface modified MPs in interactions with GUVs ... 41
CHAPTER 7: Conclusion ... 43
CHAPTER 8: Future Work Perspectives ... 44
References ... 45
Annexes ... 53
Annex 1 ... 53
Annex 2 ... 58
ix
List of Figures
Figure 1.1 Representation of the uptake and internalization by endocytosis of the drug carrier systems,
in this case, nanoparticles, NPs. (1) Plasma membrane association with the NPs (2) Internalization of the NPs by endocytosis. (3) Endosomal escape of the NPs (4) Release of the therapeutic agent in the cytoplasm (5). Transport of the therapeutic agent to the target sub-cellular compartment. (6) Degradation of the therapeutic agent in the lysosomes and cytoplasm. (7) Exocytosis of the NPs. PE: primary Endosome; Endo-Lys: Endo-lysossome; Lys: Lysossome; RE: reticulum endoplasmic. Adapted from (2)………..1
Figure 2.1 Double emulsion solvent evaporation method. (a) and (b) corresponds to emulsification
steps (11).………4
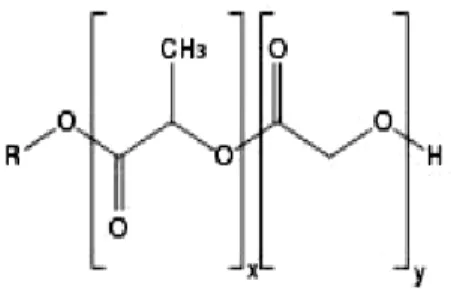
Figure 2.2 Chemical Structure of the copolymer PLGA. X represents the number of units of PLA and
Y the number of PGA units (10).………..…5
Figure 2.3 Chemical structure of CH (26).………..6 Figure 2.4 Structure of Alginate: GG, MM and MG segments (34).………...…7 Figure 2.5 Factors that influence the cellular uptake of the nano and micro drug delivery systems. The
cellular uptake is dependent of factors of the carrier such as size, shape, surface charge and chemistry. In the feature chemistry we can considerate the surface composition, ligand density, hydrophobicity and hidrophilicity. On the other side, cell properties like the receptor internalization levels, internalization mechanism, phenotype, localization and also the rigidity of the plasma membrane also affect the cellular uptake. (58)………..8
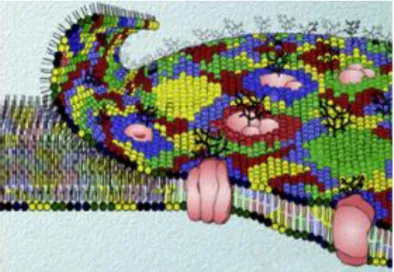
Figure 2.6 Schematic representation of the Fluid Mosaic Model, proposed by Singer and Nicolson.
This model proposes a non-compartmented perspective of biomembranes composed by a lipid bilayer and integral and peripheral proteins, non-homogenously distributed along the biomembrane. (69) ... 12
Figure 2.7 Schematic representation of the update view of the Fluid Mosaic Model. Lipid bilayer is
highly compartmentalized, due to the heterogeneous lipid distribution along the bilayer. Like in the first version of this model, proteins here appear with a non-homogeneous distribution and are also classified as integral and peripheral. Adapted from (80)………12
Figure 2.8 Schematic representation of the three main types of lipids in eukaryotic membranes. (a)
Glycerophospholipids. They are composed of two fatty acyl chains, represented in pink that are linked to the glycerol (blue shading). In the sn-3 position of the glycerol is placed the phosphate group, represented by the orange circle, and can be associated to serine, inositol, ethanolamine, choline and glycerol, leading to phosphatidylserine (PS), phosphatinositol (PI), phosphatidylethanolamine (PE), phosphocholine (PC) and phosphatiglycerol (PG), respectively. These substitutions on the phosphate group are symbolized by the R blue circles. Glycerophospholipids without the headgroup form the phosphatidic acid (PA). (b) Sphingolipids. They are composed of a sphingoid base represented in blue shading, amine linked to a fatty acid (pink shading). This is the constitution of Ceramide (Cer), the simplest sphingolipid. The introduction of phosphocholine or phosphoethanolamine (blue circles) to the headgroup of the ceramide backbone yields sphingomyelin (SM) and to ethanolaminephosphoryl ceramide (EPC), respectively. The introduction of glucose or galactose groups (green hexagons) gives rise to the formation of complex glycosphingolipids. (c) Sterols. They are composed of a sterol ring linked to a hydroxyl group. In mammalians, cholesterol is present, ergosterol in fungi and stigmasterol and sitosterol in plants. Adapted from (120).………...…..14
Figure 2.9 Schematic representation of the gel phase where is noted the maximal bilayer thickness and
the high packing of the lipids. Adapted from (67)………..…15
Figure 2.10 Schematic representation of the liquid disordered (ld) (on the left) and the liquid ordered
x and has a high order (like in gel phase) and a high translational mobility, characteristic of fluid phases. The ld phase is mainly composed by phospholipids and the order of the acyl chains is lower and the
degree of freedom of the lipids is higher, comparatively to lo phase. Adapted from (67)………15
Figure 2.11 Schematic representation of the Inverted Hexagonal Phase. The hydrocarbon chains are
facing the exterior and the polar headgroups the interior. Adapted from (74).………16
Figure 2.12 Schematic representation of Lipid Rafts. In the lo phase it is visible an enrichment in Chol
(green) and a high packing of the hydrocarbon chains of the lipids. Glycosphingolipids are represented in pink. The surrounded ld phase has a lower content of cholesterol and lipids have a disordered
arrangement of its hydrocarbon chains (121).………17
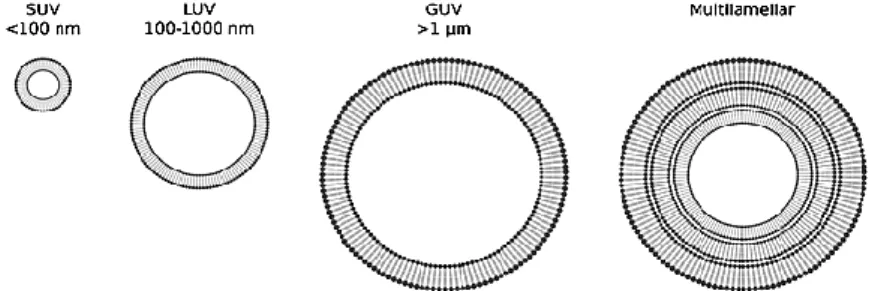
Figure 2.13 Schematic representation of the different types of liposomes, according to its size and
number of bilayers. Adapted from (70).……….18
Figure 5.1 Microparticle Size Distribution by Volume. (A) PLGA MPs: PLGA PVA MPs (blue),
PLGA CH MPS (red) and PLGA ALG MPs (green). (B) PLGA-C6 MPs (labeled with 0.2 m /mg of coumarin-6): PLGA PVA-C6-3 MPs (blue), PLGA CH-C6-3 MPS (red) and PLGA ALG-C6-3 MPs (green).………25
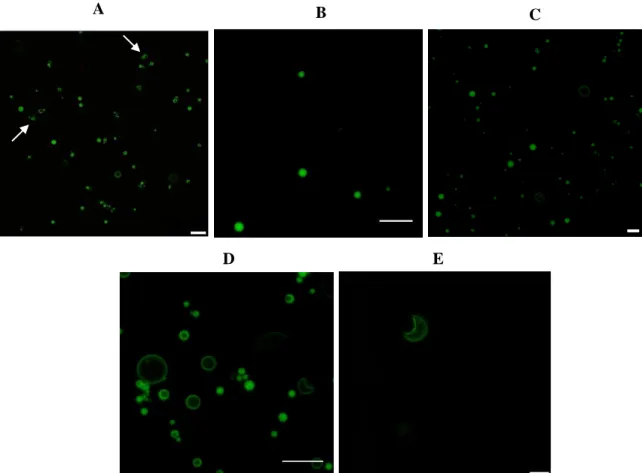
Figure 5.2 Physichochemical properties of coumarin-6-loaded PLGA MPs with different surface
modifications were evaluated by confocal microscopy imaging. Three-dimensional projection images from 0.5 μm confocal slices of PLGA MPs labeled with coumarin-6 (green): (A), (D) PLGA PVA-C6-3 MPs, (B) PLGA CH-C6-PVA-C6-3 MPs, (C), (E) PLGA ALG-C6-PVA-C6-3 MPs. Representative images of three independent experiments are shown. Scale bars = 10 μm………..28
Figure 5.3 Coumarin-6 absorption spectra and calibration curve in stock solutions prepared in DCM
and ethanol. (A) Coumarin-6 absorption spectra and (B) Calibration curve both obtained by the different solutions prepared from the coumarin-6 stock solution in DCM (in triplicate). Normalized absorption spectra of the different solutions prepared from (C) the coumarin-6 stock solution in DCM (detail of the two ranges of maximal absorption) and (D) coumarin-6 stock solution in ethanol. Concentrations of each solution of coumarin-6: 1.85 μM (light blue), 3.70 μM (orange), 5.56 μM (light green), 7.41 μM (green), 9.26 μM (dark green), 11.1 μM (purple). Data correspond to N ≥ 3, n = 3.……….…29
Figure 5.4 Coumarin-6 excitation and emission spectra in PLGA-C6 MPs labeled with 0.20 g/mg of coumarin-6 for the different concentrations of MPs in suspension. Excitation and emission spectra of (A) PLGA PVA-C6 MPs, (B) PLGA CH-C6 MPs, and (C) PLGA ALG-C6 MPs and correspondent normalized excitation and emission spectra (D,E,F) . Data for the concentrations of PLGA in suspension 0.10 mg/mL, 0.20 mg/mL, 0.25 mg/mL, 0.40 mg/ml and 0.50 mg/mL are shown in blue, red, green, purple and light blue. Data correspond to N = 1, n = 1. Measurements were performed setting λem=510 nm during the acquisition of the excitation spectra and λex = 445 nm during the
acquisition of the emission spectra.F.I. Fluorescence Intensity (a.u)………. ... 30
Figure 5.5 Coumarin-6 and emission spectra in PLGA-C6 MPs labeled with 0.20 g/mg of coumarin-6 for MPs concentration 0.25 mg/mL, (A) non-normalized and (B) normalized. Data for PLGA PVA-C6-3 MPs, PLGA CH-PVA-C6-3 and PLGA ALG-PVA-C6-3 MPs is shown in blue, red and green (respectively). Data correspond to N = 1, n = 1. Measurements were performed setting λex = 445 nm during the
acquisition of the emission spectra. F.I. Fluorescence Intensity (a.u.).………..…31
Figure 5.6 Variation of coumarin-6 fluorescence intensity maximum as a function of MPs
concentration in the suspension in (A) PLGA PVA-C6 MPs, (B) PLGA CH-C6 MPs and (C) PLGA ALG-C6 MPs. Data for coumarin-6 concentration 0.04 g/mg, 0.10 g/mg, 0.20 g/mg, 0.40 g/mg and 1.00 g/mg is shown in blue, red, green, purple and light blue, respectively. Data correspond to N = 1, n = 1. F.I. MAX, Fluorescence Intensity Maximum (a.u).……….32
xi
Figure 5.7 Variation of coumarin-6 fluorescence intensity maximum as a function of MPs
concentration in the suspension. PLGA MPs were loaded with (A) 0.2 and (B) 0.4 µg coumarin-6/mg of PLGA. Data for PLGA PVA, PLGA CH and PLGA ALG MPs are shown in blue, red and green, respectively. Data correspond to N = 1, n = 1. F.I. MAX, Fluorescence Intensity Maximum (a.u). ... 32
Figure 5.8 Coumarin-6 normalized spectra in (A) PLGA PVA-C6 MPs, (B) PLGA-CH-C6 MPs and
(C) PLGA-ALG-C6 MPs labeled with 0.04 g/mg (blue), 0.10 g/mg (red), 0.20 g/mg (green), 0.40 g/mg (purple) and 1.00 g/mg (light blue) of coumarin-6. Variation of em max in (D) PLGA PVA-C6
MPs, (E) PLGA-CH-C6 MPs, and (F) PLGA-ALG-C6 MPs as a function of coumarin-6 concentration. The concentration of the MPs in the suspension is 0.25 mg/mL for all panels. Data correspond to N = 1, n = 1. Measurements were performed setting λex = 445 nm during the acquisition
of the emission spectra.F.I. Fluorescence Intensity (a.u.).………..………...33
Figure 5.9 Variation of the coumarin-6 fluorescence intensity maximum as a function of probe
concentration in (A) PLGA PVA-C6 MPs, (B) PLGA CH-C6 MPs and (C) PLGA ALG-C6 MPs. Data for the concentration of PLGA in suspension 0.10 mg/mL, 0.20 mg/ml, 0.25 mg/mL, 0.40 mg/mL and 0.50 mg/mL are shown in blue, red, green, purple and light blue. Data correspond to N = 1, n = 1. F.I. MAX, Fluorescence Intensity Maximum (a.u).………34
Figure 5.10 Variation of coumarin-6 anisotropy as a function of MPs concentration in suspension
(A-C, E-F) or coumarin-6 concentration (D). (A) PLGA PVA-C6 MPs, (B) PLGA CH-C6 MPs and (C) PLGA ALG-C6 MPs were loaded with 0.04 g/mg (blue), 0.10 g/mg (red), 0.20 g/mg (green), 0.40 g/mg (purple) and 1.00 g/mg (light blue). In (D) the concentration of the MPs suspension is 0.25
µg/mL. PLGA PVA MPs (blue), PLGA CH MPs (red) and PLGA ALG MPs (green) were loaded with
(E) 0.20 g/mg and (F) 0.40 g/mg of coumarin-6. Data correspond to N = 1, n = 1……… 34
Figure 5.11 Confocal Microscopy images of GUVs labeled with Rho-DOPE (red), and PLGA-C6
MPs labeled with a concentration of 0.2 µg/mg of coumarin-6 (green). The concentration of the MPs in the suspension is 0.25 mg/mL for all panels. GUVs are composed by the following lipid mixtures: (A-C) POPC, (D-F) POPC/DPPC (1:1 mol/mol) and (G-J) POPC/SM/Chol (1:1:1 mol/mol/mol). Data for PLGA PVA-C6-3 MPs, PLGA CH-C6-3 MPs and PLGA ALG-C6-3 MPs are shown in (A,D,G), (B,E,H) and (C,F,I,J), respectively. In (E) is visible de detail of the confocal section which demonstrated that the MP is inside the GUV. Representative images of three independent experiments are shown. Scale bars = 10 μm.……….37
Figure 6.1 PSM/POPC/Chol phase diagram at 23 °C. experimental points are represented by circles
(122).………..42
Figure A.1 Coumarin-6 excitation and emission spectra in PLGA PVA-C6 MPs labeled with 0.04,
0.1, 0.4 and 1.00 g/mg of coumarin-6 for the different concentrations of MPs in suspension. Excitation and emission spectra of (A) PLGA PVA-C6-1 MPs, (B) PLGA PVA-C6-2 MPs, and (C) PLGA PVA-C6-4 MPs and (D) PLGA PVA-C6-5 MPs. Data for the concentrations of PLGA in suspension 0.10 mg/mL, 0.20 mg/mL, 0.25 mg/mL, 0.40 mg/mL and 0.50 mg/mL are shown in blue, red, green, purple and light blue. Data correspond to N = 1, n = 1. Measurements were performed setting λem=510 nm during the acquisition of the excitation spectra and λex = 445 nm during the
acquisition of the emission spectra.F.I. Fluorescence Intensity (a.u)………. .... 53
Figure A.2 Coumarin-6 excitation and emission spectra in PLGA CH-C6 MPs labeled with 0.04, 0.1,
0.4 and 1.00 g/mg of coumarin-6 for the different concentrations of MPs in suspension. Excitation and emission spectra of (A) PLGA CH-C6-1 MPs, (B) PLGA CH-C6-2 MPs, and (C) PLGA CH-C6-4 MPs and (D) PLGA CH-C6-5 MPs. Data for the concentrations of PLGA in suspension 0.10 mg/mL, 0.20 mg/mL, 0.25 mg/mL, 0.40 mg/mL and 0.50 mg/mL are shown in blue, red, green, purple and light blue. Data correspond to N = 1, n = 1. Measurements were performed setting λem=510 nm during
xii the acquisition of the excitation spectra and λex = 445 nm during the acquisition of the emission
spectra.F.I. Fluorescence Intensity (a.u).………54
Figure A.3 Coumarin-6 excitation and emission spectra in PLGA ALG-C6 MPs labeled with 0.04,
0.1, 0.4 and 1.00 g/mg of coumarin-6 for the different concentrations of MPs in suspension. Excitation and emission spectra of (A) PLGA ALGC6-1 MPs, (B) PLGA ALG-C6-2 MPs, and (C) PLGA ALG-C6-4 MPs and (D) PLGA ALG-C6-5 MPs. Data for the concentrations of PLGA in suspension 0.10 mg/mL, 0.20 mg/mL, 0.25 mg/mL, 0.40 mg/mL and 0.50 mg/mL are shown in blue, red, green, purple and light blue. Data correspond to N = 1, n = 1. Measurements were performed setting λem=510 nm during the acquisition of the excitation spectra and λex = 445 nm during the
acquisition of the emission spectra.F.I. Fluorescence Intensity (a.u)………. .... 55
Figure A.4 Coumarin-6 normalized excitation and emission spectra in PLGA PVA-C6 MPs labeled
with 0.04, 0.1, 0.4 and 1.00 g/mg of coumarin-6 for the different concentrations of MPs in suspension. Excitation and emission spectra of (A) PLGA PVA-C6-1 MPs, (B) PLGA PVA-C6-2 MPs, and (C) PLGA PVA-C6-4 MPs and (D) PLGA PVA-C6-5 MPs. Data for the concentrations of PLGA in suspension 0.10 mg/mL, 0.20 mg/mL, 0.25 mg/mL, 0.40 mg/mL and 0.50 mg/mL are shown in blue, red, green, purple and light blue. Data correspond to N = 1, n = 1. Measurements were performed setting λem=510 nm during the acquisition of the excitation spectra and λex = 445 nm during
the acquisition of the emission spectra.F.I. Fluorescence Intensity (a.u). ………..………..………56
Figure A.5 Coumarin-6 normalized excitation and emission spectra in PLGA CH-C6 MPs labeled
with 0.04, 0.1, 0.4 and 1.00 g/mg of coumarin-6 for the different concentrations of MPs in suspension. Excitation and emission spectra of (A) PLGA CH-C6-1 MPs, (B) PLGA CH-C6-2 MPs, and (C) PLGA CH-C6-4 MPs and (D) PLGA CH-C6-5 MPs. Data for the concentrations of PLGA in suspension 0.10 mg/mL, 0.20 mg/mL, 0.25 mg/mL, 0.40 mg/mL and 0.50 mg/mL are shown in blue, red, green, purple and light blue. Data correspond to N = 1, n = 1. Measurements were performed setting λem=510 nm during the acquisition of the excitation spectra and λex = 445 nm during the
acquisition of the emission spectra.F.I. Fluorescence Intensity (a.u)………. .... 57
Figure A.6 Coumarin-6 normalized excitation and emission spectra in PLGA ALG -C6 MPs labeled
with 0.04, 0.1, 0.4 and 1.00 g/mg of coumarin-6 for the different concentrations of MPs in suspension. Excitation and emission spectra of (A) PLGA ALG-C6-1 MPs, (B) PLGA ALG -C6-2 MPs, and (C) PLGA ALG -C6-4 MPs and (D) PLGA ALG -C6-5 MPs. Data for the concentrations of PLGA in suspension 0.10 mg/mL, 0.20 mg/mL, 0.25 mg/mL, 0.40 mg/mL and 0.50 mg/mL are shown in blue, red, green, purple and light blue. Data correspond to N = 1, n = 1. Measurements were performed setting λem=510 nm during the acquisition of the excitation spectra and λex = 445 nm during
the acquisition of the emission spectra.F.I. Fluorescence Intensity (a.u). ………..…………..58
Figure A.7 Coumarin-6 normalized spectra in PLGA PVA-C6 MPs suspensions with concentration of
MPs (A) 0.1 mg/mL, (B) 0.2 mg/mL, (C) 0.4 mg/mL and (D) 0.5 mg/mL labeled with coumarin-6 different concentrations of coumarin-6. Data for the concentrations of coumarin-6 0.04 g/mg, 0.1 g/mg, 0.2 g/mg, 0.4 g/mg and 1 g/mg are shown in blue, red, green, purple and light blue. Data correspond to N = 1, n = 1. Measurements were performed setting λex = 445 nm during the acquisition
of the emission spectra.F.I. Fluorescence Intensity (a.u.).………...59
Figure A.8 Coumarin-6 normalized spectra in PLGA CH-C6 MPs suspensions with concentration of
MPs (A) 0.1 mg/mL, (B) 0.2 mg/mL, (C) 0.4 mg/mL and (D) 0.5 mg/mL labeled with coumarin-6 different concentrations of coumarin-6. Data for the concentrations of coumarin-6 0.04 g/mg, 0.1 g/mg, 0.2 g/mg, 0.4 g/mg and 1 g/mg are shown in blue, red, green, purple and light blue. Data
xiii correspond to N = 1, n = 1. Measurements were performed setting λex = 445 nm during the acquisition
of the emission spectra .F.I. Fluorescence Intensity (a.u.).………...60
Figure A.9 Coumarin-6 normalized spectra in PLGA ALG-C6 MPs suspensions with concentration of
MPs (A) 0.1 mg/mL, (B) 0.2 mg/mL, (C) 0.4 mg/mL and (D) 0.5 mg/mL labeled with coumarin-6 different concentrations of coumarin-6. Data for the concentrations of coumarin-6 0.04 g/mg, 0.1 g/mg, 0.2 g/mg, 0.4 g/mg and 1 g/mg are shown in blue, red, green, purple and light blue. Data correspond to N = 1, n = 1. Measurements were performed setting λex = 445 nm during the acquisition
of the emission spectra. F.I. Fluorescence Intensity
(a.u.)………..………....61
Figure A.10 Variation of em with the concentration of coumarin-6 in (A) PLGA PVA-C6 MPs, (B)
PLGA CH-C6 MPs and (B) PLGA ALG-C6 MPs. Data for the concentrations of MPs in suspension 0.10 mg/mL, 0.20 mg/mL, 0.40 mg/mL and 0.50 mg/mL are shown in blue, red, green, purple and light blue. Data correspond to N = 1, n = 1.……….62
xiv
List of Tables
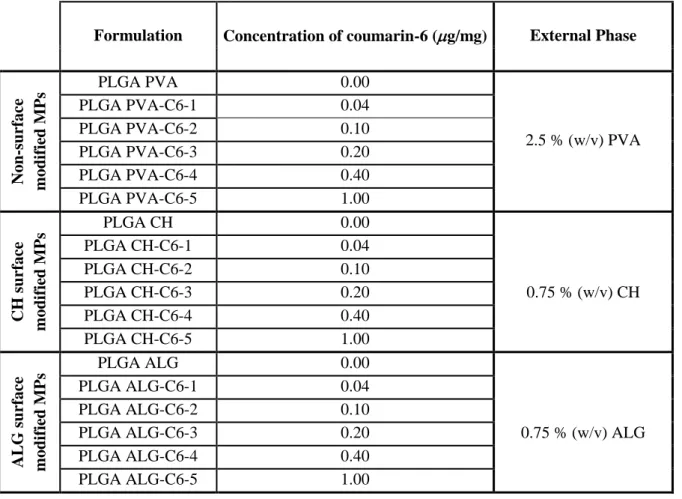
Table 4.1 Composition of the plain, CH surface modified MPs and ALG surface modified MPs... .... 21 Table 5.1 Physicochemical characterization of coumarin-6-loaded PLGA Microparticles. Size
parameters of unloaded and coumarin-6 loaded PLGA PVA MPs, PLGA CH MPs and PLGA ALG MPs are presented as span, D10%, D50% and D90% (mean ± SD; N ≥ 3, n = 3). Statistical analysis: two
way ANOVA and Bonferroni’s post test. D50% ** a
significantly different (p < 0.01) comparing to PLGA ALG C6-5. D50% **
b
significantly different (p < 0.01) comparing to PLGA ALG C6-4.……..26
Table 5.2 Physicochemical characterization of the PLGA MPs. Table shows the Zeta Potential (ZP) of
the unloaded and coumarin-6 loaded PLGA MPs. Data correspond to mean ± SD (N ≥ 3, n = 3). Statistical analysis: two way ANOVA and Bonferroni’s post test. Relative to the same coumarin-6 concentration *** p < 0.001.……….………...27
Table 5.3 Entrapment Efficiency (E.E. %) and Loading Capacity (μg/mg) of coumarin-6 used at an
initial concentration 0.2 μg/ml to formulate surface-modified PLGA MPs with PVA (PLGA PVA-C6-3 MPs), CH (PLGA CH-C6-PVA-C6-3 MPs) and ALG (PLGA ALG-C6-PVA-C6-3 MPs) (mean ± SD; N = PVA-C6-3, n = PVA-C6-3). Statistical analysis: one way ANOVA and Tukey’s post test. E.E and L.C., relative to the same coumarin-6 concentration *** p < 0.001.………..35
xv
List of Acronyms
em emission maxima wavelength
ex excitation maxima wavelength
max adsorption maxima wavelength
ε molar absorptivity A absorbance ALG Alginate c concentration CH chitosan Chol Cholesterol Coumarin-6 3-(2’-benzothiazolyl)-7-N,N-diethylaminocoumarin DCM dichloromethane DNA deoxyribonucleic acid
DPPC 1,2-dipalmitoyl-sn-glycero-3-phosphocholine
E.E. Entrapment Efficiency
EPC ethanolaminephosphoryl ceramide G -L-guluronic acid
GPI glycosylphosphatidylinositol GUVs Giant Unilamellar Vesicles HI Hexagonal Phase
HII Inverted Hexagonal Phase
l optical length L Lamellar Phase
LUVs Large Unilamellar Vesicles L Fluid Phase L gel state ld liquid disordered lo liquid ordered L.C. Loading Capacity M -D-mannuronic acid MPs microparticles
MRI Magnetic Resonance Imaging NPs nanoparticles
(O) oil phase
PA phosphatidic acid
PE phosphatidylethanolamine PEG poly(ethylene glycol) PI phosphatinositol PC phosphatidylcholine PCL poly(ε-caprolac-tone)
PET Positron Electron Tomography PG phosphatiglycerol
PGA Polyglycolic acid PLA Poly(lactic acid)
PLGA poly(lactic-co-glycolic acid) POPC
1-palmitoyl-2-oleoyl-sn-glycero-3-phosphocholine
PVA polyvinyl alcohol PS phosphatidylserine RGD Arg-Gly-Asp
Rho-DOPE 2-Dioleoyl-sn-Glycero-3-Phosphoethanolamine-N-(Lissamine Rhodamine B Sulfonyl)
xv
SM sphingomyelin
SUVs Small Unilamellar Vesicles
Src proto-oncogene tyrosine-protein kinase
Tm main transition temperature
TMC N-trimethyl CH US-FDA United States Food and Drug
Administration
ZP zeta potential (W) Water phase
1
CHAPTER 1: Introduction
In the last three decades, nanotechnology has become a promising approach in diverse research areas, like electronics, material engineering, biomedical engineering and pharmaceutics. The wide range specific surface area, size, shape, surface chemistry and crystalline structure provide nanostructures with unique properties and promising applications in drug delivery (1).
The efficient delivery of therapeutic agents that target specific sub-cellular compartments such as cytoplasm, nucleus, and mitochondria is crucial for their therapeutic success (2). Nano and micro drug delivery systems must cross one or various biological membranes (e.g. mucosa, epithelium, endothelium) and, after interacting with the plasma membrane, can thus be internalized by a process called endocytosis (Figure 1.1) (2,3). During endocytosis, the drug delivery system is first engulfed inside the plasma membrane through endosomes, invaginations of the plasma membrane. The carrier can then follow different intracellular trafficking pathways and reach specific sub-cellular compartments. Part of the therapeutic agent can be removed to the extracellular medium or to other cells, in the case of polarized cells.
Overall, during the endocytic process, drug carrier systems have some barriers to overcome until it reaches the target sub-cellular site: association with the plasma membrane and internalization through endocytosis; intracellular trafficking and delivery of the therapeutic agent or the drug carrier system in the cytoplasmic medium; and translocation to the nucleus or other cellular organelle (2,3). During the association with the plasma membrane, the interactions between the drug carriers and the
Figure 1.1Representation of the uptake and internalization by endocytosis of the drug carrier systems, in this case, nanoparticles, NPs. (1) Plasma membrane association with the NPs (2) Internalization of the NPs by endocytosis. (3) Endosomal escape of the NPs (4) Release of the therapeutic agent in the cytoplasm (5). Transport of the therapeutic agent to the target sub-cellular compartment. (6) Degradation of the therapeutic agent in the lysosomes and cytoplasm. (7) Exocytosis of the NPs. PE: primary Endosome; Endo-Lys: Endo-lysossome; Lys: Lysossome; RE: reticulum endoplasmic. Adapted from (2)
2 plasma membrane largely determine the successful passage to the interior of the cell. However, such interactions are still poorly studied. Due to the complexity of the plasma membrane and the properties of nano and micro drug delivery systems, the clear perception of how they interact is very important to control and understand the mechanisms of uptake by the target cells. As so, some features like size, morphology, surface charge (zeta potential, ZP) and surface chemistry of the nano and micro drug delivery systems, are widely acceptable as critical factors that control their interaction and further uptake by the biomembranes (4–6).
This dissertion is divided in 8 chapters:
Chapter 1 - Introduction
Chapter 2 – Literature Review contains a review on the properties of the polymeric microparticles
and the surface-related features critical to the interactions with the cells. This chapter also includes an overview of historical perspective, structure, function and dynamics of the biomembranes.
Chapter 3 - Aims
Chapter 4 – Materials and Methods
Chapter 5 – Results includes a detailed description of the main results of the physicochemical
characterization of the surface-modified microparticles. Also provides a detailed study on the spectral characterization of coumarin-6 entrapped into the MPs. Finally, this chapter contains the MPs-membrane interaction studies made under confocal imaging.
Chapter 6 – Discussion Chapter 7 – Conclusion
Chapter 8 – Future Work Perspective
3
CHAPTER 2: Literature Review
2.1 Drug Delivery Systems – Micro and Nano Systems
Modern drug delivery research is focused on the development of micro and nano delivery systems. These systems have the ability to deliver therapeutic entities to the target cell, tissue or organ in a more controlled, specific and reproducible way, while maintaining the release of the desired therapeutic concentration in a controlled rate and for an appropriate period of time (5). These systems provide minimal side effects by increasing the delivery of the therapeutic agent to the target site, thus requiring lower amount of therapeutic entity.
Nano and micro drug delivery systems should be biocompatible, non-toxic, non-allergic or non–inflammatory. In addition, several key parameters should be considered such as: size of the drug delivery system, entrapment method, stability of the therapeutic entity, mechanism of degradation of the matrix and the release kinetics of the therapeutic agent (6). The materials used as matrix can be diverse, including ceramic, gold, carbon, lipidic or polymers. Matrices that are biodegradable and bioabsorbable are the most preferred as will not require removal surgical operations. Therapeutic entities can be entrapped, protecting their functional properties, decreasing the risk of inactivation and toxicity for prolonged time. The release stimuli of the therapeutic agent includes activation of drug release by signals as pH variations, temperature, electric field and ultrasound or by degradation of the polymeric matrix (5). Additionally, release mechanisms include diffusion of the therapeutic agent and erosion of the matrix.
Examples of nano and micro delivery systems are micelles, liposomes, dendrimers, carbon nanotubes, solid-lipid nanoparticles, gold nanoparticles, polymeric nanoparticles (NPs) and polymeric microparticles (MPs).
2.1.1 Polymeric Microparticles
Polymeric MPs are spherical solid colloidal structures composed of a biodegradable polymeric matrix with more than 1 m (7). Polymeric MPs are divided in microspheres and microcapsules, depending on their morphology, leading to distinct therapeutic agent distributions. In the first ones, the therapeutic agent is homogeneously dispersed or solubilized inside the polymeric matrix, while in microcapsules the drug is inside an individualized core surrounded by a polymeric membrane. The materials used in polymeric MPs formulation can be natural polymers like alginate (ALG), Chitosan (CH), collagen, dextran, gelatin and albumin. Regarding the synthetic polymers, these include the widely used Poly(lactic acid) (PLA), the copolymer poly(lactic-co-glycolic acid) (PLGA) and poly(ε-caprolactone) (PCL) (8). Polymeric MPs can be formulated using i) monomers by polycondensation or polymerization; or from ii) polymers by single or double emulsion with solvent evaporation, microfluid technology and spray-drying (8).
Regarding the single and double emulsion processes with solvent evaporation, both hydrophobic and hydrophilic molecules can be entrapped. Hydrophobic molecules are generally entrapped by single emulsion, while hydrophilic molecules are entrapped by double emulsion (9). Briefly describing the single emulsion method, the polymer is dissolved in an organic solvent such as
4
Figure 2.1 Double emulsion solvent evaporation method. (a) and (b) corresponds to
emulsification steps (11).
dichloromethane (DCM), oil phase (o) (10). The therapeutic entity is also added to that phase. Under appropriate stirring and temperature, this organic solution is emulsified in the presence of a large volume of aqueous surfactant solution, the water phase (w) (10). The resulting emulsion is an oil-in-water (o/w) emulsion. The organic solvent is allowed to evaporate under appropriate stirring and temperature conditions. The MPs are normally collected by centrifugation. Concerning to the double emulsion method (Figure 2.1), the polymer is dissolved in an organic solvent such as DCM, (o). The therapeutic entity is dissolved in the aqueous surfactant solution (w). The (w) is added to the (o) under appropriate stirring to allow the generation of the water-in-oil (w/o) emulsion (9,11). This emulsion is transferred to an aqueous surfactant solution, being then emulsified under strong stirring. The resulting emulsion is a water-in-oil-water (w/o/w) emulsion. The organic solvent is allowed to evaporate under stirring during several hours. The MPs are usually collected by centrifugation (9,11).
2.1.1.1 PLGA Microparticles
PLGA is a synthetic biodegradable polymer widely studied in the last decades and used for several biomedical applications, namely in the fabrication of drug delivery devices such as NPs and MPs (10). PLGA-containing medicines have been approved by the United States Food and Drug Administration (US-FDA) for drug delivery due to polymers’ high biocompatibility, biodegradability, and control of the drug release (12). PLGA can be implanted and carriers can be administrated by parenteral or non-invasive routes.
PLGA is polyester composed of the copolymers PLA and Poly(glycolic acid) (PGA) (Figure
2.2) and undergoes degradation through the hydrolysis of its ester linkages, producing those
monomers that will be metabolized by the body via Krebs cycle. This phenomenon was demonstrated in various conditions in vivo and in vitro with different ratios of PLA and PGA and several types of bioactive molecules (10,13,14). The mechanism of degradation is the bulk degradation and so, the water penetration in the polymeric matrix is faster than the degradation, and therefore the erosion is uniform in the entire matrix surface. The release profile of drugs within the PLGA matrix is usually described by a biphasic curve, where initially the release is abrupt (called a burst) and the polymer molecular weight loss is not significant. The second phase consists on a slow release of the drug, commonly by diffusion (by passing water through the pores). The water inside the matrix hydrolyzes the polymer, leading to a significant loss of polymer molecular weight. Design factors like molar ratio of PLA and PGA, molecular weight of the PLGA, degree of crystallinity, drug hidrophilicity and pH of the environment determine the degradation rate.
5 The PLGA-based drug delivery systems have been studied to deliver proteins, peptides, deoxyribonucleic acid (DNA), ribonucleic acid (RNA) and drugs (10). PLGA MPs can be prepared by single or double emulsion with solvent evaporation, phase separation (coacervation) and spray-drying. Usually, these MPs are prepared by the emulsion solvent evaporation method. The polyvinyl alcohol (PVA) is the most widely used surfactant to stabilize the emulsion and to reduce the surface tension because it generally allows the formulation of MPs with uniform size distribution, it is easy to disperse in aqueous medium and easily washed (15). In fact, due to its amphiphilic nature, PVA has excellent emulsifying properties being also able to increase the viscosity of the continuous phase. However, the use of PVA has raised some concerns regarding its carcinogenic potential and toxicity (16). Complications like anemia and infiltration in various tissues and organs were reported when subcutaneously injecting 5 % (w/v) PVA aqueous solutions in rats (17).
The biomedical applications PLGA MPs include the diagnostic and treatment of cancer, cardiovascular disease and diabetes, development of vaccines, among others.
In tumor imaging, the use of imaging techniques like Magnetic Resonance Imaging (MRI), ultrasounds and Positron Electron Tomography (PET) in combination with PLGA MPs entrapped imaging contrast agents is an important approach for the diagnostic and study of the tumoral area in
vivo. Lavisse et al. developed PLGA MPs with size distributions of 1 to 15 μm to acoustically
characterize and select the most suitable to encapsulate the ultrasound contrast agent and then, perform a preliminary in vivo study in melanoma grafted mice using Doppler ultrasonography. PLGA MPs of 3 μm showed the best results, inducing an enhancement of 47% of intratumoral vascularization visualization after the MPs injection (18). In cancer disease treatment, PLGA MPs linked with antibodies or targeting ligands such as cytokines, hormones, vaccines and chemotherapeutic agents are employed to treat malignant tumors with high specificity and affinity (12). Yemisci et al. developed PLGA MPs loaded with mitoxantrone to treat malignant glioma (19). In this study, wister were divided into three groups: i) rat glioma (RG2) cells and blank PLGA MPs were simultaneously implanted, ii) RG2 cells and mitoxantrone loaded-PLGA MPs were simultaneously implanted and iii) RG2 cells was implanted and mitoxantrone loaded-PLGA MPs were injected after 7 days. Results demonstatred that mitoxantrone loaded-PLGA MPs reduced significantly the tumor volume of the rats belonging to group iii). No tumor formation was observed in rats belonging to group ii). In addition, results showed no systemic side effects or parenchymal inflammatory infiltration in either groups .
PLGA MPs were also studied to deliver growth factors (such as cytokines) to the heart to treat cardiac failure after a myocardial infarct, in a rat model of myocardial infarction. The results showed a high angiogenic and arteriogenic effect (8).
Figure 2.2 Chemical Structure of the
copolymer PLGA. X represents the number of units of PLA and Y the number of PGA units (10).
6 Regarding the development of vaccines, PLGA is the most studied polymer in this field because it is a promising candidate to deliver antigens and adjuvants to the target site with a controlled release profile (12,20,21). PLGA MPs have been used as a delivery vehicle of antigens in injectable administration (20). Peyere et al. developed PLGA MPs prepared by spray-drying or coacervation loaded with tetanus or diphtheria toxins, acting as a multivalent vaccine. The PLGA MPs were administrated subcutaneously by single injection in guinea pigs and the results showed a high immunogenic effect compared with the same dose injected with the licensed divalent vaccine (20).
2.1.1.2 Surface modification of PLGA Microparticles
PLGA NPs and MPs can be surface-modified by functionalization with target ligands and antibodies, or alternatively by coating with hydrophobic and hydrophilic polymers. Surface modification can be used in order to manipulate several chemical surface properties, such as hydrophobicity, hydrophilicity and surface charge (22). In this way, surface modification will help to modulate the entrapment efficiency and the release of the therapeutic entities and also to improve the interactions between the PLGA NPs/MPs systems with the cells (23). This section will briefly review the properties of the polymers CH and ALG, which can be used to modify the surface of PLGA NPs and MPs.
CH is a natural polymer used in the pharmaceutical field since 1990. It is very attractive to use in drug delivery systems because of its biocompatibility, ―non-toxicity‖ and cationic properties due to the presence of the primary amino groups. In fact, the presence of its amino groups is responsible for important properties such as controlled release and the mucoadhesion. The mucoadhesion is achieved due to the interaction of positively charged CH MPs and the negative charge of mucosal surfaces (24). As a drug carrier system, CH has been used in the fabrication of membranes, tablets, NPs and MPs which can be administrated via oral, nasal, ocular, vaginal, buccal, parenteral and intravesical routes (24). CH is obtained by the deacetylation at high temperatures of chitin, which is the main constituent of the exoskeleton of crustaceans. Structurally, it is a linear polyaminosaccharide, composed of the copolymers of -(1–4) linked 2-acetamido-2-deoxy--D-glucopyranose and 2-amino-2-deoxy- -D-glycopyranose (Figure 2.4) (24–26). CH is soluble in aqueous acidic solutions and insoluble in water and organic solvents. However nowadays there are some derivates such as N-trimethyl CH (TMC) that are water soluble (27).
It is known that the entrapment efficiency of the therapeutic agent in CH MPs increases with the increase of CH concentration (25). Typically, solutions with high concentrations of CH have higher viscosity and avoid the formation of drug crystals from leaving the droplets (25). Additionally, it is known that the molecular weight of CH influences the release of the therapeutic agent from the MPs. A decrease in the release velocity is observed with increasing of the CH molecular weight
7 because of the higher viscosity of the gel layer in the drug delivery system, which affects the diffusion of the therapeutic agent (25).
Some of the biomedical applications of PLGA NPs and MPs surface modified with CH include the diagnostic and treatment of cancer and development of vaccines. Chandy et al. developed PLA MPs and PLGA MPs coated with CH or PVA loaded with 5-Fluorouracil (a hydrophilic antimetabolite used in cancer therapy), prepared by double emulsion solvent evaporation. Results from scanning electron microscopy revealed that CH-coated MPs had less surface pores than the PVA-coated MPs. This was reflected in the drug release profile, which was slower in CH MPs than in the PVA MPs. This work demonstrated that PLGA MPs coated with CH are promising carriers for a prolonged release of anti-tumor drugs (28). The high mucoadhesive properties of CH increase significantly the amount of macromolecules absorbed in mucosal barriers when administrated with this polymer (26,29–31). Kawashima et al. prepared PLGA NPs surface modified with CH, poly(acrylic acid) and sodium alginate for oral administration (31). These NPs systems entrapped the peptide elcatonin. By measuring the PLGA NPs adsorbed to a rat everted instestinal sac (in vitro), their mucoadhesive properties were evaluated. Results showed that surface modified CH PLGA NPs showed higher mucoadhesion to the everted intestinal tract in saline than the other PLGA NPs (31).
ALG is a natural, biocompatible, biodegradable and ―non-toxic‖ polymer used in several biomedical applications such as tissue engineering and drug delivery (32). In drug delivery, alginate has been used to prepare gels, matrices (as an encapsulating material to cell culture and transplant), membranes, NPs and MPs (32,33). ALG is approved by the US-FDA as a safe material for use in the alimentary field, having the designation of ―Generally Referred as Safe‖ (34). Structurally, alginate is a linear polysaccharide composed by residues of -L-guluronic acid (G) and -D-mannuronic acid (M) linked by 1-4 linkages, which generates homopolymeric MM and GG segments interposed by heteropolymeric segments of MG or GM (Figure 2.4) (32,33). ALG is pH-sensitive due to the pendent acid groups that, in different pH, accept or release protons.
The production of ALG can be from two sources: algae and bacteria. Regarding the extraction from bacteria, it is important to mention that it is normally restricted to some research studies, due to the high cost of the process. Hence, commercial ALG is mainly extracted by alkaline extraction, from brown algae: the algae is collected, dried and submitted to chemical treatments to remove undesired
Figure 2.4 Structure of Alginate: GG, MM and MG
8 substances like heavy metals, endotoxins and proteins, and is converted to a powder material in the acid or salt form (33).
The biomedical applications of ALG-surface modified PLGA NPs and MPs include e.g. the development of vaccines. Mata et al. developed PLGA MPs and ALG surface modified PLGA MPs to malaria vaccination (35). These microparticulate systems entrapped the malaria synthetic peptides SPf66 and S3 and the humoral and cellular immune responses were evaluated after intradermal immunization. Results showed that the incorporation of ALG caused higher humoral and cellular immune responses (35). Additionally, the administration of PLGA MPs coated with Arg-Gly-Asp (RGD)-modified ALG showed higher cellular responses such as interferon- secretion and lymphoproliferation. Actually, this observation was an evidence of cell targeting (35). ALG has also been described as mucoadhesive polymer, improving the delivery of molecules to the mucosal tissues (23,36). Ungaro et al. developed PLGA NPs surface modified with ALG or CH to the production of dry powders for the tobramycin antibiotic inhalation (36). PLGA NPs were embedded in an inert microcarrier made of lactose. Results showed that surface modified ALG PLGA NPs allowed efficient antibiotic entrapment and achieved its release up to one month. The in vivo biodistribution studies demonstrated that plain PLGA NPs and ALG surface modified PLGA NPs reached up the deep lung. On other side, CH surface modified PLGA NPs reached the upper airways, the lining lung epithelial surfaces (36).
2.1.2 Impact of Physicochemical Surface Properties of Nano and
Micro Systems in Cellular Uptake – size, surface charge, shape
and chemistry
Understanding the mechanism of interaction between cell and the nano and micro drug delivery systems is essential to the efficient design and safe application of drug targeting strategies (37). The cellular uptake can be described as a combination of attractive and adhesive interactions between the carrier and the plasma membrane and the driving force for wrapping (38,39). The driving force for wrapping can be described as the amount of free energy required to produce the deformation and drive the carrier to the internal medium of the cells (38). This process is dependent of some factors such as the size, shape, surface charge and surface chemistry of the carrier, rigidity of the plasma membrane and receptor abundance (38,39). Thus, the study and optimization of the impact of these parameters can lead to the development of smarter and safer drug delivery systems. This section is focused on the significance of the characteristics of the surface of the nano and microcarriers in the context of their interaction with plasma membranes (Figure 2.5).
Figure 2.5 Factors that influence the cellular uptake of the nano and micro drug delivery
systems. The cellular uptake is dependent of factors of the carrier such as size, shape, surface charge and chemistry. In the feature chemistry we can considerate the surface composition, ligand density, hydrophobicity and hidrophilicity. On the other side, cell properties like the receptor internalizationlevels, internalization mechanism, phenotype, localization andalso the rigidity of the plasma membrane also affect the cellular uptake. (58)
9 It has being reported that the drug carrier size is not the only factor involved in the cellular uptake, however it is determinant to that process (1,4,37,40–43). Theoretical models and its supported experimental evidence have suggested that to achieve effective cellular uptake, NPs must have a minimum size of 30-50 nm (44–48). This minimum range of size seems to be necessary to produce the required driving force for wrapping, leading to the deformation and invagination of the plasma membrane. Each cell can have differential levels of expression of target receptors, leading to an enhancement of the recognition of certain ligands. It should be noted that the range of sizes above mentioned corresponds to the scenario where the concentration of ligand on the NPs surface, when present, and the receptor abundance are not limiting factors. In addition, it was observed in
Acanthamoeba that large carriers roughly with 250 nm -3 m are faster internalized than particles with diameters less than 250 nm (41,49) . The different mechanisms of internalization displayed by the cells also contribute to different uptake mechanisms of drug carriers in terms of size (1,3,42). Actually the nonphagocytic mechanism allows the internalization of fluids and soluts. The phagocytic mechanism allows the internalization of large particles i.e more than 0.5 m. In this way, NPs are preferently internalized by other endocytic processes that are not restricted to phagocytic cells (42,50). However, MPs are preferentially internalized by phagocytosis in phagocytic cells such as macrophages, neutrophils, monocytes and dendritic cells. MPs can be also non-specifically internalized by macropinocytosis, when their diameters range from 0.5 m to 10 m (3). There is evidence that other types of cells, referred as nonprofessional phagocytes like fibroblasts, epithelial and endothelial cells can display the phagocytic mechanism but at a lower extent (3,41). Dendritic cells have shown an optimal uptake of particles with diameters up to 10 μm (37). Regarding macrophages, they have shown that the optimal diameter of particles is up to 30 μm (37). Considering the efficient permeation in biological barriers, the nano sized drug delivery systems are usually more efficient than the larger ones and so NPs have higher rate of uptake compared to MPs (15,51). NPs penetrate throughout the submucosal layers while MPs stay mainly in the epithelial lining; some NPs can cross the blood-brain barrier through the opening of tight junctions by hyperosmotic mannitol, passing through the capillaries after their injection and achieving the stability in blood circulation (15,51). Thus, for targeted drug delivery, the size of 100 nm or less are usually preferred (15,51).
Polymeric particle surface charge is a parameter that highly affects the uptake and therefore, the selectivity and efficiency of all drug delivery systems (50). Surface charge is the result of the chemical nature of the polymer matrix, the stabilizing agent and the pH of the dispersant medium (37). Evidence suggests that cells preferentially take up charged micro and nanocarriers instead of the neutral ones (3,42,52,53). To the positive carriers is associated a high rate of uptake and internalization, that can be explained by the ionic interactions between cationic polymers of the particles and the negative charge of the plasma membrane of the target cells (37). MPs and NPs containing cationic polymers, like stearylamine-coated PEG-co-PLA, PLGA modified with PLL and CH, are a good example of this finding (42) . Yue et al. prepared positive, negative and neutral CH NPs with an average diameter of 215 nm and showed that positive charged CH NPs (ZP39.25 mV) allowed a significant increase of the amount and rate of cellular uptake in all the cell lines tested (54). However, there is also evidence of the uptake of negative nano and microcarriers. This mechanism is associate to a slower internalization, as compared with the positive counterparts (1,3). The involvement of non-specific interactions with non-specific receptors by electrostatic interactions can explain the uptake of negatively charged carriers. Electrostatic interactions with the positive site of the proteins of the plasma membrane can trigger their uptake (55). In addition, phenomenon like oxidative stress to the plasma membrane can favor the adhesion of negatively charged carriers (56). Lao et al. demonstrated that under normal conditions, fullerene NPs are repulsed by cerebral microvessel