Finance from the NOVA – School of Business and Economics.
The Effectiveness of Unconventional Monetary Policy on Equity Markets in the
Eurozone: A Cross-Country Analysis
Jeff Bausch – Student ID: 34443
A Project carried out on the Master in (Economics/Finance/Management) Program, under the supervision of:
André Castro Silva
1 | P a g e
Abstract
Within this research, the effects of exogenous innovations to the total assets of the ECB on European equity markets is measured and European financial integration of the stock markets is analysed. The estimation window is chosen for the period ranging between July 2007 and December 2017. The observations are split into two periods stretching from the summer of 2007 until the summer of 2012, to capture the impact during the time of crisis, and from August 2012 until December 2017, to analyse impacts in an environment of ≤0% interest rates. The analysis is conducted with a SVAR approach for both periods. Overall the results hint towards financial integration across the sampled stock markets, despite showing a negative lagged impact on equity returns following an expansion of the ECB’s total assets.
Keywords:
Unconventional Monetary Policy European Central Bank
Stock prices
2 | P a g e
1. Introduction
Ever since the establishment of the European Monetary Union (EMU), monetary policy across countries in the Eurozone is conducted by a single autonomous financial institution, the European Central Bank (ECB) (Benigno, P., & Lopez-Salido, J. D., 2006). Although the primary objective of the ECB is that of maintaining price stability, Pirovano (2012) stressed that financial markets are much more reactive than the real economy to monetary policy shocks. In particular, in the transmission mechanism, stock prices and, more generally, relative asset prices play an important role as a disruption in the financial markets can have a destabilising impact on the economy (Cassola N. & Morana C., 2012). Therefore, during times of crisis, when economies are in distress, more immediate feedback from financial markets are of use for monetary policy decision-making. Financial stability as an objective has as a consequence gained in importance since the global financial crisis in 2008, when conducting monetary policy decisions. A lot of economic and financial literature has been devoted to analysing the importance of including financial market behaviour to monetary policy decision-making. For the UK, Joyce, Miles, Scott, and Vayanos (2012) mentioned that Quantitative Easing purchases would put upward pressure on the prices of equity and other assets. In the euro area, Lo Duca, Fratzscher, and Straub (2014) concluded from their studies that unconventional monetary policies have a positive effect on asset markets following the crisis by increasing confidence. Regarding the euro area, it is important for investors that expectations and impacts display more homogenous behaviour within the monetary union (Kim, Moshirian, & Wu, 2005).
This paper therefore has the objective to add to the existing research available on financial integration of the member states in the Eurozone, and test whether irregularities in stock market reaction across euro area members exist when implementing unconventional monetary policy measures. In particular, this paper analyses whether there are different cross-country reactions in the measured euro area stock markets, estimated through variations in the local equity market
3 | P a g e index, to the application of the asset purchase programmes (APP) by the ECB. Financial theory suggests that if the Eurozone experiences a high level of financial market integration, monetary policy intervention ought not to have big differences across markets, due to risk sharing, which in turn leads to higher overall efficiency (Kim, Moshirian, & Wu, 2005). Nevertheless, during times of financial distress, markets can react in an even more unpredictable manner, and with a flight for safety by investors, markets can be affected differently (Joyce et al., 2012).
Furthermore, the motivation to only analyse the ECB’s monetary policy tools instead of local central bank shocks stems from the argument that European markets are already largely integrated in the union and regional shocks appear to be relatively larger than country specific shocks, with a tendency to further increase in that direction (Kim, Moshirian, & Wu, 2005). So, in other words, the nature of the EMU forms, in addition, part of this research by comparing whether the assumption of financial integration is justified.
Overall, the results found by this study ought to assist economic agents with the allocation of their capital and policy makers with their decision-making. The model used to assess the monetary policy shocks across the countries is a Structural Vector Autoregression (SVAR). This model is applied due to the fact that the structure of the model includes a feedback effect, meaning that the variables are allowed to affect each other (Enders, 2008). A fair share of empirical macroeconomic research relies on the structural VAR, such as Pirovano (2012), Gambacorta, Hofmann, and Peersman (2014), Boeckx, Dossche, and Peersman (2014), or Jarocinski and Karadi (2018), to name just a few. To test the effect of unconventional monetary on the chosen indexes, both tools by the ECB are included, the asset purchase programmes and the interest rate for the euro area. The ECB total assets growth rate, which ought to represent the asset purchase programmes, was selected to measure the unconventional monetary policy for the euro area while the change in the euro area interbank rate is taken to more effectively reflect the impact in the market of interest rate changes and announcements. The analysis thus
4 | P a g e is done by applying monthly data for the equity index returns, the balance sheet growth rate, and the changes in the interest rate. Furthermore, the CISS indicator and the VStoxx are included as exogenous variables to measure financial distress in the region. Impulse response functions are used to examine the behaviour of the stock prices in the different countries to a one standard deviation structural innovation to euro area unconventional monetary policy. Finally, robustness checks are conducted by measuring alternative specification estimations for the APP variable. Overall, the tests showed that the EMU experiences high levels of financial integration across financial markets due to similar behaviour of the equity indexes in response to unconventional monetary policy shocks. Nevertheless, the asset purchasing programmes by the ECB have a negative lagged impact on the measured equity indexes.
The remainder of this paper is structured as follows. In Section 2, the current discussion in the literature which analyses the interplay between monetary policy and stock price behaviour is laid out. The literature review furthermore provides a description of the ECB’s asset purchase programmes and highlights the importance of the EMU. Section 3 describes the econometric models applied. Section 4 provides a description of the data. In Section 5, the results are reported and analysed. And Section 6 concludes while proposing directions for further research.
2. Literature Review
2.1. Stock price behaviour following monetary policy shocks
The analysis of stock price behaviour following monetary policy shocks has been discussed thoroughly over the last two decades. Authors, such as Cassola and Morana (2004), Joyce et al. (2012) Pirovano (2012), or Lo Duca, Fratzscher, and Straub (2014) amongst others, have all used the objective of stock price stability for central banks to conduct monetary policy in their research. In an analysis by Bernanke and Gertler (1999), the authors mentioned how monetary policy should take equity prices into account due to the fact that large fluctuations in
5 | P a g e the stock prices can destabilise the economy. If the financial system is disrupted, it has negative effects on economic growth and can increase macroeconomic volatility (Kim, Moshirian & Wu, 2005). Furthermore, during crises, highly expansionary monetary policies do not necessarily raise inflation to the objective levels of central banks (Cuckierman, 2013). Joyce et al. (2012) also claimed that the impact of Quantitative Easing, when it comes to stimulating the economy, is difficult to measure since it may be subject to long lags. Hence, financial markets are a more adequate location to find a more direct effect of monetary policy. Inflation-targeting should therefore play a secondary role during financial crises in policy decision-making, while maintaining liquidity and confidence across markets should be emphasised more. In addition, Cassola and Morana (2004) stressed that asset prices may transfer relevant information for monetary policy. The focus thus jumps from inflation-targeting towards the different transmission channels of monetary policy. Multiple transmission channels relating conventional and unconventional monetary policy tools to financial markets have been researched in academia (Lo Duca, Fratzscher & Straub, 2014).
Krishnamurthy and Vissing-Jorgensen (2011) found that US Quantitative Easing was transmitted to asset prices via the signalling channel and via a reduction of the safety premium. For the Euro-area, Lo Duca, Fratzscher, and Straub (2014) measured the impact of four transmission channels, namely the Confidence Channel, the Bank Credit Risk Channel, the Sovereign Credit Risk Channel, and the International Portfolio Balance Channel. The authors concluded that equity markets are positively affected mainly through a rise in confidence and a decrease in risk aversion. To be more precise, expansionary monetary policy can affect financial asset prices by increasing confidence among economic agents which leads to higher capital flows towards riskier assets such as equity prices, instead of safer investment options like fixed income securities. The authors found that the ECB’s liquidity injections positively affected share prices of broad indexes and banking indexes in the “core” and the “periphery”
6 | P a g e of the euro area. Furthermore, their results show that the ECB’s asset purchase programmes caused a decline of risk aversion and uncertainty among investors. So, by taking decisive monetary policy actions, central banks can have the capability to restore confidence across markets, and in the financial system as a whole. This then may lead to lower risk premia and uncertainty, and a positive impact on asset prices.
Nevertheless, there are studies which claim that the effect of unconventional monetary policy on equity during crises is more difficult to measure since the APP would only affect these assets indirectly (Lo Duca, Fratzscher & Straub, 2014). Furthermore, the unconventional monetary policy tools were rather new and the transmission channels yet to be defined (Joyce et al., 2012). Henceforth, this paper ought to shed more light on the effectiveness of unconventional monetary policy on the equity markets.
2.2. Cross-country differences in the euro area
The interest in potential cross-country differences in monetary policy reactions stems from the paper by Dornbusch, Favero, and Giavazzi (1998), who mentioned that differences in monetary transmissions are highly undesirable within currency unions. With expectations of more trade flows and a higher financial integration within a currency union, stock market returns should in theory experience higher co-movements (Wälti, S., 2011). With the European Monetary Union, however, being subject to asymmetric real shocks in general, imbalances may occur in the euro area (Blundell-Wignall, 2012). Especially after the unfolding of the financial crisis into a sovereign debt crisis in Europe, with a steady and substantial capital outflow from banks in some of the peripheral countries, into banks of other euro area countries, a major imbalance within the euro-area financial system had been caused (Joyce et al., 2012). Blundell-Wignall (2012) further described how these imbalances and the caused liquidity issues did not only affect the banking system but the economy as a whole. The author furthermore mentioned that due to the lack of a single fiscal authority, local governments implemented policies on their
7 | P a g e own to avoid social pressures, which in the end led to the emergence of these imbalances. Previously, Kim, Moshirian, and Wu (2005) had already mentioned that the varying regulatory barriers across countries and markets may cause their financial integration to be inconsistent. So, a varying degree of convergence in financial market integration and in investment returns may be expected.
In general, analysing cross-country differences within a monetary is a trait nearly unique to the structure of the Eurozone. The currency union offers a natural setting to analyse differential impacts on financial market interdependence from individual developments between the members (Kim, Moshirian & Wu, 2005). The authors mentioned that countries such as Germany, France, and Italy, which have larger stock market capitalisations, are more integrated in the euro area financial system, thus experiencing higher levels of conditional correlations. Spill-overs in asset returns and volatilities may therefore occur, specifically when markets have persistent effects on other markets. In their analysis, Lo Duca, Fratzscher, and Straub (2014) found that the unconventional monetary policy tools have a smaller effect in Spain and Italy than in the whole of the euro area. Overall the authors concluded that for equity prices, monetary policies have more homogeneous effects in comparison with bond prices across the area.
Despite all the empirical results so far, financial market integration in a union tends to vary across time, which supplies incentives to conduct ongoing research of the market structures within the currency union (Kim, Moshirian & Wu, 2005). Especially, if random country-specific shocks cause the economies to be at different stages of the business cycle, leading to a lower level of homogeneity between the transmissions of central bank policy intervention across financial markets.
8 | P a g e 2.3. The Global Financial Crisis and Unconventional Monetary Policy Tools
Empirical studies show that conventional monetary policy intervention methods are amended significantly when a major economic event, such as a financial crisis, an economic depression, or a war occurs. With the outburst of the global financial crisis through the collapse of Lehman Brothers in September 2008, this pattern was proven to be repeated by policy makers (Cukierman, 2013). When the financial crisis further escalated into a sovereign debt crisis in Europe, economic agents lost confidence in the solvency of certain countries and markets, and a feedback loop between banking and sovereign credit risk started. The ECB’s response to avoid uncontrollable panic in the economy were a number of liquidity injection programmes through asset purchasing actions and other unconventional monetary policy tools. The main asset purchase programmes analysed by Lo Duca, Fratzscher, and Straub (2014), are the Supplementary Long-Term Refinancing Operations (SLTROs), the “Very” Long Term Refinancing Operations (VLTROs), the Securities Markets Programme (SMP), and later the Outright Monetary Transactions (OMTs) which began in 2008 and ended in 2014. The impact of the SMP was furthermore analysed in the paper by Eser and Schwaab (2016). Following these three programmes, the ECB announced in September 2014 the launch of the Private Asset Purchasing Programmes, which were extended in 2015 to government bonds and then in 2016 also included corporate bonds (Bulligan & Delle Monache, 2018).
The securities targeted in the SLTROs had maturities between six months and one year. For the VLTROs, the maturities were of three years. To address the illiquidity issues in the euro area, the ECB had introduced the long-term refinancing operations in March 2008. The SMP was implemented in May 2010 to address tensions in certain market segments. Although the SMP was primarily addressed at purchasing government bonds, the overall idea was to provide further liquidity. Then, in September 2012, the SMP was discontinued by the ECB and replaced with the OMT. The OMT had the mission to repair the monetary policy transmission
9 | P a g e mechanism and to avoid self-fulfilling bad equilibria (Lo Duca, Fratzscher & Straub, 2014). Following these actions, the European Central Bank added the Private Asset Purchase Programmes in 2014, which later included corporate bonds (Bulligan & Delle Monache, 2018). However, the length and magnitude of the purchase programmes by the ECB were never fully disclosed by the policy makers to the public.
As the main issue during crises is the demand for liquidity, the ECB's unconventional monetary policy had a primary focus on lending to financial institutions. However, one of the more important tools were the purchases of financial securities by the central bank. Throughout the duration of the global financial crisis and the European Sovereign Debt Crisis, the ECB’s balance sheet grew by nearly 270 percent from mid-2007 to the end of 2017. Overall, the implementation of these new monetary policy tools, like the several asset purchase programmes described above, which had the objective to fix the financial system, resulted in historically low interest rates (Blundell-Wignall, 2012). The crisis had therefore, in particular, been an important common factor in financial market dynamics and monetary policy conduct (Gambacorta, Hofmann & Peersman, 2014), leading to the motivation of this research paper.
3. Methodology
3.1 Econometric Model 3.1.1 Benchmark SpecificationSuch as in the studies by Gambacorta, Hofmann, and Peersman (2014), Boeckx, Dossche, and Peersman (2014) and Pirovano (2012), by which this econometric analysis is inspired, a Structural Vector Autoregressive (SVAR) model is applied for the estimation. According to Pirovano (2012), SVAR models are a popular instrument in macroeconomic and monetary analysis. They are used to analyse the effect of exogenous shocks in monetary policy on macroeconomic variables. In general, they can be used to establish some relevant stylised facts
10 | P a g e (Boeckx, Dossche & Peersman, 2014). Further studies such as Joyce et al. (2012) or Jarocinski and Karadi (2018) also relied on these measurement techniques.
The starting point of this study is the compact form of the Vector Autoregression: 𝐵𝑥𝑡= 𝛤0+ 𝛤1𝑥𝑡−1 + 𝛤2𝑥𝑡−2+ ⋯ + 𝛤𝑝𝑥𝑡−𝑝+ 𝜀𝑡
By multiplying both sides with B-1, a structural VAR model without exogenous variables, such as follows is obtained:
𝑥𝑡 = 𝐴0 + 𝐴1𝑥1+ 𝐴2𝑥2 +. . . +𝐴𝑝𝑥𝑝 + 𝑢𝑡
where xt is a (n x 1) vector of the n endogenous variables at time t, A0 is a (n x 1) vector of
constants, A1, …, Ap are (n x n) matrices of coefficients of the p lagged values of all
endogenous variables, ut is a (n x 1) vector of structural innovations, which are assumed to be
white noise. Nevertheless, the correlation among the residual estimates across the different countries is taken into account to capture (unobserved) factors that are common to all economies, while unconventional monetary policy shocks are simultaneously identified. The dependent exogenous variables in the model are the returns of the equity market indexes for six euro area countries (France, Germany, Ireland, Italy, Spain, and the Netherlands). The equity indexes ought to reflect the financial stock market behaviour for each of the tested economies in the sample. It is assumed that that an expansionary monetary policy action, such as a lowering of the interest rate and/or an asset purchase programme should exercise upward pressure on the equity index, thus resulting in a positive return. To quantify the asset purchase programmes, the ECB’s balance sheet growth is used. Studies by Gambacorta, Hofman, and Peersman (2014) or Boeckx, Dossche, and Peersman (2014) amongst others relied on the ECB total assets to capture the movement of the Asset Purchase Programmes. According to Boeckx, Dossche, and Peersman (2014), the dynamics of the ECB’s total assets most closely mirror the APP. Gambacorta, Hofman, and Peersman (2014) argued for the use of the ECB’s total assets since it represents a better proxy than M2 to measure the asset purchase and liquidity injection
11 | P a g e programmes. And finally, to capture the conventional monetary policy, the euro area interbank rate is included in the model, which ought to include the changes in the main refinancing rate, as well as the announcements by the central bank to change the rate. Finally, as a possible trigger for the unconventional monetary policy shocks, the CISS (Composite Indicator of Systematic Stress) indicator and the VStoxx are taken. Boeckx, Dossche, and Peersman (2014) as well included the CISS indicator to capture to overall euro area’s level of financial distress and economic risk. The authors furthermore argued for its inclusion in the analysis since the CISS indicator is supposed to deconcentrate exogenous changes in the ECB’s total assets from endogenous actions to financial turmoil and uncertainty. The VStoxx, also called the fear index, is supposed to capture the distress within the stock market of the euro area. Lastly, multiple dummy variables are included in the model to cushion the peaks of the changes in the ECB’s balance sheet, the interest rate, and in the CISS indicator.
3.1.2 Model Identification
First, it is assumed that there are only contemporaneous impacts from unconventional monetary policy actions on the equity returns to capture the direct shock of a purchase programme on the index. In addition, the CISS indicator and the VStoxx may also have a contemporaneous impact on the equity returns, to distinguish the effect of market turmoil on the stock market and identify monetary policy action.
Second, the model includes a weak form restriction for the lagged change in the ECB’s total assets, meaning that the effect is not restricted with any sign. This reasoning behind the lagged impact of the asset purchase programmes on the equity indexes stems from the assumption that the portfolio balancing channel takes place in the transmission of monetary policy into the financial markets, and that equities do not immediately experience upward pressure.
12 | P a g e Finally, just as assumed in Boeckx, Dossche, and Peersman (2014) and as well in Gambacorta, Hofmann, and Peersman (2014), financial strain does not increase following expansionary monetary policy, measured by an increase in the total assets of the ECB and a lowering of the interest rate. Including this assumption ought to restrict exogenous innovations to the balance sheet which have a moderating effect on financial stress from the endogenous reaction of the ECB’s total assets to financial strain (Boeckx, Dossche & Peersman, 2014). Following the same argumentation, it is furthermore assumed that the ECB’s total assets increase following a rise in the CISS or the VStoxx. The central bank is expected to act upon financial strain in the economy with expansionary unconventional monetary policy action to rebuild certainty and lower risk across financial markets.
4. Data
The SVAR model is estimated using monthly data from July 2007 until December 2017, for six euro area countries. The data for the equity index returns was retrieved from Bloomberg Terminal while data for the ECB’s balance sheet and the interbank rate were taken from the Federal Reserve Bank of St. Louis, and the data for the CISS was taken from the ECB Statistical Warehouse. The specific time window from the summer of 2007 until the end of 2017 is used as it includes the data of a year before the collapse of Lehman brothers, when the first assets were already purchased in larger bulks than usual by the central bank. It furthermore covers the complete window of the global financial crisis, and it measures the impact of all the different unconventional monetary policy packages by the ECB until the end of the APPs. Since the ECB exercised expansionary programmes which caused different market dynamics, as laid out in section 2, the dataset is broken into two time windows to compare the impacts during crisis and afterwards with a ≤0% interest rate. The first window stretches from July 2007, just over a year before the collapse of Lehman until July 2012, after which the main refinancing rate was set to 0 before it eventually turned negative. The second part starts right from when
13 | P a g e the first window ends, in August 2012, and stretches until December 2017, when the last bigger changes in the total assets of the ECB were observed.
Furthermore, in the analysis, all the countries in the dataset have adopted the euro, which also means that a higher stock market correlation and spill-over effects may be expected due to the expected financial integration into the European Monetary Union (Pirovano, 2012). The inclusion in the dataset of countries which had adopted the euro way before the global financial crisis has the motivation to analyse the level of the above-mentioned financial integration of the different economies and compare the behaviour of their equity markets during the financial crisis, and in particular the impact of the various asset purchasing programmes on them. To further emphasise the importance of integration of the financial markets in the EMU, all the variables in the model are, except for the local equity indexes, euro area-wide.
5. Results
To determine the appropriate lag length for the model, the Akaike information criterion and the Schwartz criterion were used as in Pirovano (2012), resulting in an optimal lag-length of one lagged period for both measurement windows. Additionally, based on the results in the studies done using the same variables over similar or identical time-windows (Gambacorta, Hofmann, & Peersman, 2014, Boeckx, Dossche, & Peersman, 2014), stationarity of the variables is assumed a priori to the estimation. And, due to the fact that the dataset was split into smaller estimation windows, changing dynamics of the markets and variables are generally taken into account in this study. Finally, to avoid possible misspecification errors, no long-run relationships are imposed in the model, following the procedure by Pirovano (2012).
5.1. First Window (July 2007 until July 2012)
First, the impacts and effects of the ECB’s conventional and of its unconventional monetary policy, as they go hand-in-hand, are measured over the period which stretches from the summer 2007 until the summer in 2012. This first window ought to capture the first
14 | P a g e noticeably larger growth in the ECB’s total assets, observed in July 2007, the unfolding of the credit crisis into a global financial crisis, and eventually include its transformation in Europe into a Sovereign Debt Crisis in 2010 until its end in 2012. Within this period, the European Central Bank exercised several security purchasing programmes with the objective to provide liquidity across markets and institutions, and restore confidence amongst economic agents.
For all measured markets, it was found that the dummy variables which were supposed to smoothen the peaks in the period-by-period changes of the ECB’s total assets and the CISS indicator had a statistic significance and improved the model’s overall stability for all cases. For the first period, dummy variables for the peak in the CISS indicator in the summer of 2007, for the peak in the ECB’s total assets in December 2007, for the peaks in the CISS indicator and the ECB’s total assets in October 2008, and finally for the peak in the CISS indicator in June 2010. The choice of when to include dummy variables in the model was based on a mixture of pre-determined variable level for the period and statistical significance in the model, while improving the model’s overall fit. The only change done to the baseline model in the estimation was in the analysis of the Italian equity market where the impact of the lagged equity returns was included in the model, meaning that past performance of the stock market was partly an indicator for future performance of one period.
5.2. Second Window (August 2012 until December 2017)
This part describes the impact of the ECB’s policies for the time window stretching from August 2012 until December 2017. It was assumed that the markets, and financial markets in particular, exercise a different behaviour with respect to unconventional monetary policy shocks in a ≤0% interest rate environment. As for the analysis of the first time-window, a dummy variable deemed necessary to cushion the large drop in the euro area interbank rate in the winter months of 2015. A further deviation from the benchmark model was that the lagged performance of the equity index did not influence the interest rate.
15 | P a g e 5.3. Impulse Response Functions
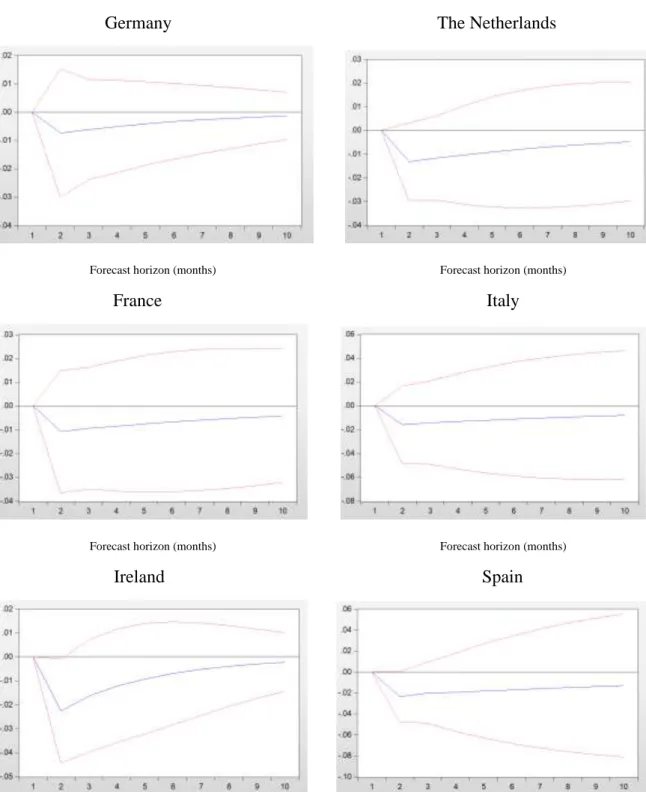
The Impulse Response Functions (IRF) of one innovation shock to the ECB’s total assets can be seen below in Figure 1 for the first window of measurement in Figure 2 for the second window of measurement.
Germany The Netherlands
Forecast horizon (months) Forecast horizon (months)
France Italy
Forecast horizon (months) Forecast horizon (months)
Ireland Spain
Forecast horizon (months) Forecast horizon (months)
Fig. 1. Responses of the equity price index to a +1 standard deviation to the ECB’s total assets (±2 standard errors)
16 | P a g e The IRFs were estimated using the Cholesky approach with the degrees of freedom adjusted. The maximum of periods measured was 10 for each market in both time-windows. Overall, only an innovation shock to the ECB’s total assets on the equity indexes was measured, with the prior motivation to analyse the central banks unconventional policy tools only. Within the figures, the shocks are displayed by the blue lines while the red lines represent the 68 percent posterior probability regions of the estimated responses.
While the magnitudes of the shocks differ between the individual markets, the dynamics appear relatively similar, hinting towards financial integration of the stock markets in the European Monetary Union, confirming the findings by Lo Duca, Fratzscher, and Straub (2014).
Focussing on the responses of the equity markets in the first time-window, it can be noted that the stock markets exercise a relatively fluctuating behaviour following the innovation shocks. In particular, it can be observed in Figure 1 that the response after one period is negative for all markets. Although the equity returns bounce back to positive values in the following period (except for Ireland), the contemporaneous effect of changes in the ECB’s total assets is, in contrast, positive as indicated by the output of the SVAR model (except for the Netherlands and Ireland), ranging between 0.154 (for Germany) and 0.443 (for Spain).
Although it is expected that expansionary monetary policy ought to boost the economy and increase the overall equity returns, there are possible explanations where this negative relationship might stem from, as already indicated in the paper by Joyce et al. (2012). While the expansionary nature of the monetary during the crisis has the objective to stabilise the financial system and markets, the transmission channels for the new tools is yet to be clearly defined. It may be the case that economic agents absorb the impact from the asset purchasing programmes via various transmission channels, amongst the portfolio balancing channel leaving investors to sell riskier assets, such as stocks, for safer ones, which consequently leads to drops in the indexes. Another reason would be, since the purchase window nor the target
17 | P a g e assets were never fully disclosed, investors were left below their expectations and the confidence level across financial markets could not sufficiently be increased to positively affect equity markets.
Germany The Netherlands
Forecast horizon (months) Forecast horizon (months)
France Italy
Forecast horizon (months) Forecast horizon (months)
Ireland Spain
Fig. 2. Responses of the equity price index to a +1 standard deviation to the ECB’s total assets (±2 standard errors)
18 | P a g e Focussing now on the analysis of the ECB’s policies after the crisis and in a zero percent or lower interest rate environment, the second time-window of this research shall be discussed. While, just as for the first window, the responses of the indexes exercised similar behaviour across markets. Nevertheless, a positive shock to the ECB’s assets leads to a drop in the equity indexes in the euro area. A possible explanation for this outcome might stem from the decrease in the ECB’s total assets following the highly expansionary programmes during the crisis matched with a recovery across markets. In other words, while the ECB’s balance sheet is shrinking, equity prices are increasing as a sign of economic growth.
5.4. Robustness Checks
This section analyses the robustness tests done on the econometric model used in this research paper. Since the analysis consists mainly in the impact of the unconventional monetary policy by the ECB, the alternative to the baseline specification differs by replacing the ECB’s total assets with the M3 aggregate for the monetary area. Since the asset purchasing programmes had amongst their objectives to inject liquidity into the market, the monetary aggregate for the euro area could provide a change in liquidity within the monetary union. Other authors, like Gambacorta, Hofmann, and Peersman (2014) also relied on the monetary base as an alternative to capture the central bank’s unconventional monetary policy. The decision to opt for the M3 aggregate was taken since the variable includes in addition to the components of the M2 aggregate as well the repurchase agreements, the money market fund shares and money market paper, and debt securities, which overall ought to cover the financial market dynamics across the euro area. The procedure of the robustness tests was inspired by Gambacorta, Hofmann, and Peersman (2014).
While the response functions exercise a closer behaviour in the second time-window than in the first time-window, several reasons can be discussed to possibly explain the differences. First, for the first window, which is illustrated in Figure 3 above, the monetary aggregate
19 | P a g e experienced fewer fluctuations in comparison to the central bank’s total assets. Since the equity indexes are more volatile (8.66% volatility on average) than the M3 aggregate (0.52% volatility on average), the stock indexes behaviour can therefore not be explained using the monetary variable.
Germany The Netherlands France
Forecast horizon (months) Forecast horizon (months) Forecast horizon (months)
Italy Ireland Spain
Forecast horizon (months) Forecast horizon (months) Forecast horizon (months)
Fig. 3: Responses of the equity index to a +1 standard deviation innovation to the euro area M3 aggregate (±2 standard errors) for the period between July 2007 and July 2012
Germany The Netherlands France
Forecast horizon (months) Forecast horizon (months) Forecast horizon (months)
Italy Ireland Spain
Forecast horizon (months) Forecast horizon (months) Forecast horizon (months)
Fig. 4: Responses of the equity index to a +1 standard deviation innovation to the euro area M3 aggregate (±2 standard errors) for the period between August 2012 and March 2017
20 | P a g e Regarding the output (see Figure 4) for the second time window, between August 2012 and March 2017 (fewer observations available), the results for the model appear more robust. Again, the equity indexes decrease a period later following a shock to the M3 aggregate. A possible explanation for this behaviour may stem from the reason that investors, after certainty was restored in the economy, moved their assets from more liquid money funds to more illiquid investments, or investments which are not within the M3 aggregate. In other words, with a capital outflow from investments within the M3 aggregate into other investments, the negative relationship between both variables is established. And furthermore, with less liquidity provided by the central bank, both variables did not increase simultaneously.
6. Conclusion
In this paper, the effects of unconventional monetary policy were measured on European equity markets with a SVAR approach. The ECB’s asset purchasing programmes were analysed over a total period stretching from mid-2007 until the end of 2017, while splitting the estimation window into two periods. Within the SVAR model, exogenous innovations to the ECB’s total assets were identified and the dynamic effects were estimated in the stock markets of six euro area countries to test for their financial integration in the EMU.
Overall, while the ECB’s expansionary unconventional monetary policy tools could not positively impact the equity markets across the analysed countries, observing similar effects nevertheless indicates the financial integration of the individual markets into the whole financial system of the European Monetary Union. This may therefore imply that European monetary policy will affect the markets in the same direction with, nevertheless, differences in magnitude.
For future research it would be interesting to analyse the exact dynamics of equity markets during crisis, and during times of ≤0% interest rates within the economy. This would permit to
21 | P a g e identify more precisely the impact of unconventional monetary policy and better determine the transmission channels for the asset purchase programmes within the euro area.
22 | P a g e
Bibliography
Benigno, P., & Lopez-Salido, J. D. (2006). Inflation persistence and optimal monetary policy in the euro area. Journal of Money, Credit, and Banking, 38(3), 587-614.
Bernanke, B. S., Gertler, M., & Gilchrist, S. (1999). The financial accelerator in a quantitative business cycle framework. Handbook of macroeconomics, 1, 1341-1393.
Bulligan, G., & Delle Monache, D. (2018). Financial markets effects of ECB unconventional monetary policy announcements. Bank of Italy Occasional Paper, (424).
Blundell-Wignall, A. (2012). Solving the financial and sovereign debt crisis in Europe. OECD Journal: Financial Market Trends, 2011(2), 201-224.
Boeckx, J., Dossche, M., & Peersman, G. (2014). Effectiveness and transmission of the ECB's balance sheet policies.
Cassola, N., & Morana, C. (2004). Monetary policy and the stock market in the euro area. Journal of Policy Modeling, 26(3), 387-399.
Cassola, N., & Morana, C. (2012). Euro money market spreads during the 2007–? financial crisis. Journal of Empirical Finance, 19(4), 548-557.
Cukierman, A. (2013). Monetary policy and institutions before, during, and after the global financial crisis. Journal of Financial Stability, 9(3), 373-384.
Dornbusch, R., Favero, C., & Giavazzi, F. (1998). Immediate challenges for the European central bank. Economic Policy, 13(26), 16-64.
Enders, W. (2008). Applied econometric time series. John Wiley & Sons.
Gambacorta, L., Hofmann, B., & Peersman, G. (2014). The effectiveness of unconventional monetary policy at the zero-lower bound: A cross‐country analysis. Journal of Money, Credit and Banking, 46(4), 615-642.
23 | P a g e Jarocinski, M., & Karadi, P. (2018). Deconstructing monetary policy surprises: the role of information shocks.
Joyce, M., Miles, D., Scott, A., & Vayanos, D. (2012). Quantitative easing and unconventional monetary policy–an introduction. The Economic Journal, 122(564), F271-F288.
Kim, S. J., Moshirian, F., & Wu, E. (2005). Dynamic stock market integration driven by the European Monetary Union: An empirical analysis. Journal of Banking & Finance, 29(10), 2475-2502.
Krishnamurthy, A., & Vissing-Jorgensen, A. (2011). The effects of quantitative easing on interest rates: channels and implications for policy (No. w17555). National Bureau of Economic Research.
Lo Duca, M., Fratzscher, M., & Straub, R. (2014). ECB Unconventional Monetary Policy Actions: Market Impact, International Spillovers and Transmission Channels. Policy Research Working Paper, (6820).
Pirovano, M. (2012). Monetary policy and stock prices in small open economies: Empirical evidence for the new EU member states. Economic Systems, 36(3), 372-390.
Wälti, S. (2011). Stock market synchronization and monetary integration. Journal of International Money and Finance, 30(1), 96-110.