Universidade de Aveiro Departamento de Química 2016
CELINA
CRISTALIZAÇÃO DE VITAMINA D
3EM CONTÍNUO
RODRIGUES
DE OLIVEIRA
CRYSTALLIZATION OF VITAMIN D
3IN CONTINUOUS
FLOW
Universidade de Aveiro Departamento de Química 2016
CELINA
CRISTALIZAÇÃO DE VITAMINA D
3EM CONTÍNUO
RODRIGUES
DE OLIVEIRA
CRYSTALLIZATION OF VITAMIN D
3IN CONTINUOUS
FLOW
Dissertação apresentada à Universidade de Aveiro para cumprimento dos requisitos necessários à obtenção do grau de Mestre em Engenharia Química, realizada sob a orientação científica do Professor Doutor Volker Hessel, Professor do Departamento de Engenharia Química da Universidade de Tecnologia de Eindhoven, e do Professor Doutor Carlos Manuel Silva, Professor Auxiliar do Departamento de Química da Universidade de Aveiro.
o júri Prof.ª Doutora Maria Inês Purcell de Portugal Branco
Professora Auxiliar do Departamento de Química da Universidade de Aveiro
Doutor António Augusto Areosa Martins
Investigador de Pós-doutoramento do Laboratório de Engenharia de Processos, Ambiente, Biotecnologia e Energia, Faculdade de Engenharia da Universidade do Porto
Prof. Doutor Carlos Manuel Silva
Professor Auxiliar do Departamento de Química da Universidade de Aveiro
acknowledgments To Professor Volker Hessel, thank you for all your kindness, thank you for your optimistic advices, and thank you for your support since my first day in the Chemical Reactor Engineering Group.
To Professor Carlos Manuel Silva, thank you for all your support and advice, thank you for always making yourself available in order to help me, and thank you for all your kindness.
To Marc Escribà, first of all, thank you for your friendship. Thank you for all the joy that you spread in the laboratory all day long, and thank you for all your encouragement while we were giving life to this project.
To Dora and Mathew, thank you for your friendships, for all the advices and encouragement, and thank you for always trying to help me seeing the challenges encounter from another perspective.
To Elnaz and Rohit, thank you for your guidance, thank you for your kindness, and thank you for your patience, throughout all the year that I have been in the Chemical Reactor Engineering Group, essentially in my first days working in the laboratory.
To Marlies, Erik, Carlo and Peter, thank you for all your patience, thank you for always making yourselves available to help me in any way possible with any and every kind of challenge encounter during my research project. To Raquel and Jorge Karam, thank you for all your support, all your advice and criticism, and essentially thank you for your selfless friendship.
To Ana, Joana, Jorge, Michael, Martinique and Patrícia, thank you for your amazing friendship during this long five years.
To my parents, for all their effort, hard work and belief that allowed me to be here today, an enormous thank you.
palavras-chave Anti-solvente, cristalização, escala micro, operação em contínuo,vitamina D3
resumo A vitamina D3 é um micronutriente essencial para o metabolismo do cálcio,
sendo esta maioritariamente sintetizada na pele do ser humano, quando exposta a radiação UVB. Contudo, inúmeros factores têm vindo a reduzir a nossa exposição à luz solar, diminuindo assim os níveis de vitamina D3 no
corpo humano a nível global e aumentando a preocupação por parte de diversas instituições médicas a nível mundial. Para superar esta deficiência em vitamina, a vitamina D3 tem sido adicionada à alimentação humana
através de alimentos fortificados e de suplementos alimentares. Para satisfazer a procura da população em vitamina D3, este trabalho apresenta
uma unidade de cristalização com dois estágios que opera em contínuo à escala micro. O objectivo deste trabalho é projectar e optimizar esta unidade de cristalização por forma a desenvolver uma unidade de produção de cristais de vitamina D3 mais económica, mais sustentável, e com elevado rendimento
de cristais aproriados para aplicações farmacêuticas.
O primiero estágio da unidade de cristalização projetada corresponde a uma coluna de vidro onde a nucleação é intensificada através de cristalização por evaporação e por adição de anti-solvente. Este cristalizador opera a 40 ºC e o caudal volumétrico é controlado manualmente. O segundo estágio é um cristalizador tubular onde a cristalização ocorre por redução da temperatura para promover o crescimento dos núcleos produzidos no estágio anterior. Esta é operada a 7 ºC e em 59 s de tempo de residência. Após o segundo estágio, um filtro está integrado no sistema para recolher os cristais de vitamina D3 sintetizados.
Este trabalho está dividido em duas partes. A primeira abrange a optimização da unidade de cristalização, a qual foi conseguida estudando o efeito da razão volúmica entre o anti-solvente e o solvente no desempenho da cristalização. O melhor resultado foi obtido para a proporção volúmica de 3, a qual permitiu alcançar 52 % de rendimento absoluto e 60 % de eficiência de filtração. Adicionalmente, por forma a melhorar o rendimento e a eficiência de filtração, ensaios experimentais foram realizados onde a corrente de permeado (da filtração) foi reciclada. Porém, as melhorias esperadas não se verificaram, o que significa que ensaios experimentais adicionais são necessários para sustentar uma conclusão sólida relativamente ao efeito do reciclo no processo em estudo. A reprodutibilidade do processo desenvolvido e optimizado também necessita ser melhorada.
A segunda parte corresponde à caracterização dos cristais de vitamina D3
produzidos durante os ensaios de optimização. Os cristais apresentam uma forma prismática e aglomeração significativa. A distribuição de tamanhos dos cristais é ampla, extendendo-se desde, aproximadamente, 0.25 μm a quase 500 μm. Adicionalmente, a estrutura dos cristais produzidos não corresponde à estrutura termodinamicamente mais estável. Excluindo o seu hábito, as características dos cristais produzidos não são adequadas para aplicações na indústria farmacêutica. No entanto, sugestões são apresentadas para melhorar ambas as características dos cristais e a optimização do processo.
keywords Anti-solvent, continuous operation, crystallization, microscale, vitamin D3
abstract Vitamin D3 is an essential micronutrient for calcium metabolism, which is mainly
synthesized in the skin of the human organism when irradiated with UVB light. However, a variety of factors have been reducing our exposition to sunlight, and thus the levels of vitamin D3 in the body have been decreasing, rising the
concern of numerous medical institutions worldwide. To overcome such vitamin deficiency, the vitamin D3 has been added to the diet through fortified
food and dietary supplements. To address the population demands on vitamin D3, this project presents a two-stage crystallization unit that operates
continuously at a microscale. The aim of this project is to design and optimize this crystallization unit in order to develop an economical and sustainable high yield production unit of vitamin D3 crystals suitable for subsequent
pharmaceutical applications.
The first stage of the designed crystallization unit corresponds to a glass column where nucleation is enhanced by evaporation and anti-solvent crystallization. This crystallizer operates at 40 ºC and the volumetric flow rate is manipulated manually. The second stage is a tubular crystallizer where a cooling crystallization takes place to further grow the nuclei generated in the previous step; it is carried out at 7 ºC and 59 s of residence time. At the end of the second stage, a filter is placed to collect the synthesized vitamin D3 crystals.
This work is divided in two main parts. The first part comprehends the optimization of the crystallization unit, which was accomplished by studying the influence of the anti-solvent/solvent volumes ratio on the performance of the crystallization. The best results were obtained for the volume ratio of 3, where 52 % of absolute yield was achieved as well as 60 % of filter efficiency. Furthermore, other experiments were performed where the permeate stream (of the filtration) was recycled to improve both yield and filter efficiency. However, such expected improvements were not confirmed, which means that additional experiments are needed to support any reliable conclusion regarding the effect of recycling on the process. The reproducibility of the crystallization process developed and optimized needs to be improved as well.
The second part corresponds to the characterization of the crystals produced during the optimization assays. The crystals exhibit a prismatic habit and a significant degree of agglomeration. The crystal size distribution is large, extending from ca. 0.25 μm to almost 500 μm. Furthermore, the obtained solid-state form is not the thermodynamically stable one. Besides the crystal habit, the properties of the obtained crystals are not yet suitable for a pharmaceutical application. Nonetheless, suggestions of improvement are presented for both crystals characterization and optimization of the crystallization process.
i
List of Contents
List of Figures --- iii
List of Tables --- vii
Nomenclature --- ix
INTRODUCTION --- 1
LITERATURE REVIEW --- 7
Crystallization --- 7
Crystallization from solution --- 8
2.1.1.1. Nucleation --- 10
2.1.1.2. Homogeneous Primary Nucleation --- 10
2.1.1.3. Metastable limit --- 12
2.1.1.4. Heterogeneous Primary Nucleation --- 12
2.1.1.5. Secondary Nucleation --- 13
2.1.1.6. Crystal growth --- 13
Methods of Crystallization from solution --- 13
2.1.2.1. Cooling of the solution --- 13
2.1.2.2. Evaporative crystallization --- 14
2.1.2.3. Precipitation [13] [14] --- 15
2.1.2.4. Anti-solvent crystallization [13] --- 15
2.1.2.5. Selection of the crystallization method [13] --- 16
Continuous crystallization. Microfluidics crystallization --- 17
Microfluidics crystallization --- 18
Crystal Characterization --- 18
2.2.1. Crystal Properties --- 20
Crystal Habit --- 20
Crystal Size Distribution, CSD --- 21
Polymorphism --- 22
2.2.2. Characterization Methods --- 27
ii
2.2.2.2. Polymorphs characterization --- 28
MATERIALS AND METHODS --- 31
3.1. Continuous micro flow crystallization set-up --- 31
3.2. Solvent and Anti-solvent selection --- 33
3.3. Operating conditions --- 33
3.4. Residence time and volumetric flow rate --- 34
3.5. Optimization of the vitamin D3 crystallization process --- 35
3.5.1. Configuration 1 – Single cycle experiments --- 35
3.5.2. Configuration 1 – Recycle experiments --- 38
3.5.3. Configuration 2 – Single cycle --- 39
3.6. Characterization of vitamin D3 crystals --- 40
RESULTS AND DISCUSSION --- 41
4.1. Optimization of the vitamin D3 crystallization process --- 41
4.1.1 Configuration 1 – Single cycle experiments --- 41
4.1.2 Configuration 1 – Recycle experiments --- 45
4.1.3 Configuration 2 – Single cycle experiments --- 47
4.2. Characterization of vitamin D3 crystals --- 47
4.2.1. Crystal Habit --- 48
4.2.2. Crystal Size Distribution --- 50
4.2.3. Polymorphism --- 51
CONCLUSION AND FURTHER RESEARCH --- 55
5.1. Conclusions --- 55
5.2. Suggestions of future work --- 56
REFERENCES --- 57
Appendix A Operational temperature of second crystallization stage --- 61
Appendix B Configuration 1 – Single cycle experiments --- 63
Appendix C Configuration 1 – Recycle experiments --- 65
C.1. Preparation of feed mixtures --- 65
iii
List of Figures
Figure 1.1 Scheme of vitamin D3 production in the skin and further transformation into the endogenous hormone 1,25-dihydrocholecalciferol. [1] --- 2
Figure 1.2 Benefits of optimal levels of Vitamin D for the human being. [4] --- 4 Figure 1.3 Flow diagram of the manufacturing process of vitamin D3. [8] --- 5
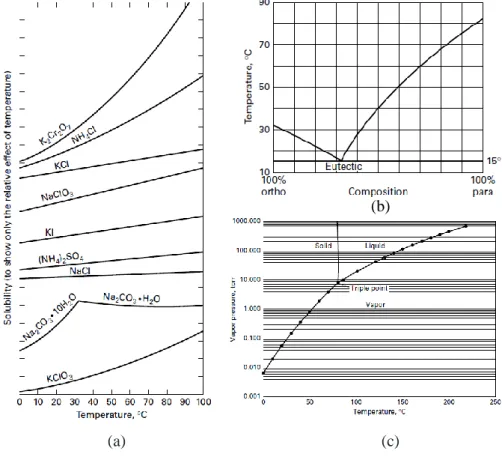
Figure 2.1 Phase diagrams characteristic of different crystallization systems: (a) Solubility curves of
diverse aqueous systems suitable for crystallization from solution; (b) Eutectic-forming system of ortho- and para-chloronitrobenzene suitable for melt crystallization; (c) Phase diagram of naphthalene, a compound suitable for vapor crystallization. [12] --- 8
Figure 2.2 Representation of a crystallization from solution phase diagram: solubility curve. [12] 9 Figure 2.3 The Gibbs free energy, ∆G , as a function of the radius, r, of a cluster. [11] --- 11
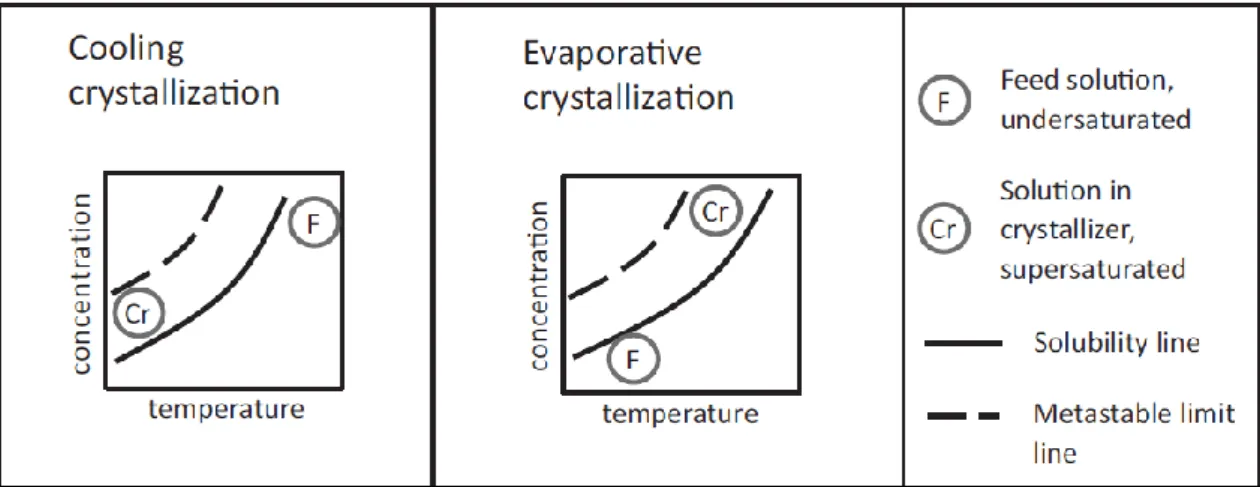
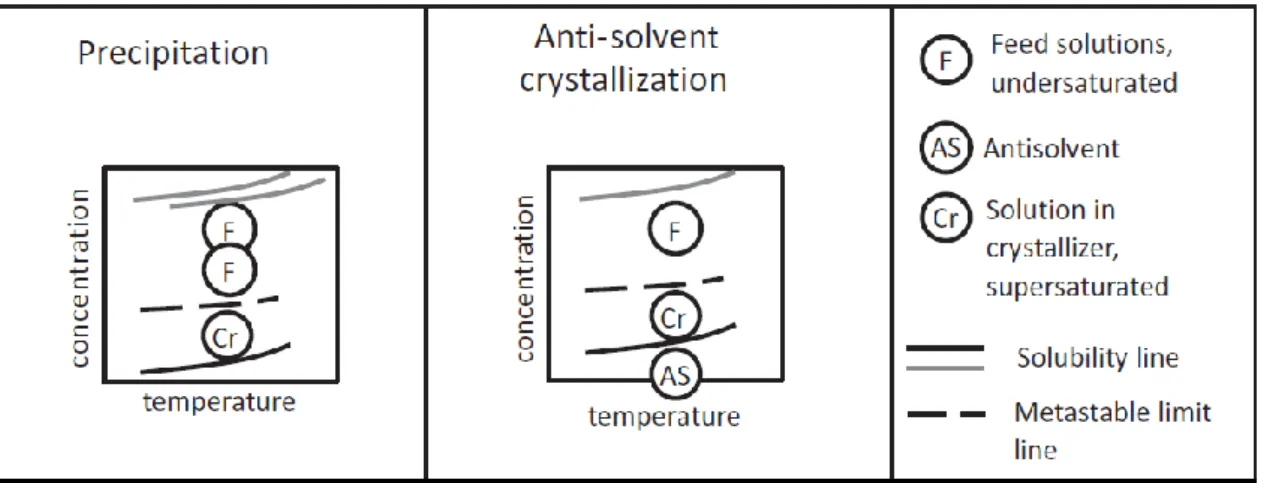
Figure 2.4 Scheme of the cooling and evaporative crystallization through a solubility curve. [11] 15 Figure 2.5 Scheme of precipitation and anti-solvent crystallization through a solubility curve. [11]
--- 16
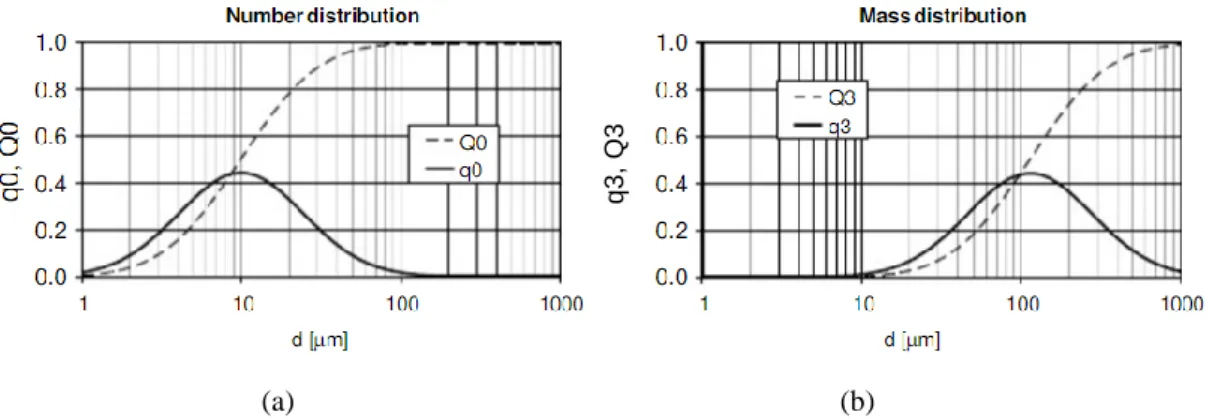
Figure 2.6 Crystal habits of a hexagonal crystal. [19] --- 20 Figure 2.7 Two different Crystal Size Distribution representations: (a) number distribution and (b)
mass distribution. Q0 and Q3 are cumulative distribution functions and q0 and q3 are differential distributions also known as density functions. [9] --- 21
Figure 2.8 Qualitative diagram of the supersaturation dependence of the nucleation rate, the growth
rate, and the crystal size, for a secondary nucleation system. [21] --- 22
Figure 2.9 Polymorphs of glutamic acid: (a) orthorhombic α-form and (b) orthorhombic β-form. [11]
iv
Figure 2.10 Photomicrographs showing the solution-phase polymorphic conversion of orthorhombic
paracetamol, needle-like habit, to monoclinic paracetamol, prismatic and platy habits. Micrograph (a) was taken at t = 0 minutes and (b) was taken at t = 30 minutes. The scale bars are equal to 250 μm. [19] --- 24
Figure 2.11 Qualitative energy-temperature diagram for an enantiotropic system, (a), and a
monotropic system, (b). The temperature regions of the stable forms are also represented. [9] --- 25
Figure 2.12 Qualitative representation of the solubility curves of a monotropic and enantiotropic
system. [11] --- 26
Figure 2.13 Qualitative diagram of the solubility curves of two polymorphs in an enantiotropic
system and of the corresponding metastable region limits. Ttransform corresponds to the transition temperature. [11] --- 27
Figure 2.14 PXRD of a sample of paracetamol that exhibits two different solid-state forms. [9] -- 28 Figure 2.15 Raman spectrum of a paracetamol sample. [9] --- 29 Figure 2.16 DSC thermogram of carbamazepine form III: a solid–solid transition of form III to form
I occurs at 170 ºC followed by the melting of form I at 190 ºC. [9] --- 30
Figure 3.1 Scheme of the unit for crystallization of vitamin D3 in continuous micro flow. --- 32
Figure 3.2 Solubility curve of vitamin D3 in acetonitrile: red curves correspond to the work of Liang et al. and blue curves correspond to the batch study performed for the operation in consideration. 34
Figure 3.3 Scheme of the Configuration 1 of the set-up built for the crystallization of vitamin D3. --- 36
Figure 3.4 Photo of the set-up built for the single cycle experiments: (1) feed reservoir, (2) valve,
(3) first crystallizer, (4) second crystallizer, and (5) syringe pump.--- 37
Figure 3.5 Crystallization set-up for single cycle experiments: (a) first crystallizer, and (b) second
crystallizer and the syringe pump. --- 37
Figure 3.6 Scheme of the Configuration 1 of the set-up built for the crystallization of vitamin D3 where the permeate stream is recycled. --- 39
v
Figure 3.7 Scheme of the Configuration 2 of the set-up built for the crystallization of vitamin D3. --- 40
Figure 4.1 Mass percentage of vitamin D3 obtained from a constant 0.22 mol L-1 concentration in t-butyl methyl ether. The experiments were performed at crystallizer temperature of 7 ºC and 59 s of residence time. --- 42
Figure 4.2 Yield of crystallization taking or not into account the solubility of vitamin D3 in acetonitrile (7.3 mg mL-1 at 7 ºC). --- 44
Figure 4.3 Optical microscopy picture of vitamin D3 crystals obtained from experiments with anti-solvent/solvent volumes ratio of 3. --- 48
Figure 4.4 SEM pictures of a sample of vitamin D3 crystals obtained from experiments using anti-solvent/solvent volumes ratio of 3. (a) 20 μm scale, (b) 10 μm scale, and (c) and (d) 5μm scale. -- 48
Figure 4.5 Density function obtained from laser light diffraction of the vitamin D3 crystals produced during a 3 volumes ratio experiment. --- 50
Figure 4.6 PXRD patterns of the two solid forms of vitamin D3 characterized by Wang and his colleagues. [26] --- 51
Figure 4.7 Powder X-ray diffraction pattern of vitamin D3 crystals synthesized during experiments for a volumes ratio of 3. A diffractogram of a commercial sample is also shown for comparison. - 52
Figure 4.8 Energy-temperature diagram obtained for the two solid forms of Vitamin D3, form A and form B. [26] --- 52
vii
List of Tables
Table 1.1 Vitamin D content of different food products. [2] --- 3 Table 1.2 Classification of the concentration of 25-hydroxyvitamin D in the human’s blood. [3] -- 3 Table 3.1 Quantity of each compound for different mixtures with different anti-solvent/solvent
volumes ratios. --- 35
Table 4.1 Mass percentage of Vitamin D3 obtained from a total amount of 20 mg.--- 42
Table 4.2 Mass percentage of Vitamin D3 obtained from a total amount of 75 mg (0.22 mol L-1 in t-butyl methyl ether, solvent). --- 45
Table 4.3 Absolute crystallization yield and filter efficiency of each cycle for the Recycle
experiments. --- 46
Table 4.4 Comparison of absolute yield and filter efficiency between Single cycle experiments and
Recycle experiments. --- 46
Table A.1 Results obtained for the two-stage continuous crystallization performed under the
following conditions: temperature of the first crystallizer, 40 ºC; mean residence time in the second crystallizer, 59 s; volumetric flow rate,15 mL h-1; mesh of the filter, 10 μm; configuration of the process, Configuration 1. --- 61
Table B.1 Absolute yield of crystallization calculated by excluding the amount of vitamin D3 dissolved in the permeate stream (i.e., acetonitrile solution). --- 63
Table C.1 Quantity of each compound for different mixtures with different anti-solvent/solvent
volumes ratios. --- 65
Table C.2 Quantity of each compound for different mixtures with different anti-solvent/solvent
viii
Table C.3 Vitamin D3 mass obtained for the two-stage continuous crystallization performed under
the following conditions: temperature of the first crystallizer, 40 ºC; mean residence time in the second crystallizer, 59 s; volumetric flow rate,15 mL h-1; mesh of the filter, 2 μm; configuration of the process, Configuration 1. --- 66
ix
Nomenclature
Abbreviations
CSD Crystal Size Distribution
DSC Differential Scanning Calorimetry
ES Endocrine Society
FDA Food Drug Administration
IOF International Osteoporosis Foundation
IOM Institute of Medicine
MSMPR Mixed-Suspension Mixed-Product Removal
NMR Nuclear Magnetic Resonance
PFA Perfluoroalkoxy
PXRD Powder X-ray Diffraction
SEM Scanning Electron Microscopy
UVB Ultraviolet B
Greek Symbols
𝛾 Interfacial free energy (J m-2) 𝜂𝐷3 Absolute yield of vitamin D3 (%)
ηD3,𝑐𝑜𝑟𝑟𝑒𝑐𝑡𝑒𝑑 “Corrected” absolute yield of vitamin D3 (%)
𝜃 Wetting angle ( º )
𝜇𝑙𝑖𝑞𝑢𝑖𝑑 Chemical potential of the solute in solution (J mol-1)
𝜇𝑙𝑖𝑞𝑢𝑖𝑑,𝑒𝑞 Chemical potential of the solute in solution at the equilibrium (J mol-1)
x
𝜎 Relative supersaturation
𝜏 Residence time (s)
Δ𝜇 Chemical potential difference (J molecule-1)
∆𝐺𝑛𝑢𝑐𝑙𝑒𝑢𝑠 Gibbs free energy of a nucleus ( J )
∆𝐺𝑠𝑢𝑟𝑓𝑎𝑐𝑒 Gibbs free energy of cluster’s surface ( J )
∆𝐺𝑣𝑜𝑙𝑢𝑚𝑒 Gibbs free energy of cluster’s volume ( J )
∆𝐺ℎ𝑒𝑡𝑒𝑟𝑜𝑔𝑒𝑛𝑒𝑜𝑢𝑠 Gibbs free energy of a nucleus in heterogeneous primary nucleation ( J )
∆𝐺ℎ𝑜𝑚𝑜𝑔𝑒𝑛𝑒𝑜𝑢𝑠 Gibbs free energy of a nucleus in homogeneous primary nucleation ( J )
Symbols
𝑐𝑚 Metastable limit
𝑐𝑝,𝑚 Molar heat capacity at constant pressure (J mol-1 K-1)
𝑐𝑠 Solubility curve
𝑑50 Mean particle diameter (μm)
𝑑𝑖 Internal diameter of the tubular crystallizer (mm)
𝑘𝑎 Surface shape factor
𝑘𝑣 Volume shape factor
𝑚𝐷3 Mass of vitamin D3 (mg)
𝑚𝑓𝑒𝑒𝑑 Mass of vitamin D3 in the feed (mg)
𝑚𝑓𝑖𝑙𝑡𝑒𝑟 Mass of vitamin D3 collected in the filter (mg)
𝑚𝑓𝑖𝑙𝑡𝑒𝑟,1 Mass of vitamin D3 collected in the filter during Cycle 1 (mg)
𝑚𝑓𝑖𝑙𝑡𝑒𝑟,2 Mass of vitamin D3 collected in the filter during Cycle 2 (mg)
𝑚𝑚𝑎𝑥 Maximum mass of vitamin D3 that can crystallize (mg)
𝑚𝑝𝑒𝑟𝑚𝑒𝑎𝑡𝑒 Mass of vitamin D3 in the permeate stream (mg)
𝑚𝑝𝑒𝑟𝑚𝑒𝑎𝑡𝑒,2 Mass of vitamin D3 in the permeate stream obtained from Cycle 2 (mg)
𝑚𝑝𝑢𝑚𝑝𝑒𝑑 Mass of vitamin D3 pumped to the system (mg)
𝑚𝑝𝑢𝑚𝑝𝑒𝑑,𝑡 Total mass of vitamin D3 pumped to the system (mg)
𝑛𝐷3 Molar quantity of vitamin D3 (mole)
xi
x Temperature of the solution (ºC)
y Concentration of vitamin D3 in the solution (mmol L-1) 𝐶𝐷3 Molar concentration of vitamin D3 (mol L-1)
𝐹𝑖𝑙𝑡𝑒𝑟 𝑒𝑓𝑓. Filter efficiency (%)
𝐺 Gibbs free energy of formation ( J )
𝐻 Enthalpy ( J )
𝐻0 Enthalpy at 0 K ( J )
𝑀𝐷3 Molar mass of vitamin D3 (g mol
-1)
𝐿 Size of the cluster (m)
𝐿𝑡 Length of the tubular crystallizer (mm) 𝑄𝑣 Volumetric flow rate (mL h-1)
𝑆 Entropy ( J K-1 )
𝑆0 Entropy at 0 K ( J K-1 )
𝑆D3 Solubility of vitamin D3 in acetonitrile (mg mL
-1)
𝑇 Absolute temperature (K)
𝑉 Volume of the tubular crystallizer (mL)
𝑉𝐴𝑆 Volume of the anti-solvent (mL)
𝑉𝑚 Molar volume (m3 molecule-1)
Chapter 1
INTRODUCTION
Start where you are. Use what you have. Do what you can. Arthur Ashe
This chapter introduces the theoretical background of this research and contextualizes the problem of this research work. Furthermore, it presents the objectives of this research as well as the structure of the thesis.
1.1.
Vitamin D
Vitamins are nutrients needed in small doses and are not produced by the organism of a human being. Therefore, they need to be obtained through the diet. [1] Vitamin D is a fat-soluble steroid that comprises a group of molecules called calciferols. The most addressed calciferols for the human body are ergocalciferol and cholecalciferol, commonly known as Vitamin D2 and Vitamin D3, respectively. [2]
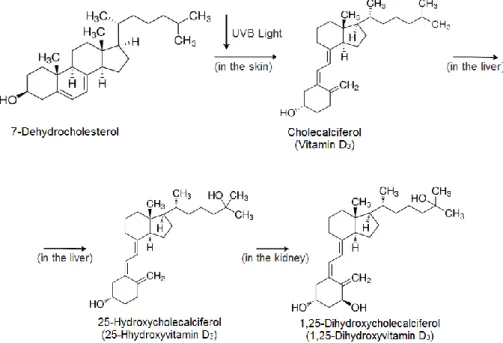
Vitamin D3 is mainly obtained through a photochemical reaction induced by the sunlight adsorbed in the skin. The compound 7-dehydrocholesterol, present in the basal and suprabasal layers of the epidermis, when exposed to ultraviolet B radiation, UVB, produces previtamin D3. The later undergoes a process that includes thermal isomerization from which vitamin D3 is produced. Vitamin D3 is not biologically active until enzymes functionalize it. Therefore, in the liver, vitamin D3 will be transformed in 25-hydroxycholecalciferol, also called 25-hydroxyvitamin D3. Further hydroxylation in the kidney will convert 25-hydroxycholecalciferol into 1,25-dihydroxycholecalciferol (see Figure 1.1). This compound is an endogenous hormone that regulates the calcium uptake in the intestines and the calcium levels in the bones and kidney. [1] [2]
Vitamin D2 is a plant-derived micronutrient which is produced in a similar way of vitamin D3. Moreover, vitamin D2 is also converted into a hormone named as 1,25-hydroxyergocalciferol, or 1,25-hydroxyvitamin D2. Both vitamins possess similar chemical structure and biological action.
Chapter 1 Introduction
2
However, vitamin D3 has been reported in many studies to be superior to vitamin D2 due to its higher bioavailability. [2]
Figure 1.1 Scheme of vitamin D3 production in the skin and further transformation into the endogenous
hormone 1,25-dihydrocholecalciferol. [1]
Besides its synthesis in the human body, vitamin D3 can also be obtained by the diet. The main naturally produced dietary sources of Vitamin D3 are animal food products. Examples are fat fishes and fish liver oils, which have the highest content in Vitamin D3 (see Table 1.1). Vitamin D2 has the highest content in wild grown mushrooms. However, the most commercialized mushrooms, the white button mushroom, have a very low level of that vitamin (see Table 1.1). Some producers even irradiate those mushrooms with UVB light to increase its content in vitamin D2. Vitamin D can also be found in eggs and in dairy products, such as cheese and butter. [2]
Both healthy diet and daily exposition to sunlight are necessary to reach the daily levels of vitamin D required by the human body. The vitamin D status of a human being can be evaluated by measuring the serum concentration of 25-hydroxyvitamin D. This substance is the main circulating form of vitamin D and it is used as a biomarker because it reflects the dietary intake of both vitamin D2 and D3, and the production of the endogenous hormone from vitamin D3. [2] Lips and his colleagues have defined four different levels for the concentration of 25-hydroxyvitamin D in the human’s blood (see Table 1.2). [3] Different institutions did not agree with the classification of 50 nmol L-1 as repletion level. The Institute of Medicine, IOM, has stated that 50 nmol L-1 should be defined as the concentration at which 97,5 % of the vitamin D in need would be covered. On the
Chapter 1 Introduction
3
other hand, the Endocrine Society, ES, has stated that the repletion level should start at 75 nmol L-1 rather than 50 nmol L-1. [2]
Table 1.1 Vitamin D content of different food products. [2]
Range μg Vitamin D per 100 g Raw products Fish Salmon 4.2 – 34.5 Perch 0.3 – 25.2 Tuna 1.7 – 18.7 Cod 0.5 – 6.9
Mushrooms Wild grown mushrooms 0.3 – 29.8 White bottom mushrooms 0 – 0.2
Animal products Pork meat 0.1 – 0.7
Chicken meat 0 – 0.3
Beef Liver 0 – 14.1
Eggs 0.4 – 12.1
Processed foods
Fish Tuna liver oil 144,400
Cod liver oil 137.5 – 575.0
Canned sardines 3.2 - 10
Mushrooms Irradiated Mushrooms 6.6 – 77.4
Dairy products Butter 0.2 – 2.0
Cheese 0 – 0.1
Table 1.2 Classification of the concentration of 25-hydroxyvitamin D in the human’s blood. [3] Concentration (nmol L-1) Classification < 12.5 Severe deficiency 12.5 – 25 Deficiency 25 – 50 Insufficiency >50 Repletion
The importance of keeping the levels of vitamin D superior to 75 nmol L-1 is essential for the bone metabolism. This vitamin is a key for a healthy bone development and reduces the risk of bone diseases like osteoporosis and rickets. [2] Furthermore, Grant and colleagues have reported the
Chapter 1 Introduction
4
benefits of vitamin D, well supported by research, in reducing the risk of many other diseases, such as cardiovascular diseases and cancer [4] (see Figure 1.2).
Figure 1.2 Benefits of optimal levels of Vitamin D for the human being. [4]
As a consequence of the dimension in the human body of the vitamin D impact, this compound can additionally improve the health economics of a country. Grant determined that a rise of 40 nmol L-1 in vitamin D levels would help save up to 16.7 % of health care costs. [4]
1.2.
Deficiency of Vitamin D
3Many organizations have identified vitamin D deficiency or insufficiency as a public health problem that has grown worldwide. [2] In fact, the International Osteoporosis Foundation, IOF, has developed a global vitamin D map to expose this problem. This map is a result of an extensive review of worldwide 25-hydroxyvitamin D plasma levels available in reliable published publications. In 2014, from an analysis of this map, Hilger has shown that 6.7 % of the overall population presented 25-hydroxyvitamin D levels below 25 nmol L-1, 37.3 % below 50 nmol L-1 and only 11.9 % of the population exhibited levels above 75 nmol L-1. [2] [5]
Many reasons can be associated to this worldwide vitamin D deficiency. To begin with, malnutrition, a condition where the diet does not match to provide the adequate level of vitamin D. Furthermore, the level of this vitamin is also dependent on the solar UVB radiation that reaches the skin. This changes with geographic latitude, season of the year and time of the day. Currently, other factors help reducing the exposition of the skin to sunlight. Those are severe air pollution in large cities, less outdoor activity as a consequence of an unhealthy life style change, and topical application of sunscreen with high sun protection factors. [2] The latter is a result of the intense solar radiation that can promote skin cancer, among other diseases. Consequently, exposition to sunlight must be moderated but regular to promote vitamin D synthesis. [2] [6] The immobility of elderly population
-20% Bone fractures -20% Cardiovascular diseases -25% Diabetes -25% Cancer & others -34%
Falling in elderly
-50% Multiple sclerosis
Chapter 1 Introduction
5
compromises their vitamin D levels as well as the decline of 7-dehydrocholesterol characteristic of aging. [2]
As the main source of vitamin D, more specifically vitamin D3, is being compromised, there is a need to improve vitamin D status worldwide by food fortification, or dietary supplements. Some countries have already taken measures to adjust the national recommendations for dietary intake of vitamin D. For example, the United States increased the daily intake for children since the first days of life. In 2008, the American Academy of Pediatrics increased the level for 400 IU and in 2010 the IOM increased it for 600 IU. In 2012, medical organizations from Germany, Austria and Switzerland also increased the recommended daily vitamin D intake to 800 IU for all age groups starting from 1 year of age. [2] Currently, Finland has already eradicated vitamin D deficiency due to mandatory food fortification. The first targets were children and adolescents by increasing the content of vitamin D in most milks, sour milks and yogurts. [7]
1.3.
Industrial production of Vitamin D
3To accomplish the goals established by different countries and to overcome the deficiency of vitamin D, this compound needs to be produced industrially as a pure crystalline vitamin. Currently, it is difficult to know how is being developed the production of vitamin D3 due to the competitive nature of the market. [8] Nevertheless, it has been found a process diagram of vitamin D3 manufacture process, dated from 1999 (see Figure 1.3). [9]
Figure 1.3 Flow diagram of the manufacturing process of vitamin D3. [9]
As it can be seen, there are two stages in the production of the vitamin D3, reaction stage and isolation stage. During the first one, 7-dehydrocholesterol is dissolved in an appropriate solvent, such as free peroxide diethyl ether, and then pumped to a UV-transparent reactor where the photochemical reaction is promoted. The second stage starts with the evaporation of the solvent of the outlet stream.
Chapter 1 Introduction
6
The latter is made of unconverted reactant, pre-vitamin D3, vitamin D3 and irradiation by-products. While the ether is being removed, another solvent is added to the mixture to promote the crystallization of the reactant in the next vessel. After the crystallization, that solvent is removed also by evaporation obtaining at the end vitamin D3 in a resin form. [9] This resin form is mainly used for supplementation of animal feeds. Concerning vitamin D3 for human consumption, in 2012, there was still no crystalline vitamin D3 form that was approved by U.S Food Drug Administration, FDA. [8] The separation and purification of vitamin D3 is quite difficult. The resin is often subject to an expansive low yield chemical complexation. [9]
Despite these challenges reported from 1999, the vitamin D3 market is expected to reach $2.5 Billion by 2020. [10] The key players in this market, such as Nestlé S.A. (Switzerland), Koninklijke DSM N.V. (The Netherlands), among others, are focusing on the expansion of their facilities and investing in R&D activities to gain a competitive edge through new product developments. [10]
1.4.
Objectives of the Thesis
The project named “Microprocessing photovitamin D3 using photo-high-temperature intensification” has been developed to satisfy the worldwide need of pure crystalline vitamin D3 suitable for pharmaceutical and food applications. That project aims to design an economical and sustainable high yield production unit for vitamin D3. The production unit under development is divided in three operation steps: synthesis of vitamin D3, purification of the synthesis outlet stream and vitamin D3 crystallization.
The work of this thesis is related with the last step of the unit, the vitamin D3 crystallization. This study aims to optimize the crystallization process through a microscale continuous flow operation, which enhances mass and heat transfer, and process control, as well as increases material throughput in lower residence time. Furthermore, this project aims to characterize the vitamin D3 crystals synthesized in order to assess their applicability in pharmaceutical industry.
1.5.
Outline of the Thesis
This thesis is organized in four parts. The first part, which corresponds to the second chapter, is a literature review where it is described the phenomenon of crystallization, are presented the advantages of a continuous crystallization in a sub-millimeter scale and is approached the characterization of crystals. Furthermore, there is a chapter where one describes the methods applied to achieve the goals of this thesis. The forth chapter is a sequence of the previous one, where the results are presented and discussed. Last but not the least, there is a chapter dedicated to the conclusions of this report where are highlighted the possible improvements in this study.
Chapter 2
LITERATURE REVIEW
Nothing in life is to be feared, it is only to be understood. Now is the time to understand more, so that we may fear less.
Marie Curie
The study developed is essentially based on the separation technique of crystallization. Therefore, this chapter initially presents a literature survey to clarify the fundamentals behind a crystallization phenomenon. This chapter will start with a general approach of crystallization and will grow further in crystallization from solution. Furthermore, this review will present a subchapter where it is discussed the operation mode of crystallization, continuous operation at a micro scale.
Crystallization
Crystallization is one of the oldest separation processes known by mankind. As an example, crystallization is the method responsible for the collection of sodium chloride crystals via evaporation of seawater. Scientifically crystallization is defined as “the phase transformation of a compound from a fluid or an amorphous solid state to a crystalline solid state”. [11] The crystalline solid state, also known as crystal, is ideally a pure three-dimensional ordered structure. The latter is stablished by forces at the molecular level actuating during crystallization. [12]
Crystallization is based on a phase change of at least one of the compounds of a mixture. Therefore, the phase diagram of the mixture is an important tool to better understand and operate the system. Depending on the phase diagram, different crystallization methods can be applied (see Figure 2.1). [11] [13] For example, Figure 2.1(c) describes the thermodynamic behavior of a compound easily crystallized from an inert gas phase without going through a liquid phase. That method is called crystallization from a vapor or desublimation. Melt crystallization is a method mostly applied to eutectic-forming systems (see Figure 2.1(b)). Eutectic is the composition of a binary liquid mixture where both compounds solidify at a specific temperature. Under that temperature, the compounds
Chapter 2 Literature Review
8
are theoretically obtained as pure solids. Melt is the name given to a eutectic-forming system as a homogeneous liquid phase. [14] Melt crystallization is mainly used as a purification operation due to high purity values achieved within this process, values close to 99.9 %. Figure 2.1(a) presents solubility curves of different compounds in an aqueous system. That phase diagram is the most suitable for the method called crystallization from solution. When this process is applied, highly pure crystals can be produce in a single crystallization stage, unlike melt crystallization. [13]
(a) (c)
Figure 2.1 Phase diagrams characteristic of different crystallization systems: (a) Solubility curves of diverse
aqueous systems suitable for crystallization from solution; (b) Eutectic-forming system of ortho- and para-chloronitrobenzene suitable for melt crystallization; (c) Phase diagram of naphthalene, a compound suitable
for vapor crystallization. [14]
Crystallization from solution
Figure 2.2. presents a solubility curve, cs. As mentioned in the previous section, that phase diagram is the most suitable for crystallization from solution. A solution is a homogeneous phase mixture of two or more compounds. The most abundant compound is generally called solvent and the remaining are called solutes. For a temperature T1, when the solute concentration in the solution is equal to point a (see Figure 2.2), the solution is said to be undersaturated. In this condition, the
Chapter 2 Literature Review
9
solid phase is always dissolved in the solvent, and the solution is always homogeneous. [13] [14] [15]
Figure 2.2 Representation of a crystallization from solution phase diagram where both solubility curve, cs,
and metastable limit, cm, are presented. [14]
If the concentration of the solute increases until point b, the chemical potential of the solute in solution, μliquid,eq , will be equal to the chemical potential of the solute as solid phase, μsolid. Therefore, the solution is in equilibrium with the solid phase of one of the solutes. In this condition, the solution is called saturated with respect to that solid phase, and the concentration of that solid phase is its solubility. [13]
The solubility of a solute is dependent on the temperature of the solution, and that dependency is described by the solubility curve (see Figure 2.1 and 2.2). [15] The concentrations of point e and f are solubility values as well. However, they are solubility’s of the same solute for distinct temperatures. Figure 2.2 presents a solubility curve, cs, that, like most of the systems, describes a system where the solubility of the solute increases when temperature increase. [14] [15] If the concentration of the solute further increases, point c, a solid phase starts to appear in the system. In this situation, the solution is said to be supersaturated with respect to the dissolved solute, and the chemical potential of the solute in solution, 𝜇𝑙𝑖𝑞𝑢𝑖𝑑, is now higher than the corresponding equilibrium value. The difference between the chemical potential of the solute in the supersaturated and the saturated states (see equation 2.1) is called supersaturation degree.
∆𝜇 = 𝜇𝑙𝑖𝑞𝑢𝑖𝑑− 𝜇𝑙𝑖𝑞𝑢𝑖𝑑,𝑒𝑞= 𝜇𝑙𝑖𝑞𝑢𝑖𝑑− 𝜇𝑠𝑜𝑙𝑖𝑑 (2.1)
The supersaturation degree is a prerequisite for crystallization and it is denominated as the driving force of the crystallization process. [15] The degree of supersaturation at point c is related with the concentration difference between points b and c. [14]
Chapter 2 Literature Review
10
Further increase in solute’s concentration will increase the degree of supersaturation until it achieves the supersaturation limit, point d. That limit is also known as metastable limit, cm. In the metastable region, a small amount of solute entities is formed and is stable in the solution which behaves like a suspension. At the metastable limit a reasonable amount of solid phase is formed and the crystallization spontaneously takes place. [13] [14]
The decrease of temperature can also supersaturate a solution. For example, from points f to d, the decrease in temperature decreases the solubility of the solute. Therefore, new solid phase appears driving the solution into the metastable region. From point e to c the same phenomenon is verified. Nevertheless, the decrease in temperature is still not enough for the solution to achieve the metastable limit and spontaneously crystallize. [14] [15]
The crystallization phenomenon starts with the development of crystals’ nuclei, step called nucleation. This step is followed by further development and growth of the nuclei until the final crystalline structure is obtained, step called crystal growth. Nucleation and crystal growth are the two dominant rate processes that characterizes crystallization from solution. The manipulation of these mechanisms influences most of the final properties of the produced crystals, such as number, crystal size distribution and habit. [13]
2.1.1.1. Nucleation
Nuclei can be obtained by solute entities that spontaneously start clustering together. In this specific case, nucleation is called homogeneous primary nucleation. However, in practice the primary nucleation phenomenon is mostly heterogeneous, i.e., spontaneous nucleation occurs in the presence of foreign particles in solution, such as dust or dirt. Moreover, nucleation can also be promoted by crystals of the crystallizing compound that are already present in the solution. In that situation, nucleation is called secondary nucleation. [13] [15]
2.1.1.2. Homogeneous Primary Nucleation
Primary nucleation, accordingly with the Classical Nucleation Theory, starts with the formation of clusters. These clusters are a result of the attachment and detachment of solute entities in the solution. In an undersaturated or just saturated solution, the formation and decay of clusters is in equilibrium and the solution is stable against new phase formation. When the solution reaches a supersaturation state, clusters of a critical size are formed that either fall apart or became nuclei that grow further. [13]
Thermodynamically, the attention falls into the Gibbs free energy of a nucleus, ∆𝐺𝑛𝑢𝑐𝑙𝑒𝑢𝑠. This is characterized by two energy terms, defined in equations 2.2 and 2.3 [13], and it has to verify the condition described by equation 2.4 for nucleation to occur [13] [16]:
Chapter 2 Literature Review 11 ∆𝐺𝑛𝑢𝑐𝑙𝑒𝑢𝑠 = ∆𝐺𝑣𝑜𝑙𝑢𝑚𝑒+ ∆𝐺𝑠𝑢𝑟𝑓𝑎𝑐𝑒 (2.2) ∆𝐺𝑛𝑢𝑐𝑙𝑒𝑢𝑠= − 𝑘𝜐𝐿3 𝑉𝑚 Δ𝜇 + 𝑘𝑎𝐿2𝛾 (2.3) ∆𝐺𝑛𝑢𝑐𝑙𝑒𝑢𝑠< 0 (2.4)
where 𝑘𝑣 and 𝑘𝑎 are volume and surface shape factors, 𝐿 is the characteristic length, 𝑉𝑚 is the molecular volume, ∆𝜇 is the chemical potential difference per solute molecule in the fluid and the solid, and 𝛾 is the interfacial free energy.
The first term, ∆𝐺𝑣𝑜𝑙𝑢𝑚𝑒, defines the energy variation due to the addition of a solute entity into a cluster, which is negative in a supersaturated solution. The second term, ∆𝐺𝑠𝑢𝑟𝑓𝑎𝑐𝑒, defines the energy variation associated with the surface increment of the cluster surface. This free energy term is positive, since the interfacial tension between nucleus and solvent is positive. [11] [13]
Figure 2.3 describes the behavior of the Gibbs free energy of a nucleus as the size of a cluster increases, assuming that a cluster has a sphere shape. As it can be seen, ∆𝐺𝑛𝑢𝑐𝑙𝑒𝑢𝑠 achieves a maximum value for a specific radius, 𝑟∗, which is the energy barrier that the system needs to overcome for nucleation to happen. For a radius below 𝑟∗, the ∆𝐺
𝑛𝑢𝑐𝑙𝑒𝑢𝑠 is positive and increases with increasing radius. [11] [13] A positive Gibbs free energy indicates that growth of a cluster is unfavorable, thus the system is not stable. Therefore, the clustering of solute entities below that critical size tend to decay in order to reduce the Gibbs free energy. When the cluster size is equal to 𝑟∗, the probability of adding or losing a solute entity is equal. The cluster is said to be in equilibrium with the supersaturated solution. As soon as the cluster has a radius superior to the critical value, the ∆𝐺𝑛𝑢𝑐𝑙𝑒𝑢𝑠 starts decreasing. The nucleus will continue to grow since attachment of solute entities reduces Gibbs free energy increasing the stability of the nucleus. Therefore, the nucleation will proceed spontaneously. [13] [16]
Chapter 2 Literature Review
12
The change in number of critical clusters within a certain time in a certain volume is defined as nucleation rate. [13] This rate is dependent on the degree of supersaturation of the system. For a small supersaturation degree, the system does not have enough energy for nucleation, and thus the nucleation rate will be also very small, practically zero. As the supersaturation degree of the system increases, the nucleation rate deviates considerably from zero. From that stage on, any supersaturation increment will rise the nucleation rate dramatically. Moreover, it is possible to notice nucleation at a macroscopic level. [11] [13]
2.1.1.3. Metastable limit
As mentioned before, the metastable zone is a region where the system is supersaturated. However, the solid phase already formed is stable in solution without spontaneously nucleating. [11] [15] The boundaries of this metastable zone are the solubility curve of the system and a theoretical line named metastable limit (see Figure 2.2). Above this limit is the labile zone where the system is still supersaturated but nucleation occurs spontaneously. [15]
The degree of supersaturation needed for spontaneous nucleation will define the width of the metastable zone. However, the experimental conditions and the characteristics of the system can also influence the metastable zone width. [11] [13]
2.1.1.4. Heterogeneous Primary Nucleation
Primary nucleation can also occur in the presence of foreign particles, which will spontaneously induce nucleation in their surface decreasing the associated Gibbs free energy. [11] The Gibbs free energy of nucleation in a surface, ∆𝐺ℎ𝑒𝑡𝑒𝑟𝑜𝑔𝑒𝑛𝑒𝑜𝑢𝑠, can be related with the Gibbs free energy of homogeneous nucleation, ∆𝐺ℎ𝑜𝑚𝑜𝑔𝑒𝑛𝑒𝑜𝑢𝑠, by a factor 𝜑 (see equation 2.5). Comparing the solute as solid phase with a droplet and assuming that the particle’s surface is flat, this factor is related with the wetting of the particle surface by a droplet which is characterized by the contact angle between the two interfaces, 𝜃. This angle indicates whether the presence of the substrate will substantially lower the nucleation barrier. The angle range is between 0 º and 180 º. For a 𝜃 = 180 °, 𝜑 = 1. For this situation, the droplet will not spread on the surface because is energetically not favorable. Therefore, the foreign particles do not support nucleation. On the other hand, for complete wetting, 𝜃 = 0 °, 𝜑 = 0. In this case, the droplet spreads on the surface and there is no energy barrier to overcome for nucleation to occur.
Chapter 2 Literature Review
13
The factor 𝜑 is always smaller than 1. Therefore, the heterogeneous nucleation will be always more energetically favorable than the homogeneous one. Moreover, the nucleation rates will be higher even for a lower degree of supersaturation. Attention needs to be given to this energy reduction in order to avoid the presence of impurities in the final crystals. [11] [13]
2.1.1.5. Secondary Nucleation
Crystals of the solute can exist in solution since the beginning of the process. Their presence will induce nucleation for a very low degree of supersaturation. This phenomenon is called secondary nucleation. There are a variety of mechanisms to promote secondary nucleation, but the most relevant is attrition breeding. In this method, the larger crystals collide with the impeller and the walls of the crystallizer and with other crystals becoming smaller crystals that act as nuclei. [13]
2.1.1.6. Crystal growth
In a supersaturated system, some solute entities will add to the nucleus produced through a 2-dimensional molecular self-assembling promoting the growth of the nucleus into the final crystals. This rate process is defined as crystal growth. The mechanism of crystal growth starts with the migration of solute molecules from the bulk solution to the nucleus surface. These molecules are adsorbed and then diffuse on the surface until they find a suitable site to integrate the crystal lattice. [14] [17] The conditions for crystal growth are optimal when the system is at the metastable zone. [18]
Methods of Crystallization from solution
Crystallization from solution can be operated in four different methods: cooling of the solution, evaporation of the solvent, precipitation by addition of a reactant and addition of an anti-solvent. The initial step to select the most suitable method for a specific system is by analyzing the solubility curve of the system. [13]
2.1.2.1. Cooling of the solution
In cooling crystallization, the supersaturation of a solution is promoted by decreasing the temperature (see Figure 2.4). This decrease will reduce the solubility of the solute promoting a mass transfer of the solid from the solution to the solid phase. As the solubility decreases more solute entities are in suspension supersaturating the solution. Further decrease of the temperature will start nucleation thus will start the formation of crystals. [11] [13]
Cooling crystallization is mostly applied for moderate to highly soluble solutes whose slope of solubility curve is positive and steep, i.e., slope usually higher than 0.005ºC-1. The feed and the
Chapter 2 Literature Review
14
crystallizer temperatures are usually lying in the temperature range of the steepest region of the solubility curve. Therefore, a reasonable large amount of solid is obtained for a small temperature range. [13]
The crystallizer temperature needs to be as low as possible to minimize the product loss. However, the yield of the crystallization will be restricted by the solubility of the solid at the lowest temperature of the process. This limitation is the main obstacle of cooling crystallization which can be overcome by recycling the solution upstream in the process. Otherwise the solution will be conducted to a second crystallization step like anti-solvent crystallization. [13]
From an energy point of view, cooling crystallization is the best option and is a simple operation. In stirred crystallizers, heat exchange can occur by indirect and direct cooling. Indirect cooling occurs via the scrapped or non-scrapped surface of the crystallizer. For systems with intense scale, direct cooling is a better option which is promoted by adding an immiscible liquid or gas, called refrigerant, into the solution. Vacuum cooling, also known as vacuum crystallization or flash cooling crystallization, can also be an option for intense scaled systems. The pressure in the crystallizer is kept below the vapor pressure of the solution. Therefore, the solvent flashes off and the solution is adiabatically cooled down until the boiling temperature of the solution for the crystallizer’s pressure. This operation is applied, for example, in multi-stage operation and in vapor recompression decreasing the energy consumption. [13]
2.1.2.2. Evaporative crystallization
Evaporative crystallization is a concentration-driven method promoted by decreasing the quantity of the solvent. The latter will rise the concentration of the solute in the solution supersaturating the system (see Figure 2.4). Further removal of the solvent will promote nucleation initiating crystals formation. [11]
Similarly, to cooling crystallization, evaporative crystallization is mostly used for moderately to highly soluble compounds. The solubility curve of the systems that undergo this crystallization method has a flat slope because cooling crystallization results in a low yield for those systems. However, evaporative crystallization can be applied regardless the solubility curve’s slope of the system. [13]
The majority of the evaporative systems are operated at high temperature, above 50 ºC, and use low pressure steam, 4 bar, or by-product steam, 1 to 2 bar, from another chemical process. This crystallization method, as well as cooling crystallization, is not suitable for thermally unstable compounds and solid solutions. [13]
The energy consumption of this method is higher than the cooling crystallization. In continuous evaporative crystallization, in order to reduce the energy demand, multiple-effect
Chapter 2 Literature Review
15
evaporation is applied. In this operation, the heat needed to vaporize the solvent in an effect is provided by the condensation of the solvent from a previous effect. Another option is a single effect evaporator with mechanical or thermal vapor recompression. These evaporators are denominated reduce-pressure evaporative crystallizers to distinguish them from vacuum cooling, which operates without an external heat source. Nevertheless, vacuum evaporation is often selected in order to take advantage of cooling and evaporation simultaneously. [13]
Figure 2.4 Scheme of the cooling and evaporative crystallization through a solubility curve. [13]
2.1.2.3. Precipitation [13] [14]
Precipitation is applied for substances whose solubility in a specific solution is very low. This method is mainly based in mixing two miscible reactant streams which will produce a solid compound sparingly soluble in the reaction mixture. If the reactant streams are highly concentrated, the solubility of the product will be largely exceed promoting a fast formation of the solid phase. [13] As a consequence of the high rate of nucleation, specifically primary nucleation, the crystals obtained will be small and are mostly aggregates and agglomerates. [14]
Precipitation promotes the deposition of impurities, such as polymorphs or amorphous materials, together with the product and a high agglomeration rate. In order to improve the quality of the solid phase, measures should be taken to reduce the supersaturation degree at the inlet of the crystallizer, such as decreasing the mixing time. [13]
2.1.2.4. Anti-solvent crystallization [13]
Anti-solvent crystallization is often coupled to a cooling crystallization step to recover the residual amount of a high added-value product due to the resulting high yields. The method is also suitable for heat sensitive substances that cannot undergo an evaporative or cooling crystallization.
Chapter 2 Literature Review
16
An anti-solvent is usually a liquid added to a solution in order to decrease the solubility of the solute in the mixture. The solubility reduction will depend on the ratio between the solvent and the anti-solvent abundancies. The addition of the anti-solvent also dilutes the mixture. Therefore, crystallization occurs if the effect of the decrease in solubility is higher than the dilution effect. For an aqueous solution, it is often used an organic liquid as anti-solvent. This will decrease the water activity decreasing the solubility of the solute in the mixture. Sometimes a highly soluble salt is added to the aqueous solution instead of a liquid. This method, called salting out, has the same result as the addition of the organic liquid. The presence of the salt decreases the water activity, thus the solubility of the solute decreases.
The solubility of the solute in this crystallization method is mostly very low which results in a large degree of supersaturation. As a consequence, the crystallization will be fast and the quality of the product will be low, similar to precipitation.
One of the disadvantages of this process is the need to separate the anti-solvent from the remaining mixture.
Figure 2.5 helps understanding how crystallization is promoted in the last two crystallization methods approached, as well as exhibits their similarity.
Figure 2.5 Scheme of precipitation and anti-solvent crystallization through a solubility curve. [13]
2.1.2.5. Selection of the crystallization method [13]
The most suitable crystallization method for a specific system is initially chosen based on thermodynamic considerations, which take into account the solubility curve of the solution. Nevertheless, the final decision also depends on operational features of the crystallizing system, such as scaling and thermal stability, economical factors, such as energy consumption, among others.
The specifications of the final crystalline product also influence the selection of the method (see Table 2.1). For a highly pure crystal, melt crystallization is the most suitable method, rather than
Chapter 2 Literature Review
17
crystallization from solution. If the target is large pure crystals, cooling or evaporative crystallization are the best option. Otherwise, for fine solids or agglomerate particles, anti-solvent crystallization and precipitation are the most appropriate.
Table 2.1 Characteristics of the solid product obtained by melt crystallization and the different methods of
crystallization from solution. [13]
Crystallization Method
Features of the process Product quality Solubility (wt %) Relative supersaturation, σ Particle size (μm) Purity Melting
Crystallization 90 0.001 to 0.01 Product is a liquid Very good Cooling Evaporative 10 to 30 0.001 to 0.01 100 – 1000 Good Precipitation Anti-solvent <0.01 1 to 100 0.5 – 100 (agglomerates) Poor
Continuous crystallization. Microfluidics crystallization
A crystallization unit is mostly integrated in downstream processing operations as a separation or a purification step. [15] Crystallization can be operated in two different modes, continuously or batch-wise.
Batch operation is mostly applied for multi-purpose units, for processing high-value products due to reduced off-spec losses, and for small production capacities. Although this operation mode is characterized by its simplicity of equipment, it is only an economical option for capacities inferior to 1 m3day-1. A batch operation provides the possibility of cleaning the crystallizer after every cycle which allows the removal of any encrusted compound, avoiding product contamination and slow formation of undesirable polymorphs. [15]
Although batch crystallizers are the most applied ones, they have limitations, such as low reproducibility and wide size distribution, that compromise the quality of the crystalline product. [12] On the other hand, continuous plug flow crystallizers allow a narrow size distribution and high reproducibility due to the crystallization of the solute under uniform conditions when steady state is achieved. Additionally, the uniform product quality obtained in this operation eliminates the need of downstream corrective actions adopted in batch operation. [12] [19] A continuous crystallizer also benefits from higher productivity and material throughput as well as better process control. The latter allows the control of important product characteristics, such as crystal size distribution. [12]
Chapter 2 Literature Review
18
Microfluidics crystallization
Currently, it is increasing the interest of performing continuous crystallization in a microfluidic system. The microfluidic technology is a tool that provides a better insight of the crystallization phenomenon and crystals formation as well as a better control and manipulation of nucleation and crystal growth. These advantages are applicable for organic, inorganic and metal-organic solid materials. [17] [20]
Microfluidics is a field of science that studies the behavior of fluids at sub-millimeter scale. The dimension of a microfluidic system is in the range of 1 to 1000 micrometer. At this scale, the flow regime in a micro channel is laminar, due to the small Reynolds number, often inferior to unity. [20] Therefore, mass transfer occurs through diffusion providing a higher control of the local concentrations at the two fluid streams boundary, and heat transfer occurs through conduction. Furthermore, the increased surface to volume ratio enhances as well mass and heat transfer which results as well in a better control of operating parameters like temperature and concentration. [17] Consequently, microfluidic crystallizers can yield crystals with a narrow size distribution.
Microfluidic technology also simplifies the integration of analytical and detection equipment in the production system. Crystal formation can thus be followed during all the operation providing online information about the system and the rate processes of crystallization. Moreover, this integration increases process control.
Although these systems are at sub-millimeter scale they can ensure a large production of crystals, due to the ease of numbering up micro channels. For example, recent research showed the ability of parallelize micro channels promoting a feasible scaling out of the microfluidic system. [17]
Crystal Characterization
Crystal is the name given to the solid product obtained during a crystallization phenomenon. A crystal is characterized by its regular appearance resulting from both short and long-range order of its building blocks and from the symmetry of their arrangement. [11] [21]
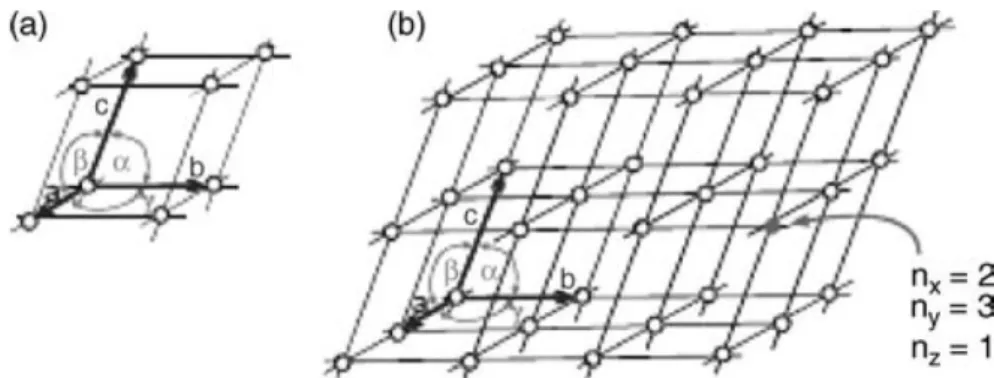
The building blocks are the molecules and atoms within the crystal which are held together by short-range order forces known as non-covalent interactions. The smallest building block is called unit cell. All unit cells in a specific crystal are the same size and contain the same number of atoms and molecules arranged in the same way. By simple displacements in three dimensions of the unit cells it is built a crystal lattice (see Figure 2.6). [11] [21]
In order to maximize the attractive interactions between atoms and molecules, and thus minimize the energetic state, only well-defined symmetries in the arrangement of the buildings blocks are possible to build a stable crystal lattice. There are only seven regular well-defined symmetries possible, which are defined as crystal systems (see Figure 2.7). For pharmaceutical
Chapter 2 Literature Review
19
compounds, there are three common types of crystal systems: triclinic, monoclinic and orthorhombic. [11] [21]
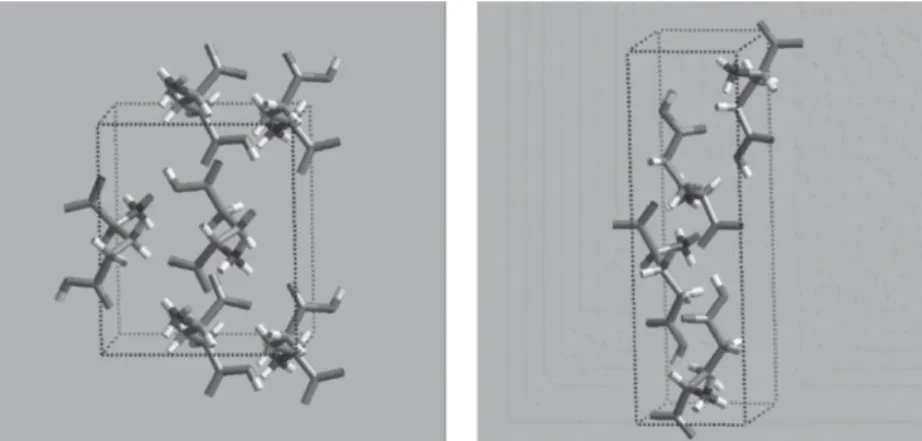
Figure 2.6 Smallest building block of a crystal, (a) unit cell, which is repeated in all three directions via
translation forming a (b) crystal lattice. The size of the unit cell is described by the lattice constants a, b, and c, and the angles α, β, and γ. [11]
Figure 2.7 The seven possible crystal systems. [21]
The conditions of a crystallization will define the long-range order and the arrangement of the building blocks, and, consequentially, will define the properties and functionality of the solid product. Therefore, it is always necessary to characterize a crystal. If the solid substance will have application in pharmaceutical and food industry, the need of characterization is even higher due to their stringent quality demands. Consequently, a variety of particle characteristics has to be narrowly controlled in order to meet the industrial requirements. Examples of those characteristics are crystal size distribution, crystal habit, polymorph forms, uptake of impurities, and degree of agglomeration.
Chapter 2 Literature Review
20
[11] [13] Some of these properties will be discussed in the following subchapters, as well as the different analysis that can be applied to control them.
2.2.1. Crystal Properties
Crystal Habit
The shape of a crystal, also called the habit, corresponds to its external appearance. The crystal habit can be often mistaken by morphology. The crystal habit is related with the relative width and length, and the number of crystal faces. The morphology of a crystal is related with the number of all possible combinations of crystal faces. Nevertheless, the habit of a crystal is dependent on its internal structure. [21]
The shape of a crystal can be classified as acicular (needle-like), platy (plate-like), columnar (like prismatic), pyramidal, tabular, equant, lamellar, among others (see Figure 2.8). [11] [21]
Figure 2.8 Examples of some crystal habits. [21]
The bioavailability of a drug does not present significant differences with distinct habits. On the other hand, differences in the ability to inject a suspension containing a drug in the solid phase are identified for distinct crystal shapes. For example, plate-like crystals are easier to inject through a fine needle than needle-like crystals are. The shape of a crystal also influences the downstream processing characteristics of the solid. For example, acicular crystals exhibit easier tendency to break easily, and thus cause poor filterability. Moreover, tableting can be also compromised due to the change in flow and compaction characteristics promoted by distinct shapes. [11] [13] [21] An example is the powder bridging in the hopper of the tablet machine and the capping problems during tableting caused by the plate-like habit of tolbutamide crystals. [21]
![Figure 1.2 Benefits of optimal levels of Vitamin D for the human being. [4]](https://thumb-eu.123doks.com/thumbv2/123dok_br/16022001.1104286/27.892.221.689.214.466/figure-benefits-optimal-levels-vitamin-d-human.webp)
![Figure 1.3 Flow diagram of the manufacturing process of vitamin D 3 . [9]](https://thumb-eu.123doks.com/thumbv2/123dok_br/16022001.1104286/28.892.219.686.707.958/figure-flow-diagram-manufacturing-process-vitamin-d.webp)