Does quality matter (in emerging countries)?
A cross-country analysis of different quality-based trading strategies and the evaluation of the price of quality with a focus on emerging markets.
Ann-Kathrin Behringer [email protected]
Dissertation written under the supervision of Professor Kjell Jørgensen
Dissertation submitted in partial fulfilment of requirements for the MSc in Double Degree Master of Finance, at BI Norwegian Business School and the Universidade Católica
2 ABSTRACT
Given the theoretical foundation, as well as empirical support from previous studies, especially by Asness, Frazzini and Pedersen (2019), this research examines the effect of firm quality on scaled prices. The research is conducted using a sample of developed markets, as well as developing markets. The price of quality is significant across developed and developing markets. The second part of this research establishes a trading strategy of going long in high-quality firms and shorting low-high-quality firms. The strategy yields significant, positive alphas across all countries but is subject to large tail risks, combining this strategy with other factor strategies, improves risk-adjusted returns and greatly reduces tail risks. The quality factor is found to be more pronounced in developing markets.
Key words: Factor investing, trading strategies, asset pricing, momentum, quality, quality minus junk
Resumo
Dada a fundamentação teórica, bem como o apoio empírico de estudos prévios, especialmente por Asness, Frazzini e Pedersen (2019), esta pesquisa examina o efeito da qualidade da empresa sobre os preços escalados. A pesquisa é conduzida através de uma amostra de mercados desenvolvidos, bem como de mercados em desenvolvimento. O preço da qualidade é significativo em todos os mercados desenvolvidos e em desenvolvimento. A segunda parte desta pesquisa estabelece uma estratégia de negociação de compra de empresas de alta qualidade e vender as de baixa qualidade. A estratégia produz Alphas positivos e significativos em todos os países, mas está sujeita a grandes riscos de cauda, combinando essa estratégia com outras estratégias de fatores, melhora os retornos ajustados ao risco e reduz consideravelmente os riscos da cauda. O fator de qualidade é conhecido por ser mais pronunciado em mercados em desenvolvimento.
Palavras-chave: Fator de investimento, estratégias de negociação, precificação de ativos, Momentum, qualidade, qualidade menos lixo
3 Acknowledgements
I would like to thank Professor Kjell Jørgensen, professor at the institute of finance at BI Norwegian Business School, for his supervision and support during the past months. His advice and guidance were substantial for finishing this thesis. I am especially grateful to have been able to develop my research topic and analysis independently.
Furthermore, I would like to thank Professor José Faias, director at the institute of finance at Católica Lisbon School of Business and Economics. During his course I have discovered my interest in the field of asset pricing and factor investing, as well as developed the skills necessary for the completion of this thesis.
I am especially grateful to all professors at BI Norwegian Business School and Católica Lisbon School of Business and Economics, who have been part of my academic development.
Next, I would like to express my gratitude towards my family for their constant support and for believing in me. And finally, I would like to thank my friends and especially Juliane Landmann and Laura Sesek who have been valuable friends and a great support during the past two years of my master’s degree.
The support of every person mentioned above made it possible for me to achieve this degree. Thank you!
4
Table of Contents
Table of Contents ... 4
1. Introduction to the Research Topic ... 6
2. Literature review ... 9
2.1. The history of portfolio theory ... 10
2.2. Factor Investing ... 11
2.3. Factors in emerging markets ... 13
2.4. Socially responsible investments as a factor strategy ... 14
3. Data and Methodology ... 15
3.1. The research questions ... 16
3.2. Data ... 16
3.3. Methodology ... 19
3.3.1. The quality measures ... 20
3.3.2. Data analysis ... 22
4. Results ... 24
4.1. The price of quality ... 24
4.2. The price of quality sub-components ... 27
4.3. Quality minus Junk portfolios ... 27
4.4. The Momentum Portfolio ... 30
4.5. Factor combo portfolios ... 31
4.6. High-volatility and high-quality trading strategy in emerging markets . 33 4.7. The ESG factor as an additional quality sub-component ... 35
5. Conclusion and outlook ... 37
6. Limitations ... 40
7. References ... 42
List of abbreviations ... 47
5
List of tables
Table 1: GICS industry specification ... 17
Table 2: General information for each country in the sample ... 48
Table 3: Rational for the country selection ... 49
Table 4: The price of quality - Developed countries ... 51
Table 5: The price of quality - Developing countries ... 52
Table 6: Quality minus Junk portfolio performance by country - equal weighting 10% long/short ... 53
Table 7: Quality minus Junk summary statistics by country - equal weighting 10 long/short ... 54
Table 8: Quality minus Junk portfolio performance per country - equal weighting 30% long/short .... 55
Table 9: Quality minus Junk summary statistics by country – equal weighting 30% long/short ... 56
Table 10: Quality minus Junk portfolio performance by country - value weighting 10% long/short ... 57
Table 11: Quality minus Junk summary statistics by country - value weighting 10% long/short ... 58
Table 12: Quality minus Junk portfolio performance by country - value weighting 30% long/short ... 59
Table 13: Quality minus Junk summary statistics by country - value weighting 30% long/short ... 60
Table 14: Momentum portfolio results ... 61
Table 15: Equally weighted QMJ/Mkt-rf combo portfolio ... 62
Table 16: Equally weighted QMJ/SMB combo portfolios ... 63
Table 17: Equally weighted QMJ/HML combo portfolio ... 64
Table 18: Equally weighted rainbow portfolio ... 65
Table 19: Value-weighted QMJ/Mkt.rf combo portfolio ... 66
Table 20: Value-weighted QMJ/SMB combo portfolio ... 67
Table 21: Value-weighted QMJ/HML combo portfolio... 68
Table 22: Value-weighted rainbow portfolio ... 69
Table 23: Regression results high-volatility, high-Quality strategy ... 70
Table 24: Summary statistics high-volatility, high-quality strategy ... 71
Table 25: ESG factor portfolios ... 72
List of figures
Figure 1: Countries that have been selected to conduct this research ... 18Figure 2: The price of quality over time ... 25
Figure 3: T-stats per industry from the price on quality regressions ... 26
Figure 4: QMJ factor loadings ... 28
Figure 5: EW/VW QMJ alphas ... 29
Figure 6: R2 values for QMJ portfolios ... 30
Figure 7: Countries most bought/sold in the momentum portfolio ... 31
Figure 8: Weights towards each factor in the rainbow portfolios ... 32
Figure 9: Sharpe Ratios for the equal-weighted factor portfolios ... 33
Figure 10: Sharpe Ratios for the value-weighted factor portfolios ... 33
Figure 11: Sharpe Ratios high-volatility strategy ... 34
Figure 12: Factor loading high-volatility vs. QMJ ... 35
Figure 13: ESG factor portfolio Sharpe Ratios ... 36
Figure 14: ESG factor portfolio skewness ... 36
6
1. Introduction to the Research Topic
„Everything works and nothing works.“
Richard Russell The goal of every investor is to achieve the highest possible returns and to outperform the market. This desire has fueled the research in the field of efficient trading and allocation strategies since the early establishment of capital markets. There exist several economic laws and capital market theories (some of which I will refer to in detail in the second part of this thesis), aiming to predict the movements in financial markets. However, no universal formula X has been found yet which enables us to perfectly forecast the behavior of financial markets. Furthermore, a prevailing opinion in academia is that “prediction, as we commonly think of it, is a totally impossible and futile exercise” (Gunn, 2009, p.3). This reasoning is backed by the efficient market hypothesis stating that all information available in the market is fully reflected in prices (Lo, 1999). This theory is derived from the general behavior of market participants; investors are constantly looking for new information in order to maximize their own wealth and by doing so, they incorporate even the smallest piece of information into the market and quickly eliminate the profit opportunity. Assuming the efficient market hypothesis is true, any market analysis would be useless, and it would be impossible to benefit from novel information, hence “the most efficient market of all is one in which price changes are completely random and unpredictable” (Lo, 1999, p.4), which seems puzzling. However, it has been shown before that financial markets do have trends and that there exist some kinds of patterns, e.g. observable calendar effects or efficiency effects. After decades of research, the economy has not yet come to a clear and common understanding about whether financial markets are efficient or not, which opens up the following question: Are financial markets efficient or do any trading strategies exist that can outperform the market? Through the construction of different trading strategies, aiming to beat the market returns and hence, showing that financial markets are not efficient, this research tries to shed some more light on the question above.
Asness et al. (2019) argue that research in the field of asset pricing has been too focused on trying to explain expected returns rather than market-to-book ratios in the past years. They propose that higher quality stocks demand higher prices and build an investment strategy based on the assumption that high-quality stocks will yield higher than market returns and low-quality stocks (junk stocks) underperform compared to the market. The quality definition used in their
7 research is defined as a measure of a firms’ profitability, growth, and safety (the composition of the quality score is further defined in section three).
This research will firstly examine the connection between a firm’s stock price and its quality and then refer to the investment strategy “Quality Minus Junk” (QMJ), proposed by Asness et al. (2019) – a zero-cost strategy which pursues the following logic: buying stocks determined to have high quality and short-selling stocks determined to have low quality. Extensions of this research will be the combination of the QMJ factor with other factors (value, size, and momentum) and the consideration of emerging markets.
Asness et al. (2019) state that higher quality stocks demand higher prices. They analyze this hypothesis across 25 different countries, however, all markets Asness et al. (2019) chose to investigate in their research are represented by developed markets (following the MSCI World developed index). This study will include emerging markets data to investigate whether their findings still hold or are even more pronounced within developing markets. There exist many reasons to consider emerging markets in this research. Firstly “emerging markets are home to over half of the world’s population” (Trichet, 2007, p.3), emerging countries account for almost 60% of the world’s GDP with further increases expected (International Money Fund, 2018). Other reasons are positive long-term outlooks or cultural importance and many more. The connection of the above listed arguments to finance theory is obvious, the global economy is experiencing major changes and new participants are entering financial markets, hence, it is important to consider these new players in order to be competitive. Another reason to consider a rather broad spectrum of countries is the systemic factor that connects our globalized world. In the aftermath of the financial crisis of 2008, this element has become more vivid than ever before. Economies across the globe are interconnected, and positive as well as negative shocks tend to spill over. Giving further examples for this systemic factor are the Tesobonos crisis of Mexico, the Asia crisis, or the bursting of the tech bubble (Trichet, 2007). Lastly, if one would follow the general approach implicating that the world portfolio is the most diversified portfolio to hold, the inclusion of emerging markets is crucial.
There exist contrary findings regarding the existence and persistence of style factors within emerging markets (as discussed further in the literature review section), which is yet another reason to shed some more light on this discussion. Furthermore, Asness et al. (2019) find especially high 4-factor alphas for the less developed markets in their sample (such as Portugal, Greece, Ireland, or Italy), which have recently or are still facing a crisis (Asness at al., 2019). In fact, the country exhibiting the highest QMJ 4-factor alpha throughout their sample is Greece,
8 which has been downgraded to a MSCI emerging country in 2013 (Reuters, 2013). These findings might be an indication for an even more pronounced quality factor in less developed markets.
Additionally, this study will not only investigate this proposal within different markets, but also distinguish between different industries, sectioned by developed vs. developing countries. In light of fast paced changes and disruptions within emerging countries in the past years, it will be interesting to explore whether these countries have different quality expectations within particular industries than developed economies. One example of these rapid disruptions is the tech industry as companies operating in developing countries have rapidly emerged from being “followers in technology” (Pangaro, 2018) to being innovators (Pangaro, 2018).
Another extension of this study is to construct variations of the Quality Minus Junk (QMJ) portfolio. I combine this strategy with the portfolio strategy of buying past winners and selling past losers in a cross-country manner, known as the momentum strategy proposed by Jegadeesh & Titman (1993) to diversify across different countries, capital markets, and economies. This strategy is derived from the idea that stocks which are in an upward trend will more likely continue in that direction, rather than move against this trend and vice versa. Furthermore, Asness et al. (2019) find that the three Fama and French factors (1993) are negatively correlated with the QMJ portfolios and combine those portfolios into a combo portfolio in order to benefit from diversification. My research will find different combinations of these factors with the quality factor and maximize the overall Sharpe Ratio by adjusting the weights towards each factor. Further, I will test a cross-country momentum strategy on all quality portfolios. Since momentum strategies are commonly occupied with high volatility, I believe that combining them with the proposed quality measure will strongly lower the overall portfolio volatility. However, the portfolios will not be combined as a combo portfolio like Asness et al. (2019) proposed with the other factors, but the momentum portfolio will be a cross-country portfolio of all in-country QMJ portfolios. More precisely, after applying the QMJ portfolio within each country, I will apply a momentum strategy across those portfolios.
Lastly, this research investigates an alternative measure of firm quality, namely environmental, social and governance performance (ESG). “For investors, ESG data is increasingly important to identify those companies that are well positioned for the future and to avoid those which are likely to underperform or fail” (Forbes, 2018). In light of the aftermath of some of the biggest scandals in corporate history, such as the VW diesel scandal or the Cambridge Analytica data scandal, I decided to add ESG factors to my analysis as an additional quality factor to find out
9 whether sustainability “pays off”. It is still an established thought, that the condition of “impact” or social responsibility into the investment process will result in either lower financial return or higher risk. However, this trade-off doesn’t necessarily have to exist. For example, the impact fund Mustard Seed has originated the concept of the Virtuous Venture Cycle (VVC), with which they argue that there is a positive reinforcement cycle with impact investing since consumers and employees are more supportive towards businesses with similar values as themselves, spurring shareholder support as earnings grow. As a result, social oriented ventures gain a competitive advantage (in terms of reputation, revenues and costs). The impact approach also minimizes the probability of having legal costs that are subject to environmental or other illegal issues (Mustardseed, 2016). I belief that the change in societies virtues towards a more sustainable living is reflected in the financial markets and that more sustainable firms will achieve superior returns. Further, the importance of responsible investing has been constantly rising in the past years and “today, ESG investing is estimated at over $20 trillion in AUM […] around the world and its rapid growth builds on the Socially Responsible Investment (SRI) movement that has been around much longer” (Forbes, 2018).
I believe that using all portfolio strategies mentioned above will lead to superior risk-adjusted returns as compared to a combo strategy since it diversifies across different markets.
My research will be structured as follows:
First, I will present a literature review of all literature relevant to the development of modern portfolio theory and highlight the relevance of my research. Furthermore, the literature review will also discuss factor investing and factors in developing markets. The second chapter of this thesis will evaluate the problem statement of my research and formulate the relevant research questions. Next, I will explain the used methodology and list the relevant data sources, followed by the presentation and discussion of the findings. After a conclusion, I will highlight the importance of my findings and discuss implications for future research as well as limitations of my research.
2. Literature review
To be able to find efficient trading strategies, it is important to accurately evaluate financial markets. There exist two major approaches in analyzing financial markets, the fundamental and the technical approach. The fundamental method uses data such as financial statements, industry analysis, and macro-economic factors to predict future stock market movements by evaluating the intrinsic value of a company, whereas the technical approach is based on the fact
10 that all fundamental data is already represented in the market prices, thus it uses past return data and other indicators. In addition to these approaches, there are several portfolio theories and capital market models, the most important ones will be reviewed in the following section.
2.1. The history of portfolio theory
„The CAPM is wanted, Dead or Alive.“
Eugene F. Fama and Kenneth R. French One of the oldest and most important portfolio theories is the Dow theory, which stands in great contrast to the Random Walk Theory mentioned before. The Dow theory is considered by many as the foundation of technical analysis and most of what we know today as technical analysis has its roots in the Dow Theory. Charles Dow was the first person to discover that the overall market trend reflects business conditions which are an indicator of the markets’ future development, however, trading strategies based on the Dow Theory have not been found to yield superior returns when compared to buy and hold strategies (Cowles, 1993). There are six major findings to this theory. The first is that market prices incorporate all available information and, second, that markets have trends. Third, Dow divides trends into three phases, an accumulation phase, a public participation phase, and a distribution phase. The accumulation phase occurs when investors who know about the future stock movement are actively buying or selling the stock against the public opinion. During the accumulation phase, the stock price does not change much since the majority of the market has not started trading the stock yet. During the public participation phase, the public catches on to the investors and the price rapidly starts to change. In the final phase, astute investors begin to distribute their shares in the market. The fourth underlying finding is that stock market averages must confirm each other and move, on average, in the same direction. Fifth, trends are confirmed by volume, meaning that the trading volume should increase once the price moves in the direction of the trend and decrease once the price moves in the opposite direction. The intuition behind this is that traders are more willing to buy an asset if they believe that an upward movement will continue and vice versa. Finally, trends exist until there is definite proof that they have ended (Cowles, 1993). The Dow Theory has later been revised by Brown et al. (1998), with the finding that Cowle’s research had flaws and that the Dow Theory indeed does yield superior returns compared to the overall market.
The core of Modern Portfolio Theory is the relation between risk and return, which was first developed by Harry Markowitz (1952). Markowitz believes that achieving the highest possible
11 return is not the single determinant to value portfolios but that investors should more importantly be concerned about mean-variance optimization. Hence, the most desirable portfolio is the one with the highest average return (mean) and the lowest mean variance. The finding of this relation has been a major step in financial theory since it implies that a portfolio’s mean variance is the appropriate risk measure for financial assets (Hillier, 2012). According to Markowitz, the contribution of a single asset to the overall portfolio should be the major factor of investment decisions, broadly known as mean-variance analysis. Building on Markowitz’ findings, we can define mean-variance efficient portfolios which yield a higher return with lower risk compared to the “dominated portfolios” which are either inferior in terms of returns, volatility, or both. Markowitz’ work also implicates another cornerstone of modern financial theory which is diversification. Holding assets with largely uncorrelated returns strongly reduces the risk of the overall portfolio.
Mean-variance analysis is also the backbone of the most famous asset pricing model, the Capital Asset Pricing Model (CAPM). The CAPM reveals that it is not a specific asset’s own variance that is important, but rather the covariance of that asset’s return with the market return, which is measured by that asset’s beta. This argument has been found by Sharpe, Lintner, and Mossin in the 1960’s. Hence, beta is the measure of risk that determines the extra yield that has to be added to an asset’s return above the risk-free rate and, therefore, represents the appropriate cost of capital for a given stock (Hillier, 2012). Even though the CAPM has been a major step towards modern financial theory, it is subject to multiple criticisms as it lacks ability of explaining asset returns. The main explanations for the CAPM’s bad performance are anchored in the theory that the proxies for the market portfolio do not capture all “relevant risk factors in the economy” (Hillier, 2012, p.155).
2.2. Factor Investing
„When did our field stop being “asset pricing” and become “asset expected returning?” … Market-to-book ratios should be our left-hand variable, the thing we are trying to explain, not
a sorting characteristic for expected returns.”
Cochrane, American Finance Association In the meanwhile, a different kind of trading strategy has evolved which is commonly known as factor investing. There are some factors that have shown to be persistent drivers of returns and can help to accomplish different investment goals such as improving diversification, increasing returns, or reducing risk. The above-market performance of factors can often be
12 explained by three major attributes: additional risk, structural impediments, and (irrational) investor behavior (Blackrock, 2019). Many factor investing strategies are based on long-short investing and are therefore zero-cost strategies, which makes them even more appealing to investors. These factors can be divided into two major classes: macro factors (such as inflation or real rates), which are persistent throughout all asset classes, and asset class specific style factors. The two most well-known style factors have been discovered by Fama and French in their study from 1993, in which they extended the CAPM model by adding two more factors: value and size. While conducting their studies, Fama and French discovered that two classes of stocks have tended to perform better than the market as a whole: small-capitalization stocks and stocks with a high book-to-market ratio (value). In their work “The Cross-Section of Expected Stock Returns”, Fama and French argue that the linear relationship of an asset’s returns and its beta (CAPM) disappears when taking into account the effects of size and book-to-market ratio. Following the value and size factors, the alternative concept of momentum investing arose. Jegadeesh and Titman (1993) propose a portfolio strategy of buying past winners and selling past losers, which is known as momentum strategy. This strategy is based on the theory that stocks which have been in an upward trend in the past will continue to do so and that stocks which have been in a downward trend will also continue to follow a declining trend in the future. Hence, an investor takes a long position in stocks that have shown the upward trending price (buying the winners) and a short position in stocks characterized by the downward trend in the same time-period (selling losers). Although momentum has proven to yield high returns, it is also occupied with high tail risks. When solely relying on volatility as a measure of risk, momentum portfolios seem to be superior to all other factors, however, volatility is a poor risk measure when it comes to momentum investing. Momentum strategies are occupied with large tail risks e.g. expressed in excess kurtosis and large minimum values (Barosso and Santa-Clara, 2015) resulting in large but infrequent crashes. Major tail risks arise when losers outperform winners or by the tendency towards buying overvalued stocks and selling undervalued ones. Alongside all other factors mentioned in the previous section, this thesis sets its focus on the newly discovered style factor, quality. The research paper “Quality Minus Junk” by Clifford S. Asness, Andrea Frazzini, and Lasse Heje Pedersen (2017), is the core of this research. The quote used in the beginning of this chapter perfectly introduces their research topic, which is whether high-quality stocks demand higher prices. Asness et al. (2019) define three quality measures, namely growth, profitability, and safety to measure the quality of a company. After testing how quality affects stock prices, they also construct a portfolio where they go long in
13 high-quality and short in junk stocks. This QMJ factor yields highly significant risk-adjusted returns.
2.3. Factors in emerging markets
Even though the relative size of economies around the world is experiencing a substantial shift towards emerging markets (Johansson et al., 2012), only few researches have been dealing with factor investing in developing regions. Furthermore, research papers available so far show controversial findings regarding factors in developing markets. The following paragraph will discuss the most noteworthy findings.
One of the first globally extended studies of style factors around the world was conducted by Fama and French in 2012, when they investigated size, value, and momentum returns across four regions, however, covering only developed markets. They show that the value and momentum factors are significant in all countries except Japan and insignificant results for the size factor.
The momentum factor has been the most researched factor across emerging markets. Andy Naranjo and Burt Porter (2007) find significant positive returns and diversification benefits from momentum strategies in emerging markets. Luis Muga and Rafael Santamaria (2007) analyze the momentum effect within Latin American emerging countries and prove positive significant results. In 2010, Chui et al. find mixed results when conducting a research on momentum returns in developing markets.
However, there are also some studies conducting research on other factors within emerging countries. In 2015, Hanauer et al. provide evidence of positive, significant effects of the momentum factor across emerging markets, weak effects resulting from the size factor, and highly significant, positive effects resulting from the value factor. Furthermore, they conclude that the value factor is even more pronounced in emerging markets when compared to developed markets. Another study from 2012, conducted by Groot et al., finds significant value, momentum, and size effects across 24 frontier markets. Frontier markets are countries even less developed than emerging markets.
In contrast, Cakici et al. (2016) conduct research regarding the value, momentum, and size factors in 18 emerging markets and show that size and momentum are not present in emerging markets and that the value factor is present in all emerging markets conducted except for Brazil. Zaremba and Konieczka (2015) find that size and momentum premiums in CEE emerging markets disappear when adjusting for the impact of illiquidity and transaction costs and only the value premium survives.
14 The research of Vaibhav et al (2018) investigate quality investing in the Indian market and find that two out of four quality strategies beat the market return, however, their definitions of quality deviate from Asness et al. (2019) and consequently from the definition of quality used in this research. Furthermore, their sample only comprises companies included in the BSE-500 index, which excludes a large universe of companies that are not included in the index. Another problem with using only index companies for researching factor strategies is the exclusion of the risk of dying companies, which is commonly known as “survivorship bias”.
To conclude, the study of the quality factor within emerging markets is novel and will add important findings to existing works.
2.4. Socially responsible investments as a factor strategy
There exist three approaches of socially responsible investments, the least strict approach involves negative screening, which is the exclusion of “bad” companies, such as weapon or tobacco producers, from the investment portfolio. A more drastic approach is called positive screening, hereby the investor actively picks stocks that comply with predefined social, environmental and governance standards. These specifications can be generalized as ESG measures. There exist several databases that developed an ESG scoring system to rank companies based on their ESG performance. There are different approaches in terms of the implementation of positive screening to investment decisions e.g. to only invest in companies with an ESG score above the median or a certain cut-off or the implementation of a long/short factor strategy as proposed in this research. While ESG criteria are a set of standards that can gauge the sustainability of a company’s operations and signal exposure to growing risk factors, impact investing goes one step further and aims not just to invest sustainably, but also making an actual positive impact alongside the financial return. To qualify as an impact investment, the given company’s primary business objective has to be a solution or product with measurable social or environmental impact.
Van Duuren et al. (2015), examine the connection between sustainability and company performance. According to van Duuren et al. (2015) improper corporate governance and bad social and environmental externalities should have a negative impact on a firm’s earnings and abilities to conduct business. Van Duuren et al. (2015) also find that there is a positive performance when considering ESG factors in investment decisions, however, they also find that ESG factors are mostly used to identify red flag companies rather than as a positive sorting variable. Eccles et al. (2014) find that sustainable companies significantly outperform less sustainable firms in terms of stock returns. Another study in favor of responsible investments
15 was conducted by Kumar et al. (2016), according to their research, companies incorporating ESG guidelines show lower stock volatility and higher returns when compared to their peers. Since the focus of this research is on emerging market countries, it will also be interesting to see whether the implementation of ESG standards differs when compared to developed markets. Sherwood et al. (2017)’s research indicates that portfolios considering ESG principles find higher returns and lower downside tail risk when compared to portfolios without any consideration of ESG within emerging markets. Lastly, a study by Friede et al. conducted in 2015 combines the findings of over 2,000 researches on the connection of ESG and financial performance and conclude that, even though past studies do not all agree a common consensus, the overall general trend reports positive findings.
All above-mentioned literature is focused on the connection between ESG and individual company performance, however, research examining the relation between ESG practices and investment portfolio performance is rather scarce.
Literature regarding ESG investing include the research of Amel-Zadeh and Serafeim (2018), according to their research, negative screening achieves the least benefit in terms of risk and return when compared to more active approaches. Further, Kempf et al. (2007) find that companies with high social ratings score abnormal returns, however, this study has excluded contentious industries, such as the tobacco or alcohol sector from their study, which distorts their findings. On the other hand, Auer et al. (2016) propose that there is no evidence of a superior risk-adjusted performance through an active selection of stocks with high or low ESG stocks. Active stock selection based on ESG performance results in similar to market performance within the U.S. and the Asia-Pacific region and below-market performance within Europe.
To conclude this section, while the implementation of ESG guidelines seems to pay off on the level of individual firm performance, the impact of ESG practices for investment portfolios remains unclear, which is why this study will try to shed some more light on this question.
3.
Data and Methodology
Firstly, the two major research questions will be presented, then data sources will be discussed, and, finally, the methodology and all subordinate research questions will be explained.
16
3.1. The research questions
The following paragraph will further explain the methods used to analyze the two major research questions.
1) Do high-quality stocks across different countries demand higher prices?
To answer the first research question, whether high-quality stocks demand higher prices, the following regression is used, where 𝑃𝑖,𝑡 = log(𝐵𝑀𝑖,𝑡), market-to-book is defined as the current
market value of equity of the firm in year t divided by the company’s book value. The calculation of the quality and price measure is further explained in the methodology part.
𝑃𝑖,𝑡 = 𝛼 + 𝛽𝑄𝑢𝑎𝑙𝑖𝑡𝑦𝑖,𝑡+ 𝜇𝑖 + 𝜀𝑖,𝑡 (1)
The regression coefficient β measures the percentage increase in market-to-book associated to a one standard deviation increase in the quality score. μ measures the variables that affect P cross-sectionally but does not vary over time (fixed effects).
The regression will test the Alternative Hypothesis that 𝛽 > 0 against the Null Hypothesis that 𝛽 = 0.
2) Will QMJ and other quality-based trading strategies yield positive abnormal returns? The second part of this thesis tests different trading strategies associated with the Quality Minus Junk theory. To investigate whether the QMJ portfolio (and other combinations) returns experience positive abnormal returns, I will test the Alternative Hypothesis of ∝ ≠ 0 against the Null Hypothesis of ∝ = 0. To do this, I will run the following regressions:
𝑟𝑄𝑀𝐽𝑡 = 𝑎 + 𝛽𝑀𝐾𝑇−𝑟𝑓𝑀𝐾𝑇 − 𝑟𝑓𝑡+ 𝜀𝑡 (2) 𝑟𝑄𝑀𝐽𝑡 = 𝑎 + 𝛽𝑀𝐾𝑇−𝑟𝑓𝑀𝐾𝑇 − 𝑟𝑓 𝑡+ 𝛽𝑆𝑀𝐵𝑆𝑀𝐵𝑡+ 𝛽𝐻𝑀𝐿𝐻𝑀𝐿𝑡 + 𝛽𝑈𝑀𝐷𝑈𝑀𝐷 𝑡+ 𝜀𝑡 (3) Where MKT-rf resembles the proxy market excess return of the CAPM regression and equation (3) is based on the Fama and French 4-factor model. QMJ represents pure QMJ portfolios, this equation is exemplary for all other portfolio construction that will be tested in this research. The methodology used for the portfolio constructions is further explained in part 3.3.2.
3.2. Data
The main data sources used are Compustat Global fundamentals and daily prices, the fundamental data is based on yearly publications. Data for the past 18 years across 24 different countries, which are displayed in Figure 1, is used. Table 2 displays general information for all
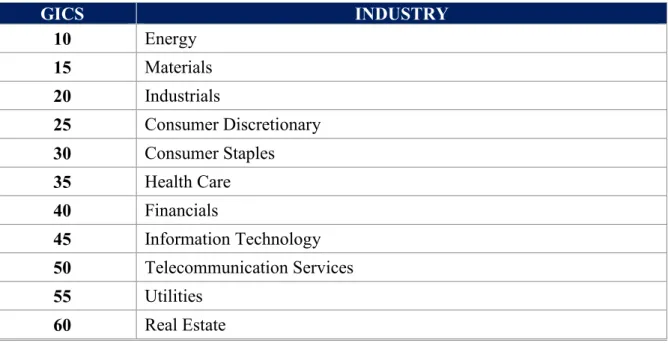
17 countries in the sample and Table 3 discusses reasons for the inclusion of each market. The industries used for the research are defined in Table 1 (identified by the Global Industry Classification Standard GICS). Financials have not been excluded from the sample, following Asness at al. (2019).
Table 1: GICS industry specification
GICS INDUSTRY 10 Energy 15 Materials 20 Industrials 25 Consumer Discretionary 30 Consumer Staples 35 Health Care 40 Financials 45 Information Technology 50 Telecommunication Services 55 Utilities 60 Real Estate
Stock prices have been translated in the same currency, namely Euro, to hedge for currency risk. The currency exchange rates are retrieved from Datastream. The data for the market indices and ESG data is also retrieved from Datastream. The rather short time period (1999 – 2017) of the sample is due to the inclusion of emerging country data, which, for most emerging countries is not widely available for a long time period. Furthermore, since the Euro was only introduced in January 1999, this year is set as starting point of the analysis. Currencies could have been translated back before 1999 using a currency called the Synthetic Euro. Warburg Dillon Read (a former U.S. investment bank) has calculated a synthetic series for the Euro against the U.S. Dollar calculating exchanges rates for the Euro synthetically backwards from its introduction date. The WDR Synthetic Euro is a currency basket which is weighted by fixed purchasing power parity GDP weights of the Euro countries. However, I prefer to keep the dataset clean and only use actual Euro exchange data as predictions could deviate from true values.
18 Figure 1: Countries that have been selected to conduct this research
To calculate the three factor Fama and French regression, the global ex. U.S. factors are retrieved from the Kenneth French website, the risk-free rate used is the 10-year US Treasury Bill. Those values have also been translated into Euro.
ESG scores have been assigned since 2002 (always reporting the score for the previous year) and are available for over 7,000 companies on Datastream (Thomson Reuters, 2018). Thomson Reuters uses over 400 different ESG factors to quantify the final score, sources such as annual reports, company webpages, CSR reports and many more are used to collect data. The ranking is divided into three major pillars with sub-scores: Environmental (Resource Use, Emissions, Innovation), Governance (Management, Shareholders, CSR Strategy and Social (Workforce, Human Rights, Community, Product Responsibility) (Thomson Reuters, 2018). The scores within the different sub categories are then weighted in proportion to their amount of input factors to find an overall score for each pillar and ranked relative to other companies within the industry group (for the environmental and social score) or companies within the same country (for the governance score). Finally, an overall ESG score is achieved through averaging the score of the three major pillars.
In order to study the quality premium within developing markets, the sample of 24 countries is split in half, 12 developed countries and 12 developing countries. The reason for including developed countries in the sample is to have a more exact dataset for comparison between
19 developing and developed markets as quality measures and time periods deviate from Asness et al. (2019) as further explained later. This approach also allows to profit from higher-than-average growth in developing countries, while at the same time gaining from the stability resulting from economies with stable and developed capital markets when building the momentum portfolio. Since it is hard to define developing markets if following the MSCI developing markets index, as countries move in and out of the index on a regular basis, this research is not basing the country selection on the exact MSCI developing index but rather uses countries that have been or are included in the index over a longer time span during the observation period.
3.3. Methodology
The measures of quality are as proposed by Asness et al. (2019), profitability, growth, and safety. Asness at al. (2019) use the basic intuition behind the Gordon Growth Model to show how price-to-book ratios depend on these quality measures. The Gordon Growth Model can be used to determine the intrinsic value of a stock based on dividends and their future growth rate.
𝑃 = 𝐷
𝑟 − 𝑔 (4)
Equation (4) displays the general Gordon Growth Model, where P is the stock price, D is the dividend, r is the discount rate and g is the dividend growth rate. Dividing both sides of the equation by the book value of equity (B), we arrive at the following equation:
𝑃 𝐵=
((𝑃𝑟𝑜𝑓𝑖𝑡𝐵 ) ∗ (𝐷𝑖𝑣𝑖𝑑𝑒𝑛𝑑𝑃𝑟𝑜𝑓𝑖𝑡 )) (𝐷𝑖𝑠𝑐𝑜𝑢𝑛𝑡 𝑟𝑎𝑡𝑒 − 𝐺𝑟𝑜𝑤𝑡ℎ 𝑟𝑎𝑡𝑒)
(5)
From this equation, the following relationship evolves: 𝑃
𝐵=
(𝑃𝑟𝑜𝑓𝑖𝑡𝑎𝑏𝑖𝑙𝑖𝑡𝑦 ∗ 𝑃𝑎𝑦𝑜𝑢𝑡 𝑅𝑎𝑡𝑖𝑜)
𝐷𝑖𝑠𝑐𝑜𝑢𝑛𝑡 𝑅𝑎𝑡𝑒 − 𝐺𝑟𝑜𝑤𝑡ℎ 𝑅𝑎𝑡𝑒 (6)
Asness et al. (2019) argue that, according to Modigliani and Miller (1958), the payout ratio of a company does not affect the price of its shares since the economy we consider is frictionless. From equation (6), it can be inferred that a company with a higher profitability per book value (BV) should demand a higher price (holding all else equal), a company with a higher growth rate of profits should demand a higher price (holding all else equal), and a company with a lower discount rate should demand a higher price (holding all else equal). The definition of each measure will slightly deviate from the QMJ paper with the aim of additional or differing
20 findings. In the following section, I will define the quality measures used for my research in greater detail.
3.3.1. The quality measures
To normalize the data, the logarithm of all measures is used for further analysis. Using log values helps in overcoming heteroscedasticity, making a non-linear relationship linear and brings a distribution that is positively skewed closer to a normal distribution (Brooks, 2014).
1) Profitability
Asness et al. (2019) measure profitability as an average score of return on assets (ROA), return on equity (ROE), gross profits over assets, cash flow over assets, gross margin, and cash earnings. In this research, profitability is measured as the average score of ROA and ROE. To calculate monthly log ROA, yearly income before extraordinary items (IB) and total assets (AT) are retrieved for every company and evenly spread over each month of the fiscal year. The formula used is as follows:
𝑆𝑐𝑜𝑟𝑒 𝑅𝑂𝐴𝑖,𝑡 =
𝐼𝐵𝑖,𝑡
(𝐴𝑇𝑖,𝑡−1+ 𝐴𝑇𝑖,𝑡)/2 (7)
Where i is the respective firm and t the month. To calculate monthly log ROE, shareholder equity is retrieved, if not available it is approximated as total assets minus total liabilities and minority interests. Book equity (BE) is calculated as shareholder equity minus preferred stock value. All values are again evenly spread over the year. ROE was calculated as follows:
𝑆𝑐𝑜𝑟𝑒 𝑅𝑂𝐸𝑖,𝑡 = 𝐼𝐵𝑖,𝑡
(𝐵𝐸𝑖,𝑡−1+ 𝐵𝐸𝑖,𝑡)/2 (8)
Within each country and each month, the measures are ranked relative to each other, assigning higher ranks to companies with higher ROA and ROE. Afterwards, I create an overall profitability measure by averaging the ROA and ROE ranks. If either one or both of the measures are missing, no score is assigned.
2) Growth
Asness et al. (2019) measure growth as the five-year growth in all profitability measures. This research follows their calculations, however, using one-year instead of five-year growth measure due to a shorter time period of the data used. First, the one-year growth rate of each of the profitability measures is calculated and then ranked according to the same procedure as used for the profitability measures.
21 𝑆𝑐𝑜𝑟𝑒 𝑅𝑂𝐴 𝐺𝑟𝑜𝑤𝑡ℎ𝑖,𝑡+1 = (∑𝑡𝑙=𝑡−11𝑅𝑂𝐴𝑖,𝑙 ∑𝑡−12𝑙=𝑡−23𝑅𝑂𝐴𝑖,𝑙 )-1 (9) 𝑆𝑐𝑜𝑟𝑒 𝑅𝑂𝐸 𝐺𝑟𝑜𝑤𝑡ℎ𝑖,𝑡+1 = (∑𝑡𝑙=𝑡−11𝑅𝑂𝐸𝑖,𝑙 ∑𝑡−12𝑙=𝑡−23𝑅𝑂𝐸𝑖,𝑙 )-1 (10)
The overall growth score is then, again, the average of both scores. If one of the scores is missing, no score is assigned.
3) Safety
Asness et al. (2019) measure safety using beta, the leverage ratio, the O- and Z-Score, and ROE volatility. In this research, safety will be measured in terms of beta and leverage ratio. To calculate market betas, the return index data from each country’s main index (as displayed in Table 2) was downloaded and translated to Euros to serve as market return approximation. Since Compustat Global provides no total return measure, it is calculated as follows:
𝐿𝑜𝑔 𝑅𝑒𝑡𝑢𝑟𝑛𝑠𝑖,𝑡 = 𝐿𝑁 ( (( 𝐴𝐹𝑃𝑖,𝑡 𝑖,𝑡) ∗ (1 + 𝑇𝑅𝐹𝑖,𝑡 100 )) (( 𝐴𝐹𝑃𝑖,𝑡−1 𝑖,𝑡−1) ∗ (1 + 𝑇𝑅𝐹𝑖,𝑡−1 100 )) ) (11)
The total return factor (TRF) includes cash equivalent distributions, the reinvestments of dividends, and compounding effects paid on reinvested dividends. AF is the adjustment factor and P the monthly closing stock prices. TRF, AF, and P are translated to monthly measures since only daily data has been available. To translate the data, a VBA code is used, always using the last available stock price of each month as the end of the month price (same procedure with TRF and AF). Both, the index and the company stock returns are translated into log returns. Each company’s 1-year beta score is then calculated as follows:
𝑆𝑐𝑜𝑟𝑒 𝑏𝑒𝑡𝑎𝑖,𝑡+1 = 𝐶𝑜𝑣(𝑟𝑖, 𝑟𝑚) 𝑉𝑎𝑟(𝑟𝑚) =
∑𝑡𝑙=𝑡−11(𝑟𝑖,𝑗 − 𝑟̅𝑖)(𝑟𝑚,𝑗− 𝑟̅𝑚)
∑𝑡𝑙=𝑡−11(𝑟𝑚,𝑗− 𝑟̅𝑚)2 (12) To give a better score to low-beta companies, the data is now ranked in a descending manner to find the beta scores.
To calculate the leverage ratio, total liabilities (LT) for each company is retrieved and spread over the financial year, the leverage ratio is then calculated as follows:
𝑆𝑐𝑜𝑟𝑒 𝐿𝑒𝑣𝑒𝑟𝑎𝑔𝑒𝑖,𝑡 =
𝐿𝑇𝑖,𝑡
22 Similar to the beta score, the data is now ranked in a descending manner to find the leverage score. Finally, both scores are averaged to find the overall safety score, again, if there are one or two missing scores, the company receives no score for this month.
4) Overall quality score
To find the overall quality score, all sub-measures are combined into a single score by averaging. This average score is used as proxy for firm quality. If one of the scores is missing, no quality score is assigned.
3.3.2. Data analysis
The following paragraph will again discuss all research questions and investigate them in further detail.
For this part of the thesis, the overall sample has been divided into developing and developed countries rather than each country separately. Consequently, the calculation of the quality measures has been rescored across the whole samples of all developing and all developed countries in the same way as explained above.
1) Do high-quality stocks across different countries demand higher prices?
As stated above, to answer the first research question, whether high-quality stocks demand higher prices, the following regression is used, where 𝑃𝑖,𝑡 = log(𝐵𝑀𝑖,𝑡), market-to-book is defined as the current market value of equity of the firm in year t divided by the company’s book value. Prices are scaled by book values to make companies comparable. For better comparability of quality scores and the scaled prices, P is also translated into a relative score measure.
𝑃𝑖,𝑡 = 𝛼 + 𝛽𝑄𝑢𝑎𝑙𝑖𝑡𝑦𝑖,𝑡+ 𝜇𝑖 + 𝜀𝑖,𝑡 (1)
The regression coefficient β measures the percentage increase in market-to-book associated to a one standard deviation increase in the quality score. μ measures the variables that affect P cross-sectionally but do not vary over time.
With this regression, I will test my Alternative Hypothesis that 𝛽 > 0 against the Null Hypothesis that 𝛽 = 0.
To examine the individual effect of each measure, the following regression has been added to the analysis:
23 𝑃𝑖,𝑡 = 𝛼 + 𝛽1𝑃𝑟𝑜𝑓𝑖𝑡𝑎𝑏𝑖𝑙𝑖𝑡𝑦𝑖,𝑡+ 𝛽2𝐺𝑟𝑜𝑤𝑡ℎ𝑖,𝑡 + 𝛽3𝑆𝑎𝑓𝑒𝑡𝑦𝑖,𝑡+ 𝜇𝑖
+ 𝜀𝑖,𝑡 (14)
The regressions are Fama MacBeth regressions and are run year-by-year, using June observations. Due to the yearly frequency of the fundamentals data, yearly rather than monthly frequencies were chosen for the regressions (this process also follows the analysis of Asness et al. (2019)). Country and industry fixed effects have been considered throughout the analysis to remove the impact of an omitted variable bias. All standard errors have been tested for the five classic linear regression model assumptions (see Matlab code 2 in the Appendix) and have been corrected for heteroscedasticity and autocorrelation of up to 12 lags using Newey and West (1987)’s heteroscedasticity and autocorrelation consistent standard errors (Matlab code 1).
2) Will QMS or any other quality-based strategy yield positive abnormal returns?
The second part of the thesis tests different trading strategies associated with the Quality Minus Junk theory. The first step is to construct 24 QMJ portfolios, one within each country. Therefore, 10 deciles are set up to rank the quality of the respective stocks. Then a zero-cost portfolio is constructed that invests long in the 10th decile (quality stocks) and short in the 1st
decile (Junk stocks). Another strategy investigated in this research follows the strategy Asness et al. (2019) have used, namely investing long in the top 30 percent and short in the bottom 30 percent. Asness et al. (2019) have followed a strategy of investing in the top 1/3rd and shorting
the bottom 1/3rd of the companies. Consequently, the strategy of investing long/short in the
top/bottom 30% is quite related to their proposed strategy.
Both of the above-mentioned strategies have been conducted using an equally weighted and a value-weighted portfolio approach. Value-weighting strategies reduce investor risk through lower weights towards risky small cap firms, however, it also reduces return due to the high growth rate among low-cap firms and potentially lower diversification and over-weighting towards mega companies (Forbes, 2016). All prominent market indices are value-weighted due to the overweighting of small-cap relative to large-cap stocks in equal-weighting approaches, which is why value-weighting is a more realistic approach. Asness et al. (2019) only follow a value-weighted approach in their research, however, I believe that it will add extra value to also examine equal-weighted portfolio constructions. Hou et al. (2017) show that many trading anomalies that have been found to be persistent when constructing equally-weighted portfolios disappear once the portfolios are value-weighted. Anomalies that are present in both equal- and value-weighting are therefore especially meaningful.
24 To test whether the QMJ portfolios experience positive above market returns, I test the Alternative Hypothesis of ∝ ≠ 0 against the Null Hypothesis of ∝ = 0. To do this, the following regressions is used:
𝑟𝑄𝑀𝐽𝑡 = 𝑎 + 𝛽𝑀𝐾𝑇−𝑟𝑓𝑀𝐾𝑇 − 𝑟𝑓𝑡+ 𝜀𝑡 (2)
𝑟𝑄𝑀𝐽𝑡 = 𝑎 + 𝛽𝑀𝐾𝑇−𝑟𝑓𝑀𝐾𝑇 − 𝑟𝑓𝑡+ 𝛽𝑆𝑀𝐵𝑆𝑀𝐵𝑡
+ 𝛽𝐻𝑀𝐿𝐻𝑀𝐿𝑡+𝛽𝑈𝑀𝐷𝑈𝑀𝐷𝑡+ 𝜀𝑡
(3) Again, all standard errors have been tested for the five classical linear regression model assumptions.
3) Is Momentum combination efficient in reducing risk through cross-country diversification effects compared to QMJ
For the second portfolio construction, I apply a momentum portfolio across all QMJ portfolios retrieved before. The number of quantiles in the portfolio calculation is now reduced since there are only 24 country portfolios left to distribute into those baskets.
Momentum is computed by summing the past t-2 to t-12 returns, leaving out the most recent month, which is a common practice to avoid microstructure distortions. This results in a shift of the starting year of our first data point 12 months back. In the next step I calculated three quantiles for the dataset, arriving at two thresholds per month. In the following step I assigned the appropriate quantile to each momentum value. In the last step, the portfolios were built through averaging all returns within each quantile per month and then going long and short in the respective quantiles.
4. Results
The following paragraph will first discuss the findings with regard to the price of quality and then the results from all QMJ portfolios.
4.1. The price of quality
This section will discuss research question 1, whether higher-quality stocks demand higher prices than lower-quality stocks for the subsamples of developed and developing countries. The analysis is conducted as explained in section 3.3.2. Table 4 in the Appendix displays the Fama MacBeth regression results for the developed country sample and Table 5 indicates the results for the developing country sample. Quality is significant within the developed as well as the developing sample, however, coefficients, t-stats, and the adjusted R2 are higher for the
25 developing country sample. The beta for developed markets is around 0.20 (depending on the consideration of fixed effects) and around 0.25 (depending on the consideration of fixed effects) for developing countries. These findings imply that a one standard-deviation change in a company’s quality score (cross-sectionally) will imply a 20% increase in the price-to-book ratio of developed countries and a 25% increase in the price-to-book ratio of developing countries. Asness et al. (2019) find a coefficient of 0.23 for the U.S. sample and 0.17 for the global sample, so the findings are in line considering the shorter time period and the simplified quality calculation of this research. The adjusted R2 significantly increases with the consideration of
fixed effects, however, the highest value is 26%. Asness et al. (2019) also find quite low R2
throughout their sample, the highest value they find in the global sample is 43%, however, their analysis for this respective regression includes other controls, such as firm size, firms age, 1-year return, profit uncertainty and dividend payer. The adjusted R2 including only fixed effects
are in line with my findings.
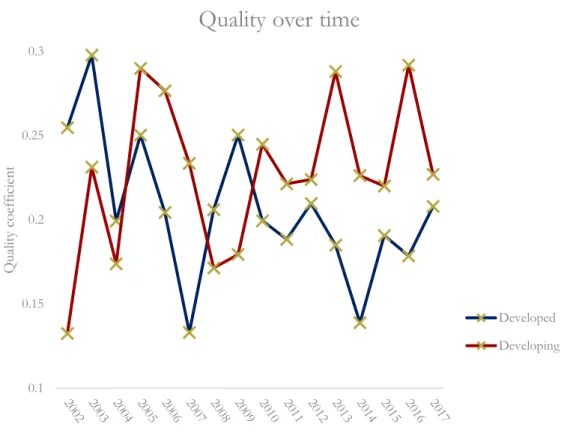
Figure 2: The price of quality over time
Figure 2 displays the variation of the price of quality over time, overall, quality is relatively volatile over time. When looking at the work of Asness et al. (2019), a drop during the internet bubble in 2000 can be observed. The figure above starts in 2002 and we can see the price of quality just recovering from the low of the bubble. We can see another low around the time of
0.1 0.15 0.2 0.25 0.3 Qu alit y co eff ic ie nt
Quality over time
Developed Developing
26 the financial crisis in 2009, and one during the Euro-deflation crisis in 2014 (many of the countries comprising the developed sample are European countries) (telegraph, 2014). Following those negative events, the price of quality increases drastically. The sample of the developing countries starts off following the developed country sample with a small lag, from about 2004 onwards, the developed country sample follows the developing country sample, which changes again in 2014. In 2017, the coefficients move in opposite directions. A reason for this behavior could be the appearance of several crises in developing countries around 2017, such as the escalation of the human crisis in Egypt (middleeastmonitor, 2017) or the increasing tensions between Mexico and the U.S. due to the Trump legislation (crisisgroup, 2017). This development of the price of quality can also be linked to the risk premia from the QMJ portfolio, which will be discussed in more detail in section 4.3.
Figure 3: T-stats per industry from the price on quality regressions
Figure 3 reports the annual Fama MacBeth t-statistics for each industry (as specified in Table 1) from the quality regressions including country and industry fixed effects. All industries are significant, and the price of quality is consistent throughout industries, further, the explanatory power of quality is not driven by one or a few specific industries. In line with Asness et al. (2019), the health care industry has one of the highest t-stats within the developed country sample. Within developed countries overall, the IT and the telecom are the next most pronounced industries, whereas the energy, utilities and finance sectors show the highest t-stats for the developing country sample. These results indicate the stronger shift towards more recent
0 2 4 6 8 10 12 10 15 20 25 30 35 40 45 50 55
Industry Analysis
27 industries within developed countries, whereas the focus within developing countries is more bound towards traditional industries.
4.2. The price of quality sub-components
The quality sub-components are significant throughout the developed country sample, the growth measure is the most pronounced and the safety measure is the least pronounced within the developed country sample, which is in line with the findings from Asness et al. (2019). However, when analyzing the sub-factors for the developing sample, profitability and growth show signs of near multicollinearity and hence, have been kept merged as one score and only safety has been split apart. The measure of profitability and growth is highly significant with a large coefficient throughout the developing country sample. Another interesting finding within the developing country sample is that the safety measure is significantly negative associated with the scaled prices. This indicates that, for developing countries, a one standard deviation change in a stocks safety score is associated with a 10% decrease in its book-to-market ratio, implicating that investors will want to pay less for a safer stock within developing countries. The safety measure is already the least pronounced across the developed market sample as well as throughout the samples of Asness et al. (2019)’s research. A possible explanation for this finding is that riskier stocks are associated with higher returns. Since emerging markets are, on average, associated with higher volatility, investors engaging in developing markets securities are more tilted towards a higher risk-loving nature than the average investor. These investor characteristics could implicate that emerging markets investors are not willing to pay a higher price for low-risk stocks. The finding above has led me to not only to investigate the QMJ portfolio returns for the portfolio constructed as suggested by Asness et al. (2019), but also to reverse the safety score for the developing country portfolios and allocate higher scores to more risky companies. The comparison of the general QMJ portfolios and the high volatility QMJ portfolios for developing countries will be further discussed in section 4.6.
4.3. Quality minus Junk portfolios
This section discusses the quality based long/short portfolio outcomes, Tables 6 – 13 report the regression results and summary statistics for all portfolios.
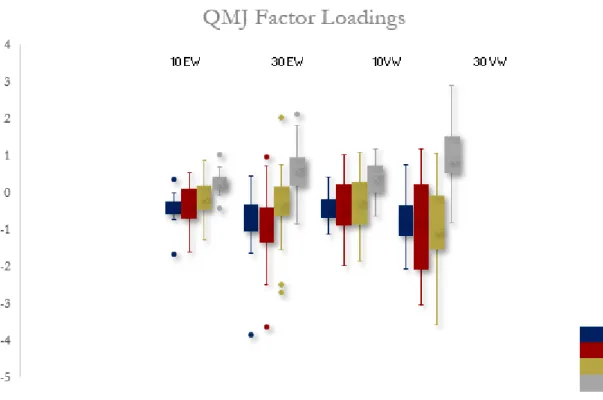
In general, the portfolios going long in the top and short in the bottom decile show a higher frequency of insignificant values and larger tail risks as compared to the portfolios going long and short in the top and bottom three deciles. Furthermore, the 30/30 long/short portfolios show negative correlations to the market, the size, and the value factors, whereas the 10/10 long/short
28 portfolios have less pronounced negative factor loadings as displayed in Figure 4. Developed markets have, on average, a more pronounced negative factor loading towards the market factor (-1.02 for the equally-weighted portfolios and -0.87 for the value-weighted portfolios) when compared to developing markets (-0.67 for the equally-weighted portfolios and -0.64 for the value-weighted portfolios). The factor loadings towards value and size are similar amongst developing and developed countries and average between -0.80 and -0.11.
Due to the overall bad and insignificant performance of the 10% portfolios, they are no longer considered throughout the rest of this thesis, however, all regression outcomes can be found in the Appendix.
Figure 4: QMJ factor loadings
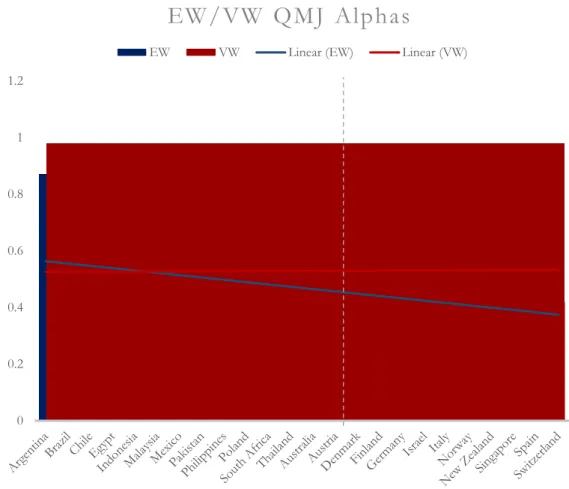
Figure 4 and 5 display the value-weighted and equally weighted QMJ alphas for the 30/30 portfolios. In general, value-weighted portfolios are found to have higher alpha values, however, the developing portfolio sample shows no clear distinction as to which strategy yields higher alpha values. The worse performance of the equally weighted portfolios within developing markets can be explained by the fact that overweighting towards risky small-cap stocks is subject to more volatility within these countries as smaller companies might be even more vulnerable than in developed markets. Furthermore, alphas in developing countries are, on average, slightly higher than for developed countries, the equal-weighted portfolios yield is 0.49 and 0.45 (on average) respectively and the value-weighted portfolios average is 0.54 and
29 0.52 respectively. All portfolio alphas except the value-weighted New Zealand CAPM alpha (consistent with Asness at al. (2019)) are significant at a 5% level. The countries yielding the highest value-weighted alphas are Malaysia (0.98), Poland (0.88), and Norway (0.82). The highest equally weighted alphas are found in Brazil (0.87), Egypt (0.82), and Australia (0.77). Figure 5: EW/VW QMJ alphas
Figure 6 displays the adjusted R2 values for the different portfolio constructions, R2 is in general
much larger in developed markets, when compared to developing markets. 0 0.2 0.4 0.6 0.8 1 1.2
EW/VW QMJ Alphas
30 Figure 6: R2 values for QMJ portfolios
4.4. The Momentum Portfolio
This section will discuss the results from the momentum construction, using the 30% value-weighted QMJ portfolios. Table 14 in the Appendix displays all regression outcomes and summary statistics (UMD is ignored in the regression analysis as the portfolio constructed already represents the momentum factor).
When investing in all QMJ portfolios, the strategy would yield a Sharpe Ratio of 1.73 and a three-factor alpha of 1.53, however, the strategy is also subject to large tail risks, which can be observed in the high value for excess kurtosis (3.13) and the high minimum value of -9.16. The long/short momentum portfolio produces a Sharpe Ratio of 0.68 and a three-factor alpha of 0.33, nevertheless, momentum is efficient in reducing excess kurtosis to 0.81 and the minimum value to -3.99. When examining the performance of both strategies, there seems to be a large trade-off between risk-adjusted returns and tail risks, however, I find one strategy that seems to optimize this trade-off. A long only momentum strategy yields a Sharpe Ratio of 1.52, an alpha of 0.71, an excess kurtosis of 1.52 and a minimum value of even slightly less than the long/short strategy (-3.78). With regard to the factor loadings, the strategy going long in all portfolios has large negative factor loadings and the long only strategy somewhat loses the strength of negativity, however, the values are still significantly negative. Another argument in favor of the long only strategy when compared to investing in all portfolios are lower transaction costs due to larger investments in each single portfolio.
31 Figure 7 displays the countries that are most often shorted (red) and bought (blue) when constructing the momentum portfolio. The darker coloring indicates the higher frequency of buy/sell decisions. In general, developing countries are rather buy countries and developed countries are rather sold countries. This fact confirms the findings throughout this thesis, suggesting that the quality factor is more pronounced in developing countries. The most bought countries in the sample are South Africa and Poland, the country most sold is New Zealand. Figure 7: Countries most bought/sold in the momentum portfolio
4.5. Factor combo portfolios
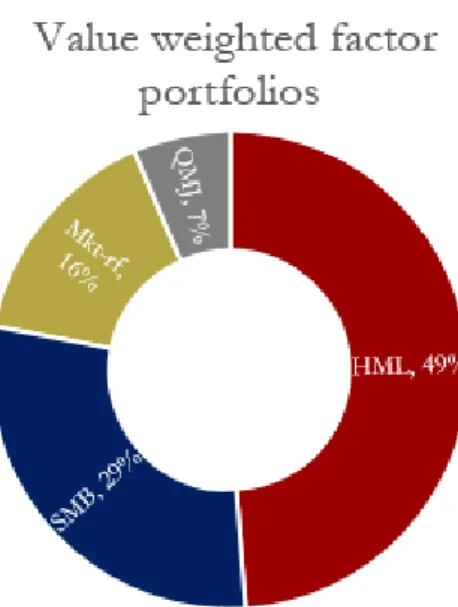
Tables 15 to 22 report the summary statistics for the portfolios discussed in this section. Due to the negative correlation with the three Fama & French factors, this paragraph discusses several combinations of the QMJ portfolios developed above and the Fama & French factors. Each, the value-weighted and the equally weighted QMJ portfolios have been combined with all Fama & French factor separately, the weights towards each factor are 50% respectively in these portfolios. Furthermore, I have constructed a portfolio, combining all four factors, the weights towards each factor have been chosen by maximizing the overall Sharpe Ratios using Excel
32 Solver. This portfolio will be referred to as rainbow portfolio in the following. The weights distributed towards each factor are displayed in Figure 8.
There are no alphas displayed for those portfolios. This is due to the fact that the independent variables are also part of the dependent variable of each portfolio, which distorts the alpha values and the interpretation would lose validity. The Sharpe Ratios of the combo portfolios are overall higher than the general QMJ portfolio Sharpe Ratios (Figures 9 and 10). The rainbow portfolios find the highest Sharpe Ratios (averaging 2.18 for equal-weighting and 1.44 for value-weighting), followed by the market combo portfolio (averaging 1.93 for equal-weighting and 1.04 for value-weighting). Further, the rainbow portfolio is also the most efficient in reducing tail risks, average excess kurtosis is reduced from 6.45 (general QMJ portfolios) to 2.31 for the equal-weighted portfolios and from 6.00 to 2.46 for the value-weighted portfolios. To conclude, each factor combo portfolio reduces tail risks and improves risk-adjusted performance of the portfolios, if only one factor should be chosen to be combined with QMJ, the market factor combo results in the biggest portfolio improvements. However, a combination of all factors with the quality factor will yield the best portfolio characteristics and also outperforms the long only momentum portfolio. Nonetheless, the argument concerning transaction costs arises again, as already mentioned above the long only momentum is more efficient in this issue.
33 Figure 9: Sharpe Ratios for the equal-weighted factor portfolios
Figure 10: Sharpe Ratios for the value-weighted factor portfolios
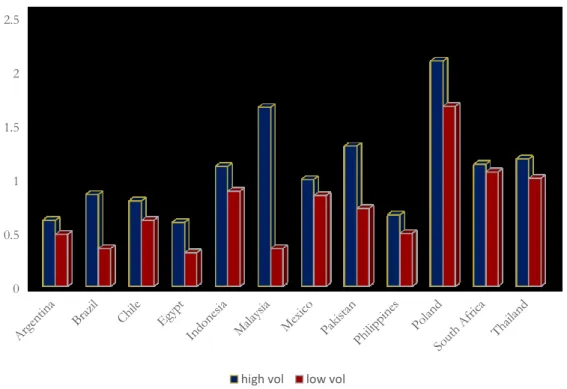
4.6. High-volatility and high-quality trading strategy in emerging
markets
Due to the negative relationship of the safety factor with the scaled prices in the emerging country sample (as mentioned in paragraph 4.2), I decided to construct a volatility, high-quality strategy. The only deviation from the common QMJ portfolios made to construct the portfolios was to reverse the ranking for the safety factor. The safety measure was changed in a way that companies with high risk measures were allocated higher scores. This strategy is
0.00 0.50 1.00 1.50 2.00 2.50 3.00 3.50 4.00
Equal-weighted factor combo portfolios
QMJ Mkt SMB HML Rainbow 0.00 0.50 1.00 1.50 2.00 2.50